The best retail analytics software depends on the job. RELEX Solutions leads for enterprise forecasting, Inventory Planner by Sage for mid-market multi-store inventory planning, and Microsoft Power BI for low-cost BI reporting. Single stores should start with built-in Shopify, Square or Lightspeed reports. Choose the job first, because reporting, BI and planning tools overlap only partly.
Retail analytics software does four different jobs, and no single tool in PlugRoute’s 2026 evaluation leads in all four. Your data sits across a half-dozen systems. Published prices conflict between sources. Polished vendor demos rarely prove that a tool fits your real workflows.
As one user on r/AskRetail described:
“This is actually pretty common in retail. A lot of companies have years of inventory, planning, sales and commerce data, but it lives in different systems and teams.
The real challenge usually isn’t the lack of ML tools, it’s fragmented data and unclear ownership of analytics.” Posted by u/Straight-Phrase2569
Takeaway: For most retailers, the bottleneck in retail analytics is fragmented data and unclear ownership, not a shortage of tools.
PlugRoute has no affiliate relationships with any company listed, and rankings are determined entirely by research data and objective evaluation criteria.
“…allow us to scale reporting to thousands of employees at basically no extra cost, unlike with Tableau which wants to charge us an additional 96k+ per year” (u/NewGuyBIGuy, r/PowerBI, 2018)
Takeaway: How a tool’s price scales with headcount can matter more than its feature list, so price every shortlisted tool at your real user count. This comment dates from 2018.
What Are the 4 Categories of Retail Analytics Tools?
Retail analytics software falls into four categories, and each answers a different question. BI platforms show what happened across systems. Commerce analytics suites show how stores and channels perform. Forecasting and planning platforms show what to reorder and where. CPG retail-data platforms show how products sell at retailers. Choose the category before comparing tools.
- BI Platform software combines data from many systems into custom dashboards. PlugRoute ranked Microsoft Power BI and Tableau here. A BI platform includes no retail data model or forecasting, so someone has to build and maintain the reports.
- Commerce Analytics Suite software delivers prebuilt unified commerce reports for ecommerce and stores without a custom BI build. PlugRoute ranked Triple Whale and Glew here. A commerce analytics suite is not a demand forecasting or replenishment system.
- Forecasting & Planning Platform software predicts demand and automates reordering, allocation and pricing decisions. PlugRoute ranked RELEX Solutions and Inventory Planner by Sage here. A planning platform is not a flexible ad hoc dashboarding tool.
- CPG Retail-Data Platform software collects and standardizes sell-through data from retailers and distributors for consumer brands. PlugRoute ranked Crisp here. A CPG retail-data platform is not built for retailers analyzing their own stores.
Tools from different categories overlap only partly. A tool from one category rarely does another category’s main job well.
Do I Even Need Retail Analytics Software Beyond Shopify or POS Reports?
A single store that mainly needs sales history is often well served by built-in Shopify, Square or Lightspeed reports. Dedicated retail analytics software usually becomes necessary when you need to forecast demand, compare online and in-store sales in one data model, or spot stockout risk across several locations.
Built-in POS reports tell you what sold. Retail analytics software tells you what to reorder, where, and before it runs out.
Users on r/ShopifyeCommerce advised a first-time store owner:
“For later, tools like TripleWhale/Elevar for tracking, Klaviyo for flows, and something like Zipchat for onsite FAQs/conversion help are nice-to-have, not must-have at your stage.
So: keep the stack simple, verify it with real test orders, and accept some noise in the numbers.” Posted by u/Diligent_Narwhal8969
Takeaway: Shopify practitioners treat attribution tools like Triple Whale as a later-stage add-on, not a day-one requirement for a new store.
Here is what built-in analytics cost and include:
- Shopify POS Pro costs $89 per location per month (Shopify pricing page, November 2026).
- Shopify Plus includes the first 20 Shopify POS Pro locations (Shopify pricing page, November 2026).
- Lightspeed puts forecasting and order recommendations in its higher tiers (POSUSA, November 2026).
These signs suggest you have outgrown built-in reports:
- You need demand forecasts or reorder recommendations, not just sales history.
- You cannot compare online and in-store performance in one consistent view.
- You cannot see stockout risk across several locations before it happens.
- Product names that differ between stores or channels break your comparisons.
- You need data updated during the day, not just a daily summary.
According to IHL Group (2026), out-of-stocks and overstocks together cost retailers about $1.7 trillion a year. That is 6.2% of global retail sales, down from 10.4% in 2021. Out-of-stocks account for about 65.6% of the total.
IHL Group counts an overstock as a product sold at more than a 25% discount. IHL Group also reports that 44% of retailers still lack real-time inventory visibility (IHL Group, 2026).
How Does Retail Analytics Software Pricing Scale?
As of November 2026, retail analytics software ranges from free to six figures a year. Starting prices reveal little, because each vendor scales cost differently: by user, by capacity, by revenue, by inventory volume, by data volume, or at a flat rate. Model your cost at your expected size before you shortlist.
| Tool | Pricing Model | Entry Price (verified November 2026) |
|---|---|---|
| RELEX Solutions | Enterprise quote based on stores, DCs, SKUs and modules | Pricing on request |
| Inventory Planner by Sage | Inventory volume, unlimited users | Pricing on request (one user reports ~$4,000/year) |
| Microsoft Power BI | Per user or Fabric capacity | Free; Pro $14/user/month |
| Tableau | Per user, by role | Viewer $15/user/month (requires at least one $75 Creator) |
| Triple Whale | Annual revenue band, unlimited users | Free; Foundation from $219/month |
| Glew | Flat rate, then custom | Pro $250/month, prepaid annually |
| Crisp | Data volume (monthly points of distribution) | Pricing on request; time-limited free trial |
Power BI Pro: $10 or $14? Microsoft Power BI Pro cost $10 per user per month before April 1, 2025. Since then it has cost $14 per user per month, billed annually, for new customers and at renewal. That is a 40% increase.
Microsoft Power BI Premium Per User rose from $20 to $24 on the same date. Microsoft 365 E5 suites were not affected (Microsoft Power BI blog, 2025).
BI platform costs at scale:
- Microsoft Power BI Fabric capacity costs $262.80/month for F2, $1,051.20/month for F8 and $8,409.60/month for F64 on pay-as-you-go. Reserved F64 costs about $5,002.67/month (Microsoft, November 2026).
- Microsoft Power BI’s reserved F64 capacity costs about the same as 357 Pro licenses, and pay-as-you-go F64 costs about the same as 600. Above those viewer counts, capacity is usually cheaper than per-user licenses (PlugRoute calculation from Microsoft list prices, November 2026).
- 105 Microsoft Power BI Pro licenses cost about $1,470/month. Five Tableau Creators plus 100 Viewers on Tableau Standard cost about $1,875/month (PlugRoute calculation from list prices, November 2026).
- Tableau Standard costs $75 per Creator, $42 per Explorer and $15 per Viewer each month. Tableau Enterprise costs $115, $70 and $35 for the same roles. Tableau Cloud+ and Tableau+ are priced through sales (Tableau, November 2026).
Commerce suite costs at scale:
- Triple Whale Foundation costs $219/month for a brand under $250K in revenue. The same brand at $15–20M pays $2,529/month for the same plan (Kanal pricing breakdown, November 2026). Triple Whale confirms the $219 starting price on its own pages.
- Triple Whale Automate runs from $749/month to $4,199/month. Triple Whale Enterprise is custom-priced for brands with $10M+ in revenue (Kanal pricing breakdown, November 2026).
- Glew Pro costs $250/month, prepaid annually at $3,000/year (Glew pricing page, November 2026). Glew Plus and Glew Enterprise are custom-priced.
- Glew’s older third-party listings show conflicting Pro prices of $79/month and $249–$649/month. Users report paying about $2,000/month for a full setup plus $4,000–5,000 for customization (user-reported, November 2026).
Costs for quote-only tools:
- Inventory Planner by Sage charges by inventory volume and publishes no tier prices. PlugRoute could not verify the “$249/month starting price” cited elsewhere, so request a quote.
- RELEX Solutions prices enterprise subscriptions by stores, distribution centers, SKUs, modules and integration complexity (RELEX, November 2026).
- Crisp prices by monthly points of distribution (PODs) plus ecommerce transactions, with example tiers of 0–50K, 50–75K and 200K+ PODs (G2, November 2026).
Warning: The $0, $45, $95 and $295 prices shown on Capterra and G2 belong to Crisp Chat, which is unrelated to the Crisp retail-data platform.
The following first-year cost ranges are unsourced industry estimates compiled in November 2026. Treat them as rough guides only:
- A BI platform built on a data warehouse costs about $25K–$100K in the first year.
- A retail-focused analytics platform costs about $75K–$250K or more in the first year.
- A retail planning platform costs about $150K–$750K or more in the first year.
How Do the Top Retail Analytics Tools Compare at a Glance?
The seven ranked tools do four jobs:
- Forecasting and replenishment: RELEX Solutions and Inventory Planner by Sage.
- Custom BI reporting: Microsoft Power BI and Tableau.
- Prebuilt commerce analytics: Triple Whale and Glew.
- Retailer data for CPG brands: Crisp.
Ranks reflect evidence strength within each job, not universal fit.
| Rank | Company | Category | Best For | One-Line Summary | Key Capabilities | Primary Strength | Key Limitation |
|---|---|---|---|---|---|---|---|
| 1 (3.63/5) | RELEX Solutions | Forecasting & Planning Platform | Large grocery, convenience and specialty chains | RELEX Solutions is an enterprise retail planning platform with the most detailed documented stockout and inventory outcomes in PlugRoute’s 2026 evaluation. | AI forecasting, store and DC replenishment, allocation, promotions, markdowns | Measured stockout reductions at named retailers | Implementation takes months; no public pricing |
| 2 (3.50/5) | Inventory Planner by Sage | Forecasting & Planning Platform | Mid-market retailers with multiple stores or warehouses | Inventory Planner by Sage is a mid-market forecasting and replenishment tool that gives automated reorder recommendations to retailers with multiple locations. | Demand forecasting, automated POs, open-to-buy, multi-location allocation | Reorder recommendations without an enterprise rollout | Quote-only pricing that users report rose after the Sage acquisition |
| 3 (3.45/5) | Microsoft Power BI | BI Platform | Retailers on Microsoft 365 with an in-house analyst | Microsoft Power BI is the lower-cost BI platform in PlugRoute’s 2026 evaluation at $14 per user per month. | Data modeling, dashboards, Fabric integration, Copilot on capacity | Lowest per-user price ($14 Pro); highest G2 rating (4.5/5) among BI tools | No retail data model; Pro limited to 8 refreshes a day and 1 GB datasets |
| 4 (3.40/5) | Tableau | BI Platform | Analyst-led teams that prioritize visual exploration | Tableau is a visual analytics platform with the largest G2 review base in this evaluation, priced above Power BI per user. | Visual exploration, mapping, Tableau Pulse, Tableau Next | Flexible visuals and store-network mapping | Costs more as viewer counts grow; data prep happens elsewhere |
| 5 (3.15/5) | Triple Whale | Commerce Analytics Suite | Shopify DTC brands focused on ad spend | Triple Whale is an attribution-first analytics platform for Shopify DTC brands, starting at $219 per month. | Triple Pixel, attribution, marketing mix modeling, Moby AI agents | Attribution and ROAS analysis in one dashboard | POS data appears limited to Enterprise; support complaints |
| 6 (3.13/5) | Glew | Commerce Analytics Suite | Growing multichannel retailers without a BI team | Glew is an omnichannel analytics suite focused on store operations, with prebuilt sell-through and store reports from $250 per month. | 250+ KPIs, sell-through, markdown and store reporting, 170+ integrations | Prebuilt retail operations metrics | Lowest G2 rating in the set (4.0/5); data-accuracy complaints |
| 7 (3.05/5) | Crisp | CPG Retail-Data Platform | CPG brands selling through retailers and distributors | Crisp is a retail-data platform that unifies sell-through data from retailers such as Target, Amazon and UNFI for CPG brands. | Retailer data collection, hierarchy standardization, out-of-stock root-cause analysis | Standardizes messy retailer data | Quote-only pricing; built for brands, not retailers’ own stores |
Which Retail Analytics Tool Should I Choose for My Use Case?
Match the tool to your most urgent problem, not its overall rank. Single stores should start with built-in reports. Chains of 3–30 stores with stockouts should evaluate Inventory Planner by Sage. Omnichannel retailers that need store and online reporting together should trial Glew. Enterprise chains with complex replenishment should consider RELEX Solutions.
| Your #1 Priority | Recommended Tool | Why | Acceptable Alternative |
|---|---|---|---|
| Single store or small Shopify business | Built-in Shopify, Square or Lightspeed reports | Built-in reports cover sales history at no extra cost | Glew Pro or Triple Whale Foundation, only to fill a specific gap |
| Multi-store chain (3–30 stores) with stockouts | Inventory Planner by Sage | Forecasting and allocation without an enterprise rollout | RELEX Solutions (as you scale) |
| Enterprise chain with fresh, promotion or replenishment complexity | RELEX Solutions | Most specific measured stockout and spoilage outcomes | Inventory Planner by Sage (smaller scope) |
| Omnichannel store and online operations reporting | Glew | Prebuilt sell-through and store-level metrics | Microsoft Power BI (with an analyst) |
| Shopify DTC brand focused on ad spend | Triple Whale | Attribution and marketing mix modeling | Glew |
| Retailer on Microsoft 365 with an analyst | Microsoft Power BI | $14/user Pro price; often bundled with existing licensing | Tableau |
| Analyst-led team that prioritizes visual exploration | Tableau | Flexible visuals and mapping | Microsoft Power BI |
| CPG brand selling through retailers | Crisp | Standardizes retailer and distributor data | Microsoft Power BI fed by retailer exports |
Worked scenario: A 12-store apparel retailer runs Shopify POS and NetSuite and has recurring stockouts. This retailer needs reorder recommendations first. Inventory Planner by Sage integrates with both systems, so it addresses the stockouts directly.
The same retailer needs cross-store reporting second, through Glew or Microsoft Power BI. Buying a BI tool first would show the stockouts more clearly but would not prevent them.
What Are the 7 Best Retail Analytics Software Tools in 2026?
PlugRoute’s November 2026 evaluation ranks RELEX Solutions first (3.63/5) for enterprise forecasting. Inventory Planner by Sage (3.50), Microsoft Power BI (3.45), Tableau (3.40), Triple Whale (3.15), Glew (3.13) and Crisp (3.05) follow. Ranks 2–4 sit within 0.10 points of each other, as do ranks 5–7. Match each tool’s job to your problem before comparing ranks.
- RELEX Solutions ranks #1 (3.63/5) and is best for enterprise forecasting and replenishment.
- Inventory Planner by Sage ranks #2 (3.50/5) and is best for mid-market inventory forecasting across multiple locations.
- Microsoft Power BI ranks #3 (3.45/5) and is best for low-cost BI reporting with an in-house analyst.
- Tableau ranks #4 (3.40/5) and is best for visual exploration in analyst-led teams.
- Triple Whale ranks #5 (3.15/5) and is best for ad attribution in Shopify DTC brands.
- Glew ranks #6 (3.13/5) and is best for store-operations reporting without a BI team.
- Crisp ranks #7 (3.05/5) and is best for CPG brands analyzing retailer sell-through data.
Every entry below follows the same structure for direct comparison. Every case-study figure is labeled by where it came from.
1. RELEX Solutions: Best for Enterprise Forecasting, Replenishment, and Retail Planning
Category: Forecasting & Planning Platform, software that predicts demand and automates replenishment, allocation and pricing decisions, rather than only reporting on past sales.
At a Glance
- Category: Forecasting & Planning Platform
- Best For: Large grocery, convenience and specialty chains managing store-by-SKU replenishment, fresh food and promotions
- Price Range: Pricing on request (enterprise subscription; verified November 2026)
- Primary Strength: RELEX Solutions documents measured stockout and inventory reductions at named retailers such as Rossmann and Franprix.
- Biggest Limitation: RELEX Solutions requires an enterprise implementation measured in months, clean master data and, typically, consultant support.
- One-Line Summary: RELEX Solutions is an enterprise retail planning platform with the most detailed documented stockout and inventory outcomes in PlugRoute’s 2026 evaluation, and it suits large chains rather than small or mid-sized retailers.
- Last Verified: November 2026
Overview
RELEX Solutions is an enterprise retail planning and optimization platform. RELEX Solutions uses AI demand forecasting to automate store and warehouse replenishment, allocation, promotions and markdowns. It is built for large grocery, convenience and specialty chains that manage many SKUs across many locations.
RELEX Solutions was founded in Helsinki in 2005 and reports more than 700 customers, including The Home Depot, PetSmart and Dollar Tree (RELEX, vendor-stated, accessed November 2026). RELEX Solutions is a planning system, not a BI or dashboarding tool.
Key Features
- RELEX Solutions forecasts demand at the SKU-by-location level with AI-driven demand sensing that accounts for promotions, seasonality and local store patterns.
- RELEX Solutions automates replenishment at both store and distribution-center level.
- RELEX Solutions runs allocation, assortment and space planning on the same platform as forecasting.
- RELEX Solutions offers promotion and markdown optimization to reduce excess promotional stock and end-of-season waste.
- RELEX Solutions extends into workforce and supply chain planning for retailers that want planning in one system.
Best For
RELEX Solutions is best for large chains with many locations, especially grocery, fresh food and convenience retailers, whose biggest cost problem is stockouts, spoilage and overstock rather than a lack of reporting.
Strengths
- RELEX Solutions reports that after Rossmann’s February–September 2017 implementation, stockouts fell 17% in the first December season and 25% in the first Easter period. Stores with availability problems fell 85% within three months, and promotional inventory fell 30% (RELEX case study, vendor-published, accessed November 2026).
- RELEX Solutions customer Franprix recorded 67% fewer stockouts, 30% less fresh-product spoilage, €1.7M lower inventory value and a 2-percentage-point margin gain (RELEX customer story via CaseStudies.com, vendor-published, accessed November 2026).
- RELEX Solutions reports a 67% stockout decrease and 8.5% better ultra-fresh availability among its convenience-store customers (RELEX convenience page, vendor-published, accessed November 2026).
- RELEX Solutions holds 4.6/5 on Gartner Peer Insights in the Intelligent Retail Business Applications market, with no review count displayed. That market differs from the one used for the BI-platform ratings in this article (Gartner Peer Insights, November 2026).
Limitations
RELEX Solutions trades accessibility for planning depth. It sells through an enterprise sales process, publishes no pricing, and its reference implementation took about seven months (Rossmann, 2017). That puts RELEX Solutions out of reach for most single-store and small multi-store retailers.
- RELEX Solutions implementations depend on clean master data and often on consultants, according to recurring themes in Gartner Peer Insights reviews (November 2026).
- RELEX Solutions is costly for mid-sized retailers, according to the same Gartner Peer Insights reviewer themes (November 2026).
- One Gartner Peer Insights reviewer says RELEX Solutions needs improvement for “instant updates” (Gartner Peer Insights, November 2026).
- RELEX Solutions is not a BI tool, so retailers still need a separate reporting layer for ad hoc dashboards.
- RELEX Solutions has no Reddit discussion, so user sentiment comes mainly from Gartner reviews and vendor case studies.
Verdict
RELEX Solutions has the most detailed documented retail outcomes in PlugRoute’s 2026 evaluation, with vendor-published stockout reductions of 17% to 67% at named retailers including Rossmann and Franprix.
RELEX Solutions ranks #1 (3.63/5). It scores 5/5 on documented outcomes and retail depth but 1/5 on pricing transparency. RELEX Solutions fits enterprise chains whose stockout and spoilage costs justify a multi-month rollout. Smaller retailers should look at Inventory Planner by Sage first.
2. Inventory Planner by Sage: Best for Mid-Market Forecasting Across Stores and Warehouses
Category: Forecasting & Planning Platform.
At a Glance
- Category: Forecasting & Planning Platform
- Best For: Established Shopify, BigCommerce, Amazon, Lightspeed or NetSuite merchants with multiple stores or warehouses and recurring stockouts or overstock
- Price Range: Pricing on request (priced by inventory volume; one reviewer reports ~$4,000/year; verified November 2026)
- Primary Strength: Inventory Planner by Sage turns sales history, seasonality and lead times into specific reorder and allocation recommendations without an enterprise implementation.
- Biggest Limitation: Inventory Planner by Sage has opaque, volume-based pricing that users report rose sharply after the Sage acquisition.
- One-Line Summary: Inventory Planner by Sage is a mid-market demand forecasting and replenishment tool that gives retailers with multiple locations automated reorder recommendations, though its pricing is quote-only and users report it has risen since 2022.
- Last Verified: November 2026
Overview
Inventory Planner by Sage is a demand forecasting and replenishment tool. It recommends what to reorder and how much, based on seasonality, promotions, lead times and stockout history. It is built for established Shopify, BigCommerce, Amazon and NetSuite merchants running multiple warehouses or stores.
Inventory Planner by Sage has belonged to Sage since January 2022, when Sage acquired Brightpearl, which had bought Inventory Planner in 2021. Inventory Planner by Sage is a forecasting tool, not a general BI or marketing analytics platform.
Key Features
- Inventory Planner by Sage forecasts demand while adjusting for seasonality, promotions, supplier lead times and periods when items were out of stock.
- Inventory Planner by Sage recommends reorder quantities and automates purchase order creation.
- Inventory Planner by Sage supports allocation across multiple warehouses and stores, so retailers can distribute stock between locations.
- Inventory Planner by Sage includes open-to-buy budgeting and more than 200 report metrics.
- Inventory Planner by Sage integrates with Shopify, BigCommerce, Amazon, NetSuite, Lightspeed, Cin7 and third-party logistics providers, with unlimited users on every plan.
Best For
Inventory Planner by Sage is best for retailers and ecommerce brands with multiple locations and roughly $1M–$100M in revenue that need forecasting and replenishment but can’t justify an enterprise planning rollout.
Strengths
- Inventory Planner by Sage holds 4.3/5 from 154 Shopify App Store reviews and 4.5/5 from 42 G2 reviews. Reviewers praise its forecasting, purchase orders and multi-location support (Shopify App Store, November 2026; G2, November 2026).
- Inventory Planner by Sage reports that athleisure brand AYBL improved stock availability and became around six times more profitable after adopting the tool (Inventory Planner customer story, vendor-published, accessed November 2026).
- Inventory Planner by Sage customer Astrid & Miyu cut store allocation from a full day to a couple of hours. Baik Brands cut purchase-order creation from about an hour to 15 minutes (Inventory Planner customer stories, vendor-published, accessed November 2026).
- Inventory Planner by Sage had 2,060 customers when Brightpearl acquired it in September 2021, and 60% of them had $1M–$100M in annual revenue (Inventory Planner announcement, 2021).
Limitations
Inventory Planner by Sage has become less predictable on cost since the ownership change. Pricing is quote-only. One long-time user reports that prices tripled after the Sage acquisition (Shopify App Store review, user-reported, November 2026).
One small retailer on r/supplychain described their integration experience:
“Fast forward a few months: integration was supposed to be simple but we ended up hiring outside consultants just to make sense of it. Every time there was a middleware update we basically had to start over. Duplicates everywhere, stock levels wrong, the whole thing never actually worked, like not even close.” Posted by u/Tumbleweed-Forsaken
Takeaway: Inventory Planner by Sage integrations with less familiar ERPs can fail outright, so smaller retailers should get proof of ERP experience before signing.
- Inventory Planner by Sage is expensive for smaller businesses and startups, according to G2 reviewers (November 2026).
- Inventory Planner by Sage stock and sales syncs are sometimes delayed, according to G2 reviewers, who also cite no way to exclude dropship orders from forecasts (G2, November 2026).
- One Shopify App Store reviewer reports an Inventory Planner by Sage sync failure that lasted more than 21 days partway through a prepaid year (Shopify App Store, user-reported, November 2026).
- One Trustpilot reviewer reports losing an Inventory Planner by Sage 3PL integration mid-contract, and other reviewers report weaker support since the acquisition (Trustpilot, user-reported, November 2026).
- Inventory Planner by Sage has no Reddit discussion, so sentiment comes from app-store, G2 and Trustpilot reviews.
Verdict
Inventory Planner by Sage is the highest-scoring mid-market forecasting tool in PlugRoute’s 2026 evaluation (3.50/5). It gives retailers with multiple locations automated reorder and allocation recommendations without an enterprise planning rollout.
Inventory Planner by Sage ranks #2 because it scores 4.5/5 on retail depth and 4/5 on integrations, offset by quote-only pricing (2/5). Inventory Planner by Sage leads #3 by only 0.05 points, which PlugRoute treats as a tie. Get a multi-year price commitment in writing, and test sync reliability with your own SKUs during the trial.
3. Microsoft Power BI: Best for Low-Cost BI Reporting on Microsoft With an In-House Analyst
Category: BI Platform, general-purpose business intelligence software that combines data from many systems into custom dashboards, but requires the buyer to build retail-specific data models.
At a Glance
- Category: BI Platform
- Best For: Retailers already on Microsoft 365 with an analyst who can model POS, ecommerce, ERP and inventory data
- Price Range: Free; Pro $14/user/month; Premium Per User $24/user/month; Fabric capacity from $262.80/month pay-as-you-go (verified November 2026)
- Primary Strength: Microsoft Power BI has the lowest per-user price ($14 Pro) and the highest G2 rating (4.5/5) among the BI platforms evaluated.
- Biggest Limitation: Microsoft Power BI has no built-in retail data model, and Pro limits datasets to 8 scheduled refreshes a day and 1 GB.
- One-Line Summary: Microsoft Power BI is the lower-cost BI platform in PlugRoute’s 2026 evaluation at $14 per user per month, but it needs an analyst to build retail data models and is not a forecasting or replenishment system.
- Last Verified: November 2026
Overview
Microsoft Power BI is a general-purpose business intelligence platform that combines data from POS, ecommerce, ERP and inventory systems into shared reports and dashboards. It suits retailers already on Microsoft 365 that have an analyst who can build and maintain retail data models.
Microsoft Power BI combines Desktop for authoring (Windows only), the Power BI Service for sharing, and Microsoft Fabric for data engineering. POS and Shopify data usually reach Microsoft Power BI through an API, an ETL/ELT connector or a data warehouse. An analyst then builds the retail semantic model.
Key Features
- Microsoft Power BI provides data modeling and interactive dashboards, which G2 reviewers rank among its strongest capabilities (G2, November 2026).
- Microsoft Power BI integrates natively with Excel, SQL Server and the wider Microsoft 365 and Dynamics ecosystem.
- Microsoft Power BI connects to Microsoft Fabric for data engineering, warehousing and real-time analytics on larger retail datasets.
- Microsoft Power BI offers Copilot AI assistance only on eligible Fabric or Power BI capacity, not on Free or Pro licenses.
- Microsoft Power BI lets people view reports without paid licenses only when the content sits on F64 Fabric capacity or above.
Best For
Microsoft Power BI is best for growing omnichannel retailers and chains that already pay for Microsoft 365, have at least one analyst to model retail data, and need one reporting layer across several systems.
Strengths
- Microsoft Power BI holds 4.5/5 from 1,662 G2 reviews and 4.4/5 from 4,142 Gartner Peer Insights ratings (G2, November 2026; Gartner Peer Insights, November 2026).
- Microsoft Power BI was named a Leader in Gartner’s 2025 Magic Quadrant for Analytics and BI Platforms (CX Today, 2025). Microsoft partner sources say it ranked highest on Ability to Execute for the seventh year in a row (MWPro, partner-reported, 2025).
- Microsoft Power BI is deployed at KMD Brands (Kathmandu, Rip Curl, Oboz) and at Chalhoub Group, which uses Microsoft Fabric to combine data from several ERP and SaaS systems. No measured outcomes are disclosed (Microsoft customer stories, vendor-published, accessed November 2026).
- Microsoft Power BI is often adopted through existing Microsoft licensing. One practitioner said their organization “dropped our Tableau licences entirely” after Power BI came with its Enterprise 365 license (u/wazzel2u, r/PowerBI, 2018). Takeaway: In this 2018 discussion, existing Microsoft 365 licensing was the main reason teams chose Power BI over Tableau.
Limitations
Microsoft Power BI keeps licensing cheap at the cost of build effort. Microsoft Power BI ships with no retail data model, so someone has to connect POS, ecommerce and inventory data and then maintain the reports.
- Microsoft Power BI Pro caps scheduled refreshes at 8 a day and imported datasets at 1 GB (Microsoft, November 2026). That limits intraday sales tracking and detailed SKU-by-store-by-day data.
- Microsoft Power BI’s workarounds for those caps, such as incremental refresh, DirectQuery or Fabric capacity, add cost and complexity.
- Microsoft Power BI requires F64 capacity for free viewing, which costs $8,409.60/month on pay-as-you-go or about $5,002.67/month reserved (Microsoft, November 2026).
- Microsoft Power BI’s DAX formula language has a steep learning curve, and large reports can be slow, according to G2 reviewers (November 2026).
- Microsoft Power BI Desktop runs only on Windows, and Gartner reviewers report difficulty sharing reports with suppliers or franchisees (Gartner Peer Insights, November 2026).
In a 2019 r/PowerBI thread about rolling out reports across a 150+ location franchise, one user noted:
“Premium also has more functionality as well as many more allowed refreshes. Pro is limited to 8 a day.
If the pattern continues, expect more new functionality to be Premium only. A company with less than 500 users can see value if they need some of the enhanced premium features.” Posted by u/TumbleRoad
Takeaway: Multi-location retailers have hit Microsoft Power BI Pro’s refresh cap since at least 2019, so budget for a capacity upgrade rather than assuming Pro will cover the whole rollout.
Verdict
Microsoft Power BI is the lower-cost BI platform in PlugRoute’s 2026 evaluation, combining a $14 per-user Pro price with a 4.5/5 G2 rating from 1,662 reviews (G2, November 2026).
Microsoft Power BI ranks #3 (3.45/5). It scores 5/5 on review ratings and pricing transparency but 2/5 on retail depth and documented retail outcomes, because Microsoft’s retail stories publish no measured results. Budget for data modeling, and pair Microsoft Power BI with a forecasting tool if stockouts are the core problem.
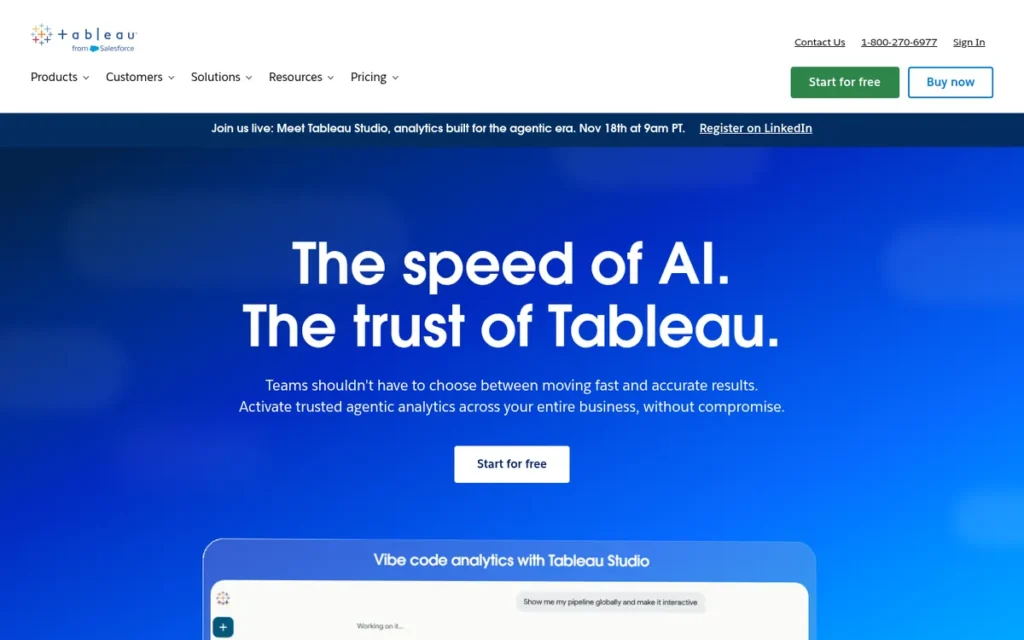
4. Tableau: Best for Visual Exploration and Store-Network Mapping in Analyst-Led Teams
Category: BI Platform.
At a Glance
- Category: BI Platform
- Best For: Analyst-led retail teams with larger budgets who prioritize visual exploration and store-network maps
- Price Range: Standard: Viewer $15, Explorer $42, Creator $75/user/month; Enterprise: $35/$70/$115; billed annually (verified November 2026)
- Primary Strength: Tableau has the most flexible visual exploration and mapping among the BI platforms evaluated, according to G2 reviewers and Reddit practitioners.
- Biggest Limitation: Tableau becomes expensive as viewer counts grow, and it works mainly as a visualization layer that needs data prepared elsewhere.
- One-Line Summary: Tableau is a visual analytics platform for analyst-led retail teams with the largest G2 review base in this evaluation, but it costs more per user than Microsoft Power BI and offers no built-in retail planning.
- Last Verified: November 2026
Overview
Tableau is a Salesforce-owned visual analytics platform that lets analysts explore store, product and inventory data through interactive dashboards and maps. Tableau is built for analyst-led retail teams with larger budgets who care more about flexible visual exploration than built-in retail planning.
Tableau comes as Tableau Cloud, Tableau Server, Tableau Pulse and Tableau Next. Tableau offers retail accelerators, but they do not make it a planning or replenishment system. Retail data usually has to be modeled in a data warehouse before it reaches Tableau.
Key Features
- Tableau provides interactive visual exploration with flexible sorting, tooltips, dual-axis charts and dimensions driven by parameters.
- Tableau includes mapping that is useful for analyzing store networks and regional performance.
- Tableau Pulse tracks key metrics and sends AI-written summaries to business users.
- Tableau Next and Agentforce add AI-agent analytics within the Salesforce ecosystem.
- Tableau is available as managed Tableau Cloud or self-hosted Tableau Server, at matching tier prices.
Best For
Tableau is best for mid-sized and enterprise retailers with dedicated analysts and existing data-preparation infrastructure, especially Salesforce-centric organizations that value visual exploration over license cost.
Strengths
- Tableau has the largest G2 review base in this evaluation, with 4,237 reviews and a 4.4/5 rating. It also holds 4.4/5 from 4,771 Gartner Peer Insights ratings (G2, November 2026; Gartner Peer Insights, November 2026).
- Tableau is used by Whole Foods Market across 460 stores as “a single source of truth” for customer experience and operations (Tableau retail page, accessed November 2026; no measured outcome published).
- Tableau states it was named a Leader in Gartner’s Magic Quadrant for Analytics and BI for the 14th year in the 2026 report (Tableau, vendor-stated, 2026).
- Tableau’s visual flexibility gets credit even from practitioners who prefer Power BI. They cite “more flexible sorting, more flexible tool tips, better dual axis options” (u/TheePaulster, r/PowerBI, 2018). Takeaway: In this 2018 discussion, practitioners on both sides agreed that Tableau’s visuals were more flexible.
Limitations
Tableau gives up cost efficiency for visual power. G2 reviewers say Tableau licensing gets “expensive as audience size increases” and call it “more of a visualization layer than a data-prep tool” (G2, November 2026).
- Tableau’s LOD calculations have a steep learning curve, according to G2 reviewers (November 2026).
- Tableau slows down on large workbooks and external database connections, according to G2 and Gartner Peer Insights reviewers (November 2026).
- Tableau administration is difficult, according to Gartner Peer Insights reviewers (November 2026).
- Tableau’s mobile deployment “has long been a weakness,” one practitioner wrote in 2018 (u/wazzel2u, r/PowerBI, 2018). PlugRoute found no newer confirmation. Takeaway: Test Tableau’s mobile experience yourself rather than relying on this dated comment.
- Tableau users worry that development is shifting toward Tableau Next and could add cost (BARC review of Tableau Cloud, accessed November 2026).
Verdict
Tableau is the visual-exploration choice among the BI platforms in PlugRoute’s 2026 evaluation, with the largest G2 review base (4,237 reviews, November 2026). However, Tableau costs about 28% more than Microsoft Power BI for a 105-user deployment.
Tableau ranks #4 (3.40/5). It matches Microsoft Power BI on review strength (5/5) and retail depth (2/5), but it scores 4/5 on pricing transparency because Tableau Cloud+ and Tableau+ are priced through sales.
The 28% figure compares 5 Tableau Creators plus 100 Viewers ($1,875/month) with 105 Power BI Pro licenses ($1,470/month) (PlugRoute calculation from list prices, November 2026). Check your exposure to the Tableau Next roadmap before signing a multi-year contract.
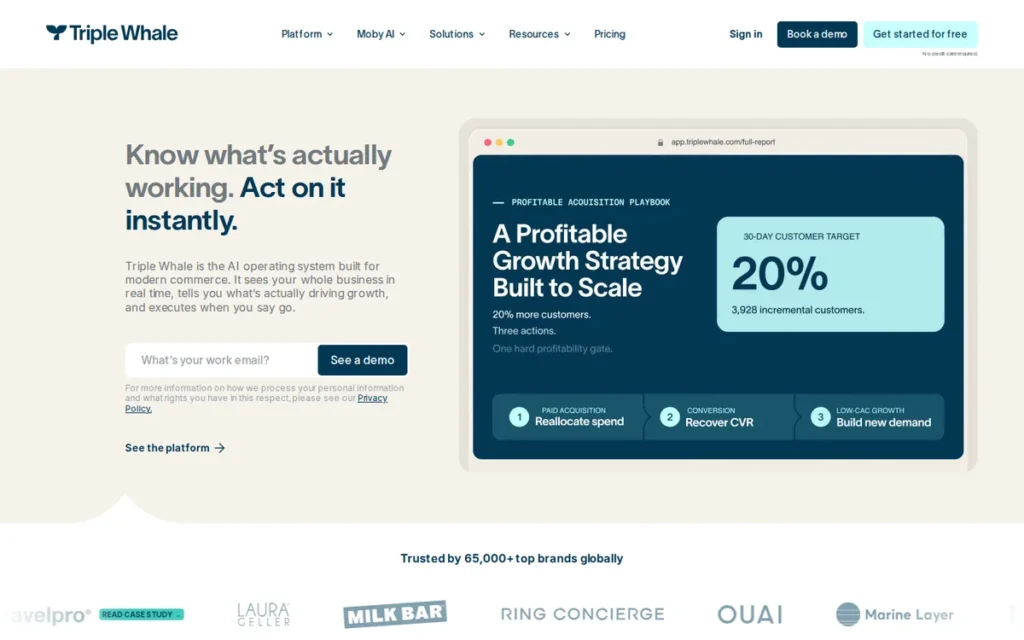
5. Triple Whale: Best for Attribution-First Analytics in Shopify DTC Brands
Category: Commerce Analytics Suite, prebuilt ecommerce and omnichannel analytics that combine store, online and marketing data without a custom BI build.
At a Glance
- Category: Commerce Analytics Suite
- Best For: Shopify-based direct-to-consumer brands whose main question is which ad spend drives profitable revenue
- Price Range: Free plan; Foundation $219–$2,529/month and Automate $749–$4,199/month by annual revenue band; Enterprise custom (verified November 2026)
- Primary Strength: Triple Whale combines first-party tracking, attribution and marketing mix modeling for Shopify DTC brands in one dashboard.
- Biggest Limitation: Triple Whale focuses on ad spend rather than store operations, and POS and retail data appear to require the Enterprise tier.
- One-Line Summary: Triple Whale is an attribution-first analytics platform for Shopify DTC brands, starting at $219 per month. It is strongest for ad-spend decisions and weakest for in-store operations and support responsiveness.
- Last Verified: November 2026
Overview
Triple Whale is a Shopify-native ecommerce intelligence platform that combines first-party pixel tracking, multi-touch attribution, marketing mix modeling and AI agents. Triple Whale is built for direct-to-consumer brands whose central question is which ad spend drives profitable revenue, not how their stores perform.
Triple Whale reports serving 60,000+ brands. Its own pages give two different figures for tracked revenue, $50B+ and $65B+ (Triple Whale, vendor-stated, accessed November 2026). Triple Whale is not a store-operations or inventory forecasting tool.
Key Features
- Triple Whale tracks customer journeys with its first-party Triple Pixel to support multi-touch attribution.
- Triple Whale Compass provides marketing mix modeling, multi-touch attribution and incrementality testing on higher tiers.
- Triple Whale’s Moby AI agents automate media buying and analysis tasks.
- Triple Whale includes dashboards and Creative Studio for analyzing ad-creative performance.
- Triple Whale’s data model is designed to combine online and in-store orders, though POS and retail data appear to be an Enterprise-tier feature.
Best For
Triple Whale is best for Shopify DTC brands that spend meaningful amounts on paid acquisition and need blended ROAS and attribution analysis more than inventory or store reporting.
Strengths
- Triple Whale reports that True Classic gained 36% ROAS using Moby Media Buyer, and that LSKD prevented $100K+ in fraud while gaining 40% ROAS (Triple Whale case studies, vendor-published, accessed November 2026).
- Triple Whale reports that SFERRA achieved 3× ROAS and $300K+ in incremental revenue (Triple Whale case studies, vendor-published, accessed November 2026).
- Triple Whale holds 4.5/5 from about 482 G2 reviews, while Triple Whale’s own blog cites 4.6 (G2, November 2026). Shopify App Store reviewers praise its clean layout and speed (Shopify App Store, 4.1/5, November 2026).
- Triple Whale publishes revenue-band pricing from $219 per month with unlimited users, which is more transparent than most tools in this evaluation.
Limitations
Triple Whale gives up store-operations coverage for marketing depth. POS and retail data appear to sit in the Enterprise tier, so retailers with several stores get little help from Triple Whale with sell-through, stockouts or store performance.
- Triple Whale’s revenue-band pricing rises as a brand grows, so costs go up with success (Kanal pricing breakdown, November 2026).
- One user on a non-Shopify store reported that “nearly half of all our orders have no source assigned” in Triple Whale, with a support case unresolved for almost three months (u/Upstairs-Peanut-5756, r/triplewhale, 2025).
- One user reported that Triple Whale’s AI automation overwrote manually set rules and called the system “unusable for us” (u/Kind_Problem1454, r/triplewhale, 2025).
- One Shopify App Store reviewer called Triple Whale customer service “almost impossible to reach” (Shopify App Store, user-reported, November 2026).
Takeaway: Reported Triple Whale problems cluster on non-Shopify stores and on AI automation overriding manual settings.
Verdict
Triple Whale is the only attribution-first analytics platform in PlugRoute’s 2026 evaluation and fits Shopify DTC brands whose main question is ad-spend efficiency. Triple Whale is a marketing analytics tool, not a store operations or inventory platform.
Triple Whale ranks #5 (3.15/5). It scores 4/5 on pricing transparency and review ratings but 2.5/5 on retail-store depth. Triple Whale moved up from #6 after PlugRoute confirmed its G2 rating in November 2026.
One Reddit user warned that “if it doesnt work out of the box its more likely it will never work” (u/lego_hellothere, r/triplewhale, 2025). Takeaway: Validate Triple Whale’s attribution on your own store setup during the trial, before committing to an annual plan.
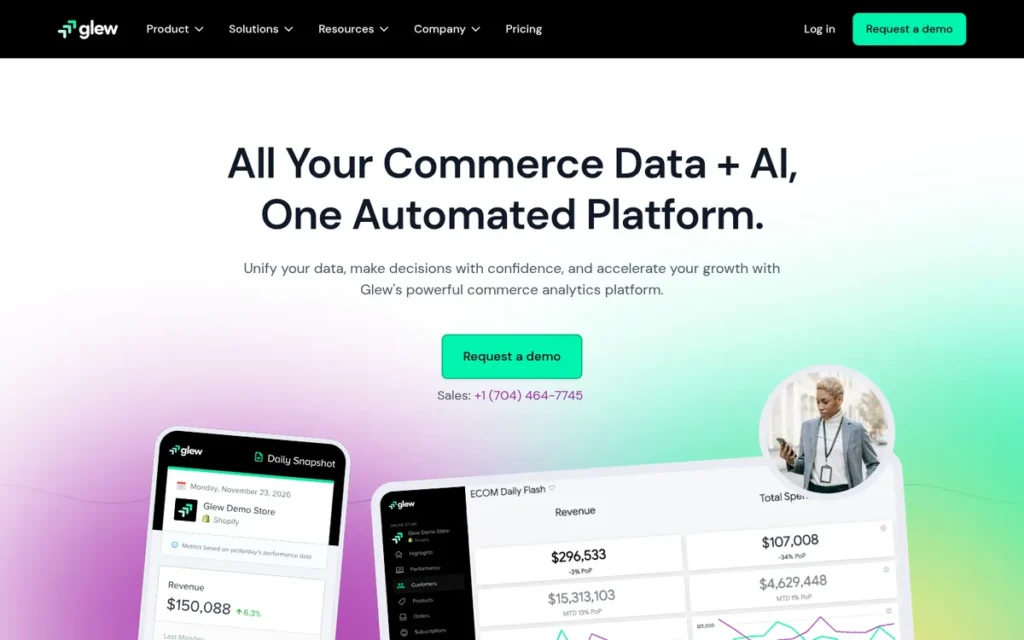
6. Glew: Best for Store-Operations Reporting in Growing Multichannel Retailers
Category: Commerce Analytics Suite.
At a Glance
- Category: Commerce Analytics Suite
- Best For: Growing multichannel retailers that have outgrown Shopify or BigCommerce reports but lack an in-house BI team
- Price Range: Glew Pro $250/month (prepaid annually, $3,000/year); Plus and Enterprise pricing on request (verified November 2026)
- Primary Strength: Glew delivers 250+ prebuilt retail KPIs, including sell-through and store-level reporting, without a custom BI build.
- Biggest Limitation: Glew has the lowest G2 rating in this evaluation, and reviewers repeatedly raise data-accuracy and support concerns.
- One-Line Summary: Glew is an omnichannel analytics suite focused on store operations that gives growing retailers prebuilt sell-through, inventory and store reports from $250 per month, though reviewers report recurring data-accuracy and support problems.
- Last Verified: November 2026
Overview
Glew is an ecommerce and omnichannel analytics suite with 250+ prebuilt retail KPIs, customer segmentation, and inventory and sell-through reporting across 170+ integrations. Glew is built for growing multichannel retailers that have outgrown Shopify or BigCommerce reports but lack an in-house BI team.
Glew offers Glew Pro for prebuilt reporting and Glew Plus for a managed pipeline, a data warehouse and a bundled Looker license. Glew is a unified commerce reporting tool, not a demand forecasting tool.
Key Features
- Glew Pro includes 250+ KPIs, 30 prebuilt customer segments, and LTV, inventory and subscription analytics.
- Glew reports retail operations metrics, including sell-through, full-price versus markdown sales, and store-level performance.
- Glew connects to more than 170 integrations, including POS systems, ERP systems and offline store data.
- Glew Plus adds a fully managed data pipeline, a data warehouse and a bundled Looker license with prebuilt models.
- Glew sends daily email snapshots so nontechnical staff can track key metrics without logging in.
Best For
Glew is best for multichannel retailers, from a handful of stores up to a few dozen, that need online and in-store reporting on sell-through and inventory in one place but don’t want to build a BI stack.
Strengths
- Glew customer Hemline consolidated reporting across 30 stores, and The Little Market reported a 15% revenue increase (Glew case studies, vendor-published, accessed November 2026).
- Glew holds 4.3/5 from 59 Capterra reviews, with 4.2/5 for ease of use, and one reviewer called it “an absolute dream to work with” (Capterra, November 2026).
- Glew publishes a $250 per month Pro price, which makes it one of the few transparently priced tools between built-in reports and enterprise platforms (Glew pricing page, November 2026).
- Glew reviewers praise reporting that BigCommerce doesn’t offer natively (G2, November 2026).
Limitations
Glew trades customization depth for prebuilt convenience, and reviewers raise reliability concerns. Glew has the lowest G2 rating in this evaluation (4.0/5 from 57 reviews), and G2 flags “data inaccuracy” and “data management issues” as recurring themes (G2, November 2026).
- One Glew reviewer reports spending months trying to configure sell-through reporting before an account manager acknowledged the software wasn’t working as expected (Software Finder, user-reported, November 2026).
- Glew users say newly added products don’t appear in imports until they file a support ticket (Software Finder and Capterra, user-reported, November 2026).
- Glew reviewers on the Shopify App Store cite poor customer service and missing Google and Amazon connections (Shopify App Store, about 4.0/5 from 68 reviews, November 2026).
- PlugRoute could not confirm Glew’s specific Lightspeed and Square connectors.
- Glew’s pricing above Pro is custom, and users report full setups costing far more than the $250 entry price (user-reported, November 2026).
Verdict
Glew is the more store-operations-focused of the two commerce analytics suites in PlugRoute’s 2026 evaluation, with prebuilt sell-through and store reporting from $250 per month. Glew also has the lowest G2 rating in the evaluation.
Glew ranks #6 (3.13/5). It scores 3.5/5 on retail depth but 2/5 on usability and support because complaints recur. Glew sits 0.02 points behind Triple Whale, which PlugRoute treats as a tie. During the trial, check Glew’s numbers against your own POS and confirm your POS connector is supported.
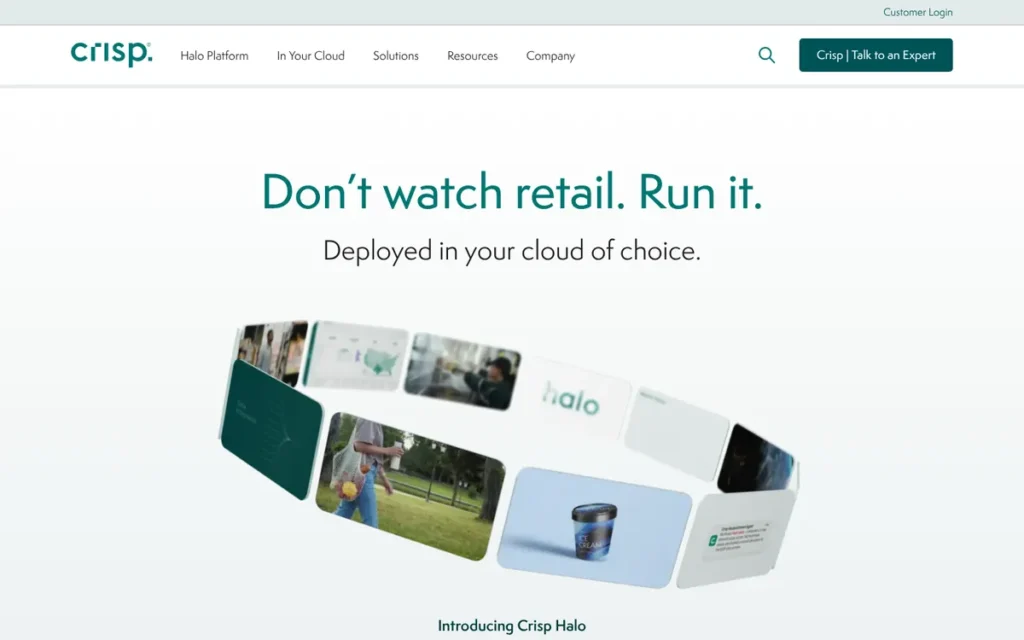
7. Crisp: Best for CPG Brands Analyzing Retailer and Distributor Sell-Through Data
Category: CPG Retail-Data Platform, software that collects and standardizes sell-through data from retailers and distributors for consumer brands, not for retailers’ own stores.
At a Glance
- Category: CPG Retail-Data Platform
- Best For: CPG brands selling through multiple retailers and distributors that need store- and SKU-level sell-through data in one place
- Price Range: Pricing on request (priced by monthly points of distribution plus ecommerce transactions; time-limited free trial; verified November 2026)
- Primary Strength: Crisp standardizes messy retailer and distributor data into consistent product and store hierarchies, with out-of-stock root-cause analysis.
- Biggest Limitation: Crisp publishes no pricing and is not designed for retailers analyzing their own stores.
- One-Line Summary: Crisp is a retail-data platform for CPG brands that unifies sell-through data from retailers such as Target, Amazon and UNFI, but its pricing is quote-only and it does not serve retailers analyzing their own stores.
- Last Verified: November 2026
Overview
Crisp is a retail-data platform that collects and standardizes point-of-sale, inventory and distributor data from retailers such as Target, Amazon, Costco and UNFI. Crisp is built for consumer packaged goods brands that sell through retailers, not for retailers analyzing their own stores.
Crisp states it serves 7,000+ customers, including 90 of the top 100 CPG companies (G2 listing, vendor-stated, November 2026). Crisp is a brand-side data tool, not a store analytics tool for retailers.
Key Features
- Crisp collects retailer and distributor data and standardizes product and store hierarchies across sources.
- Crisp provides store- and SKU-level analytics for sell-through, distribution and inventory.
- Crisp detects out-of-stocks and offers root-cause analysis to help brands recover lost sales.
- Crisp sends standardized data to Snowflake and BI tools through API and OData connections.
- Crisp includes planning workflows and EDI capabilities for brand-retailer operations.
Best For
Crisp is best for CPG brands selling through several large retailers and distributors whose analysts spend significant time reconciling retailer portal data by hand.
Strengths
- Crisp Data Platform holds 4.4/5 from 165 G2 reviews, and reviewers praise its ease of use, accurate visualizations and “top-notch” support (G2, November 2026).
- Crisp reports that ZURU grew distribution 55% and cut markdowns 50%, and that Safe Catch recovered $1M in revenue lost to stockouts (Crisp success stories, vendor-published, accessed November 2026; no measurement methods disclosed).
- Crisp reports that Mars/Nature’s Bakery cut reporting time 75% and that Made By Gather sustained a 95%+ in-stock rate on Amazon (Crisp success stories, vendor-published, accessed November 2026).
- Crisp reports that Coty grew Nail Care sales 20% and that illy grew US retail sales 10% (Crisp success stories, vendor-published, accessed November 2026).
Limitations
Crisp gives up broad applicability for CPG specialization. Retailers that want to analyze their own POS, ecommerce and store performance will get little value from Crisp, because it is built for brands analyzing retailer sell-through.
- Crisp’s data validation and cleansing sub-scores on G2 are comparatively low, at about 7.1–7.4/10 (G2 category data, November 2026).
- Crisp’s connector counts conflict (40+ connectors vs. 200+ retailer and distributor sources), so buyers should request a connector list by retailer (G2, November 2026).
- Crisp data updates are occasionally delayed, and the interface is slow and sometimes crashes, according to G2 reviewers (November 2026).
- Crisp sometimes maps products incorrectly or shows missing data, and reviewers call it expensive for small brands (G2, November 2026).
- Crisp’s standardized data model carries a risk of vendor lock-in, according to a third-party analysis (Airframe, accessed November 2026).
Verdict
Crisp is the most specialized option in PlugRoute’s 2026 evaluation for CPG brands that need standardized sell-through data from retailers and distributors, but Crisp is not built for retailers analyzing their own stores.
Crisp ranks #7 (3.05/5) because of quote-only pricing (1/5) and a brand audience rather than a retailer audience, not because of weak capability in its niche. Crisp’s score rose from 2.55 after PlugRoute found its separate G2 listing. Pilot Crisp against your three largest retailers before signing.
What Red Flags Should I Watch For When Evaluating Retail Analytics Software?
The most consequential red flags are demos that use only sample data, POS connectors locked to higher tiers, and pricing that can rise unpredictably at renewal. PlugRoute’s evidence review found six recurring warning signs. Most appear in documented reviewer complaints. The rest reflect common buyer pain points.
Red Flag #1: The Demo Uses Only Sample Data A demo built on sample data shows what an interface can do, not whether the tool handles your messy POS and product data. Ask for a demo or trial on your own data before committing to an annual contract. Integration and product-matching problems often surface only after signing.
Red Flag #2: POS Connectors Locked to Higher Tiers A low entry price can hide the fact that store data costs extra. In PlugRoute’s November 2026 research, Triple Whale’s POS and retail data appear to be Enterprise-tier, and Glew’s specific Lightspeed and Square connectors could not be confirmed. Get connector coverage for your quoted tier in writing.
Red Flag #3: Refresh or Dataset Caps That Block Intraday Reporting Refresh and dataset limits decide whether you can track sales during the trading day. Microsoft Power BI Pro caps scheduled refreshes at 8 a day and imported datasets at 1 GB (Microsoft, November 2026). Workarounds such as Fabric capacity add cost to an otherwise low-priced license.
Red Flag #4: Unpredictable Pricing at Renewal Quote-only pricing makes multi-year cost hard to forecast, and ownership changes can shift it in the middle of a contract. Inventory Planner by Sage users report that prices tripled after the Sage acquisition (Shopify App Store reviews, user-reported, November 2026). Get renewal caps in writing before signing.
Red Flag #5: Review Ratings You Can’t Tie to the Exact Product Review sites can list products with similar names side by side, so a rating or price may belong to a different product. Crisp Data Platform and the unrelated Crisp Chat both appear in G2 and Capterra results, and Crisp Chat’s $0–$295 prices are often attributed to the wrong product.
Red Flag #6: AI Automation That Overwrites Your Manual Rules AI automation can undo the configuration your reporting depends on. One Triple Whale user reported that “clear prompts, regex, and manual assigning are overwritten” whenever an edit is made (u/Kind_Problem1454, r/triplewhale, 2025). Test override and lock controls during any trial.
Takeaway: Treat AI automation as a feature to verify during the trial, not one to assume works.
What Questions Should I Ask Before Choosing Retail Analytics Software?
Before choosing retail analytics software, ask whether the vendor can run a demo on your own data, which connectors your quoted plan includes, and what you will pay at renewal. The seven questions below help separate a polished demo from a tool that fits. A vague answer to any of them is a reason to look more closely.
Question #1: Can you demo margin by store and stockout risk using our own data? Ask every vendor to demo margin by store and stockout risk using a sample of your own POS and inventory data. A vendor that can load your data shows the tool fits your workflows. A vendor that insists on sample data may be hiding integration or product-matching problems you’ll discover only after signing.
Question #2: Which connectors for our POS, ecommerce, ERP, inventory, loyalty and ad platforms are included on the plan we’re quoting? Ask for a written list of connectors by system, tied to the specific tier you are being quoted. Connector claims can vary even within one vendor’s listings, as Crisp’s 40+ versus 200+ count shows. A missing POS connector can force you into middleware or a costly upgrade.
Question #3: How often does data refresh, and what are the size limits? Ask how often data refreshes and what size limits apply, because refresh frequency decides whether you can trust intraday sales and stock figures. Also ask what it costs to exceed the defaults. With Microsoft Power BI, for example, going beyond eight daily refreshes means moving from Pro to Fabric capacity.
Question #4: How does the tool handle inconsistent product names across stores? Ask whether the tool standardizes product and store hierarchies automatically or whether your team must clean names by hand. Product names that vary between stores break comparisons. Only some tools, such as Crisp for retailer data, standardize hierarchies as a core feature.
Question #5: Can a nontechnical store manager build a report without help? Ask the vendor to show a nontechnical store manager building a report without help, because self-service decides whether a tool gets used. Reviewers cite steep learning curves for Microsoft Power BI’s DAX and Tableau’s LOD calculations (G2, November 2026). Glew sends daily email snapshots instead.
Question #6: What will we pay at renewal and as our revenue, SKUs or users grow? Ask what you will pay at renewal and as you grow, because the scaling price matters more than the starting price. Triple Whale Foundation rises from $219/month to $2,529/month as revenue grows from under $250K to $15–20M (Kanal pricing breakdown, November 2026). That is more than an elevenfold increase on the same plan.
Question #7: Can we run a paid pilot before an annual commitment? Ask for a short paid pilot before any annual commitment, because a pilot limits contract risk and exposes data problems early. CPG brands evaluating Crisp should pilot against their three largest retailers. Retailers should check pilot figures against their own POS records before signing.
Before signing, test these three things on your own data:
- Last month’s margin by store in the tool matches your POS records.
- A product sold under different names in two stores is reported as one item.
- Data refreshes as often as your team needs it.
Which Other Retail Analytics Tools Did We Consider?
PlugRoute also reviewed 13 retail analytics tools that AI answer engines and buyers commonly mention, but did not rank them. PlugRoute did not research these tools to the same standard of dated evidence. Leaving them unranked keeps PlugRoute’s commitment to give every ranked tool equal depth.
- Oracle Retail Insights is an enterprise retail analytics suite.
- Aptos is an enterprise retail software provider mentioned for planning.
- Looker is a general BI platform, and Glew Plus bundles a Looker license.
- ThoughtSpot is a search-driven BI platform.
- Zoho Analytics is a general BI platform.
- Shopify Analytics is the analytics built into Shopify.
- Square Analytics is the reporting built into Square POS.
- Lightspeed Analytics/Insights is the reporting built into Lightspeed POS.
- Alloy.ai is a CPG retail-data platform.
- Retail Velocity is a CPG retail-data platform.
- RetailNext is an in-store analytics tool.
- Improvado is a marketing data platform.
- Intempt is a marketing and ecommerce analytics tool.
How Did We Rank These Retail Analytics Tools?
PlugRoute scored each tool from 1 to 5 on six weighted criteria using dated, sourced evidence. The overall rank is the weighted total. It reflects the strength of the evidence and each tool’s depth within its job, not universal fit, so a lower-ranked tool can still be the right choice for a particular buyer.
The six criteria, their weights, and why each matters:
- C1 Documented Retail Outcomes (20%): Named retailers with measured results are the closest thing to proof before you buy.
- C2 Third-Party Review Ratings and Volume (20%): Ratings from many reviewers show how a product performs after purchase.
- C3 Retail-Specific Depth for Its Job (20%): Built-in forecasting, sell-through and allocation separate retail-built tools from generic BI.
- C4 Integration and Data Unification (15%): Connectors decide whether online and in-store data can be compared.
- C5 Pricing Transparency and Cost Predictability (15%): Published, dated prices let buyers rule tools in or out before sales calls.
- C6 Usability and Support Reliability (10%): Slow support or sync failures turn tools into shelfware.
| Rank | Tool | C1 | C2 | C3 | C4 | C5 | C6 | Weighted Total |
|---|---|---|---|---|---|---|---|---|
| 1 | RELEX Solutions | 5 | 3.5 | 5 | 3.5 | 1 | 2.5 | 3.63 |
| 2 | Inventory Planner by Sage | 3.5 | 3.5 | 4.5 | 4 | 2 | 3 | 3.50 |
| 3 | Microsoft Power BI | 2 | 5 | 2 | 4 | 5 | 3 | 3.45 |
| 4 | Tableau | 2.5 | 5 | 2 | 4 | 4 | 3 | 3.40 |
| 5 | Triple Whale | 3 | 4 | 2.5 | 3 | 4 | 2 | 3.15 |
| 6 | Glew | 2.5 | 3 | 3.5 | 4 | 3.5 | 2 | 3.13 |
| 7 | Crisp | 3.5 | 3.5 | 3 | 4 | 1 | 3 | 3.05 |
In PlugRoute’s 2026 evaluation, only 0.10 points separate the #2, #3 and #4 retail analytics tools, so job fit matters more than rank order. Ranks 5–7 also sit within 0.10 points. Criteria are scored in half-point steps, so a single change can reorder tools within these bands.
Tableau scores 0.5 higher than Microsoft Power BI on C1. Whole Foods documents a defined 460-store operational use of Tableau, while Microsoft’s KMD Brands and Chalhoub stories describe platform migrations without a defined retail use.
PlugRoute updated three scoring inputs after verifying them in November 2026:
- Triple Whale’s G2 rating was confirmed at 4.5/5 from about 482 reviews, which raised its C2 score from 3.5 to 4 and moved Triple Whale from #6 to #5.
- Crisp’s separate G2 listing showed 4.4/5 from 165 reviews, which raised its C2 score from 1 to 3.5 and its total from 2.55 to 3.05.
- Inventory Planner by Sage’s earlier AYBL figures (40%/25%) could not be found in the current case study and were replaced. Its C1 score stays at 3.5 because three named outcomes remain.
Case-study figures, vendor assertions and user reports carry one of three labels in the text: vendor-published, vendor-stated or user-reported. Review-site ratings are cited by site and date, and PlugRoute’s own cost comparisons are labeled as PlugRoute calculations.
Known evidence gaps:
- RELEX Solutions, Inventory Planner by Sage, Glew and Crisp have no Reddit discussion.
- The Reddit quotes for Microsoft Power BI and Tableau come mostly from a 2018 thread.
- RELEX Solutions’ Gartner rating comes from a different Gartner market than the BI tools’ ratings and shows no review count.
PlugRoute has no affiliate relationships with any company listed, and rankings are determined entirely by research data and objective evaluation criteria. Research was conducted on November 7, 2026. To match tools to your situation, use the table in “Which Retail Analytics Tool Should I Choose for My Use Case?”
What Do Buyers Commonly Ask About Retail Analytics Software?
Buyers most often ask which tool fits a small business, which tool handles inventory forecasting, and how PlugRoute decides its rankings. The answers below give direct, dated facts from PlugRoute’s November 2026 research. Each answer stands on its own for readers who arrive from a single search query.
What’s the best retail analytics software for a small business?
For most single-store businesses, built-in Shopify, Square or Lightspeed reports are the best starting point, because they already cover sales history at no extra cost. Add Glew Pro ($250 per month) for store and inventory reporting, or Triple Whale Foundation (from $219 per month) for ad attribution, only when a specific gap appears. Prices verified November 2026.
What’s the best retail analytics software for inventory forecasting?
Inventory Planner by Sage is the highest-scoring mid-market forecasting tool in PlugRoute’s November 2026 evaluation, recommending reorder quantities from seasonality, lead times and stockout history. RELEX Solutions is the enterprise option, with vendor-published stockout reductions of 17% to 67% at Rossmann and Franprix. BI tools such as Microsoft Power BI and Tableau do not forecast replenishment natively.
How does PlugRoute determine rankings?
PlugRoute ranks tools by a weighted score across six criteria: documented outcomes, review ratings, retail depth, integration, pricing transparency, and usability and support. Each criterion is scored from 1 to 5 using dated, sourced evidence. Case-study figures, vendor assertions and user reports are labeled in the text, and evidence gaps and score changes are disclosed openly.
What Do Key Retail Analytics Software Terms Mean?
BI Platform: General-purpose business intelligence software that pulls data from many systems (POS, ecommerce, ERP, inventory) into custom dashboards. It has no retail data model or forecasting built in, so a buyer needs someone to build and maintain the reports.
Commerce Analytics Suite: Software that gives you ready-made reports on ecommerce, store and marketing data, so you don’t need a custom BI build. It suits teams with no in-house analyst, but it does not forecast demand or handle replenishment.
Forecasting and Replenishment: Predicting demand and automatically recommending what to reorder, how much and where, using sales history, seasonality, promotions and lead times. This is how a tool helps you prevent stockouts instead of only reporting them after they happen.
Sell-Through: How much of the stock you received has actually sold, often tracked by store and SKU. It shows which products and locations are moving, and it is central to markdown and reorder decisions for both retailers and CPG brands.
Points of Distribution (PODs): A pricing unit used by CPG retail-data platforms that counts each product carried at each retail location. Monthly POD volume can set your price, so estimate your count before asking for a quote.
Fabric Capacity: A Microsoft Power BI licensing option where you pay for a block of computing capacity instead of paying per user. Above certain viewer counts it can cost less than per-user licenses, and at the F64 level or higher, people can view reports without paid licenses.
Revenue-Band Pricing: A pricing model where the monthly fee depends on your company’s annual revenue, not on how many users you have. Costs can climb steeply as you grow, so check the price at your future revenue as well as your current one.
Refresh Limit: A cap on how often a tool’s data updates, such as Power BI Pro’s limit of 8 scheduled refreshes a day. Low limits make it hard to track sales during the trading day, and getting around them usually costs more.
Product and Store Hierarchy Standardization: Bringing product names and store structures that differ between sources into one consistent format. Without it, an item sold under different names in two stores won’t count as one product, and your comparisons break.
Attribution: Working out which marketing channels and ad spend led to each sale, often using first-party pixel tracking. It matters most to DTC brands focused on ad spend, and it tells you little about how stores or inventory are performing.
Open-to-Buy: A budgeting method that sets how much new inventory a retailer can buy in a period. Planning tools that include it link purchasing to sales forecasts, which helps prevent overstock.
Quote-Only Pricing: Pricing that the vendor doesn’t publish and only gives out through a sales process. It makes multi-year costs hard to predict, so ask for renewal caps in writing before you sign.
Which Retail Analytics Tool Is Right for You?
Key Insights
The right retail analytics tool depends on the job you need done, how many stores and channels you run, and who will maintain the tool. PlugRoute’s November 2026 evaluation points to five takeaways that hold across business sizes, from single stores to enterprise chains and CPG brands.
- Retail analytics buyers should choose the job (reporting, BI, planning or CPG retailer data) before choosing the tool, because tools from different categories overlap only partly.
- Single-store retailers should get the most out of built-in Shopify, Square or Lightspeed reports before paying for a separate analytics platform.
- The seven ranked tools divide by job:
- Forecasting: RELEX Solutions (enterprise) and Inventory Planner by Sage (mid-market).
- BI: Microsoft Power BI and Tableau.
- Commerce analytics: Triple Whale (attribution) and Glew (operations).
- CPG brands: Crisp.
- Ranks 2–4 and ranks 5–7 in PlugRoute’s evaluation each sit within 0.10 points, so job fit should outweigh rank order.
- Every retail analytics tool should be tested on your own POS, ecommerce and inventory data before you sign an annual contract.
Where to start depends on your situation:
- If you run 3–30 stores with recurring stockouts, start with Inventory Planner by Sage and get renewal pricing in writing.
- If you run an enterprise chain with fresh, promotion or replenishment complexity, start with RELEX Solutions.
- If you need store and online reporting in one place without a BI team, trial Glew and check its numbers against your POS.
- If you run a Shopify DTC brand focused on ad spend, trial Triple Whale and validate its attribution on your own store setup.
- If you have an analyst and Microsoft licensing, Microsoft Power BI is the lower-cost reporting layer.
- If your analysts prioritize visual exploration and mapping, evaluate Tableau and price it at your real viewer count.
- If you are a CPG brand selling through retailers, pilot Crisp against your three largest retailers.
Analytics is shifting from dashboards toward AI agents that act on the data, so expect more automation and a greater need to check that it behaves correctly. For deeper comparisons, browse PlugRoute’s other independent retail software reviews and read our full scoring methodology.
We update this guide quarterly. Last updated: November 7, 2026.