The best e-commerce analytics software in 2026 depends on which gap you need to fill. Polar Analytics scored highest for unified BI with data ownership, Lifetimely by AMP is the lowest-cost route to Shopify profit and LTV, and Triple Whale covers the most jobs for ad-heavy Shopify brands. Check your free tracking first.
No single tool covers every analytics job, so choose your category before you choose a vendor. Most growing brands start looking because Meta, Google and Shopify report different numbers for the same sales, and their dashboards show revenue but not profit or lifetime value.
PlugRoute has no affiliate relationships with any company listed, and rankings are determined entirely by research data and objective evaluation criteria.
“When I typed ‘analytics’ in the Shopify App Store there were over 900 hits… analytics tools are either not good enough or very expensive.” (u/juulvdbm, r/ShopifyeCommerce (2025))
Takeaway: With hundreds of overlapping analytics apps on Shopify, choosing the right category matters more than finding the most popular tool.
What Are the 4 Categories of E-Commerce Analytics Tools?
E-commerce analytics tools fall into four categories: Profit & LTV Analytics, Ad Attribution, Behavior Analytics, and Cross-Channel BI & Data Layer. Each category answers a different business question. Most mature brands combine two or three tools, because no single product answers every question equally well.
- Profit & LTV Analytics: Lifetimely by AMP turns store revenue into daily profit, customer lifetime value and cohort retention reports. Lifetimely by AMP does not offer multi-touch attribution across ad channels.
- Ad Attribution: Triple Whale and Northbeam estimate channel ROAS through multi-touch attribution, marketing mix modeling (MMM) or incrementality tests, which helps reconcile blended ROAS and MER (marketing efficiency ratio) with platform numbers. Neither attribution tool shows why shoppers abandon a checkout.
- Behavior Analytics: Hotjar by Contentsquare shows how shoppers move through pages and where they hit friction. Hotjar by Contentsquare does not connect that behavior to revenue or ad ROI.
- Cross-Channel BI & Data Layer: Polar Analytics, Daasity and Glew.io combine store, ad, marketplace and offline data into one reporting layer, including contribution margin views. These BI platforms differ widely in attribution depth and setup effort.
Where the categories overlap:
- Triple Whale adds profit and cohort reporting to its attribution product.
- Polar Analytics adds a server-side pixel and multi-touch attribution to its BI platform.
- One Shopify merchant cancelled Lifetimely by AMP because its features overlapped with Triple Whale (AppStoreResearch, 2026).
Here is how the categories differ in practice. Hotjar by Contentsquare can show that shoppers stall at the shipping-cost step. Triple Whale or Polar Analytics can show which ad sent those shoppers there. Neither tool shows both.
Every e-commerce analytics tool answers one of four questions: what did I earn, which channel earned it, why did shoppers leave, and where is all my data? No tool in this ranking answers all four equally well.
Is Your Free Analytics Setup Already Enough?
Shopify’s built-in reports, Google Analytics 4 (GA4) and Microsoft Clarity are often enough for stores that haven’t found an analytics gap. GA4 is reliable only when its purchase events are configured correctly. Before you pay for any tool, compare one day of Shopify orders with GA4 and Meta purchases. That tells you whether your problem is tracking or a missing tool.
- Shopify Analytics is available on every Shopify plan and gives you the store’s own order count, which is the reference figure for any tracking check.
- GA4 reports ecommerce data accurately only when purchase and funnel events are configured correctly.
- Microsoft Clarity provides free heatmaps and session recordings. It keeps standard recordings for 30 days and favorited recordings for up to nine months (Microsoft Learn, 2026).
How Do I Check Whether My Tracking Is Missing Orders?
A one-day comparison of order counts shows whether your tracking is missing orders.
- Take yesterday’s total order count from Shopify Analytics.
- Take GA4’s purchase event count for the same day.
- Take Meta Events Manager’s purchase count for the same day.
- If GA4 or Meta shows far fewer purchases than Shopify, fix tracking before you buy a dashboard.
GA4 most often undercounts Shopify orders for these reasons:
- Duplicate purchase events can make GA4 count some orders twice while other orders go missing.
- Missing transaction IDs stop GA4 from removing duplicate orders.
- Refunds that aren’t passed to GA4 leave GA4 revenue overstated.
- Checkout redirects can break the GA4 session before the purchase event fires.
- Apple’s iOS 14.5 App Tracking Transparency changes and cookie restrictions block some browser-side purchase signals. Many brands add server-side tracking or a Conversions API (CAPI) to recover them.
Tracking vendors estimate that client-side GA4 misses 15–30% of Shopify orders without extra setup (Analytics Agent and Heatmap.com, vendor-reported, 2026). Treat this range as directional, not definitive.
“On most Shopify stores I look at, somewhere between 10 and 30 percent of purchases never reach GA4 or Meta at all… people buy a prettier dashboard to read data that’s missing a fifth of the orders.” (u/ksz2018, r/ShopifyeCommerce (2025), who discloses building a conversion-tracking app)
Takeaway: A dashboard cannot fix missing purchase events, so verify your order counts before paying for analytics software.
Two rules follow from the order-count check:
- Adding up platform-reported revenue almost always overstates real sales, because Meta, Google and email can each claim the same Shopify order (Tribe Studio, 2026).
- If your Shopify order count and GA4 purchase count disagree, a new dashboard will only display the missing data more attractively. Fix the tracking first.
How Do the Top E-Commerce Analytics Tools Compare at a Glance?
Polar Analytics scored highest in PlugRoute’s 2026 evaluation, with 29.75 of 37.5 points. Triple Whale (27.25), Lifetimely by AMP (27.0) and Daasity (26.0) followed. Ranks two through four sit within 1.25 points of each other. When you choose, the Category and Best For columns matter more than rank position.
| Rank | Company | Category | Best For | One-Line Summary | Key Capabilities | Primary Strength | Key Limitation |
|---|---|---|---|---|---|---|---|
| 1 | Polar Analytics | Cross-Channel BI & Data Layer | Multi-store Shopify and DTC brands, roughly $1–10M+ GMV | Polar Analytics is an ecommerce BI platform that combines a dedicated Snowflake warehouse, 45+ connectors and multi-touch attribution for brands that want unified, owned data. | Snowflake database, 400+ metric semantic layer, server-side pixel, incrementality | Data ownership with SQL access | From $750/month; ~2-week pixel ramp and reported sync lag |
| 2 | Triple Whale | Ad Attribution (All-in-One) | Shopify brands with heavy paid ad spend | Triple Whale is an all-in-one Shopify analytics and attribution platform that pairs a first-party pixel and seven attribution models with profit dashboards and AI agents. | Triple Pixel, 7 attribution models, MMM, Moby AI | Covers the most analytics jobs | GMV-based pricing; recurring support complaints |
| 3 | Lifetimely by AMP | Profit & LTV Analytics | Small and growing Shopify stores | Lifetimely by AMP is a Shopify profit and LTV app that shows daily profit and cohort lifetime value, with a free plan and paid tiers from $79 per month. | Daily P&L, cohort LTV, predictive LTV, CAC payback | Fully published order-based pricing | Shopify-only; first- and last-touch attribution only |
| 4 | Daasity | Cross-Channel BI & Data Layer | Omnichannel brands with analyst capacity | Daasity is an omnichannel e-commerce data platform that unifies DTC, Amazon, wholesale and retail data in a managed warehouse with pre-built analytics models. | ELT, managed warehouse, LTV/RFM/margin models | Widest channel coverage | From $1,499/month; analyst-dependent setup |
| 5 | Northbeam | Ad Attribution | Brands spending about $30–50K+/month on ads | Northbeam is a machine-learning multi-touch attribution platform with modeled views, MMM+ and incrementality, built for brands with high multi-channel ad spend. | ML attribution, modeled views, identity graph, MMM+ | Most extensively documented attribution method | Steep learning curve; 2–4 week calibration |
| 6 | Hotjar by Contentsquare | Behavior Analytics | Teams diagnosing checkout friction | Hotjar by Contentsquare is a behavior analytics tool that uses heatmaps, recordings and surveys to reveal why shoppers drop off, with a free plan. | Heatmaps, recordings, funnels, surveys | Explains why shoppers drop off | No link to revenue; Pro and Enterprise quote-only |
| 7 | Glew.io | Cross-Channel BI & Data Layer | Retailers with online and physical stores | Glew.io is a multichannel ecommerce BI platform that combines online and in-store data into customer, product, inventory and channel profit reporting. | Managed ETL, segmentation, inventory analytics | Brings online and in-store data together | First-order and last-click attribution only; annual prepay on Pro |
Which E-Commerce Analytics Tool Should I Choose for My Use Case?
The right e-commerce analytics tool depends on your biggest gap and your stage. Small Shopify stores should start with free tools plus Lifetimely by AMP. Ad-heavy brands at $1–10M GMV should compare Triple Whale and Polar Analytics. Brands selling on Amazon, through wholesale or in physical stores should look at Daasity or Glew.io.
| Your #1 Priority | Recommended Tool | Why | Acceptable Alternative |
|---|---|---|---|
| See profit and LTV in a small Shopify store (under ~$1M GMV) | Lifetimely by AMP (Free or S tier) | Free plan up to 50 orders; published tiers from $79/month | Shopify reports plus a correctly configured GA4 |
| Find checkout and page friction | Hotjar by Contentsquare | Recordings, heatmaps and on-site surveys; free plan, Growth from €39/month | Microsoft Clarity (free) |
| Attribution and profit in one dashboard ($1–10M GMV, heavy paid ads) | Triple Whale | Covers the most analytics jobs; Foundation from $219/month | Polar Analytics |
| Own your data and report across several stores | Polar Analytics | Dedicated Snowflake database; per-account pricing from $750/month, month-to-month | Daasity |
| Multi-channel attribution at $1.5M+ annual or $30–50K+/month ad spend | Northbeam | Modeled views, MMM+ and incrementality; Starter from $1,500/month | Triple Whale |
| Combine DTC, Amazon, wholesale and retail data (with an analyst) | Daasity | Pre-built omnichannel warehouse models; from $1,499/month | Polar Analytics |
| Combine online and physical-store data with lighter setup | Glew.io | Documented in-store and online consolidation; Pro $250/month, annual prepay | Daasity |
The GMV and ad-spend thresholds in this decision table (under $1M GMV; $1–10M GMV; $1.5M+ annual ad spend) come from practitioners and third parties (2026). They are guidance, not fixed rules.
Users on r/shopify shared their experience:
“Google Analytics 4 and Microsoft Clarity. Unless you are doing a few million per year in revenue… you don’t need Triple Whale or similar tools.” Posted by u/fathom53
Takeaway: Practitioners treat paid e-commerce analytics platforms as a scale purchase, so stores below a few million in annual revenue are usually well served by GA4 and Microsoft Clarity.
How Do Pricing, Contracts and Data Access Compare?
Lifetimely by AMP, Northbeam and Glew.io publish clear entry prices, and Triple Whale and Hotjar by Contentsquare list entry plans. Polar Analytics, Triple Whale and Daasity raise their prices as your GMV or revenue grows. Polar Analytics and Daasity are the only tools here that include warehouse-level data access on every plan (November 2026).
| Tool | Pricing Basis | Entry Price (Nov 2026) | Contract | Attribution Method | Warehouse/SQL Access | Rating (Review Count) |
|---|---|---|---|---|---|---|
| Polar Analytics | Annual GMV | $750/month (Core, under $5M GMV) | Month-to-month default; annual optional | Pixel, multi-touch, incrementality | Yes (Snowflake) | G2 4.7 (23); Shopify 4.9 (116) |
| Triple Whale | Annual GMV | Free; Foundation $219/month ($2,190/year) | 12 months on Enterprise | Pixel, 7 models, MMM | Not verified | G2 4.5 (482) |
| Lifetimely by AMP | Monthly orders | Free; $79/month (S tier) | No annual contract found | First- and last-touch | No | Shopify 4.9 (599) |
| Daasity | Rolling revenue | $1,499/month ($1,899 on Shopify listing) | Annual (reported) | No native pixel listed | Yes | G2 4.7 (17); Shopify 4.6 (52) |
| Northbeam | Pageviews | $1,500/month (Starter) | Starter month-to-month; others annual | ML multi-touch, modeled views, MMM+ | Not verified | G2 4.5 (16) |
| Hotjar by Contentsquare | Plan tier | Free; Growth from €39/month (billed annually) | Pro and Enterprise quote-only | None (behavior only) | No | G2 4.3 (345) |
| Glew.io | Plan tier | Pro $250/month | Annual prepayment | First-order, last-click | Plus plan only | G2 4.0 (57) |
Typical monthly cost by stage (vendor pricing pages, November 2026):
- A small Shopify store can cover profit and behavior analytics for $0–$79/month with the free stack plus Lifetimely by AMP’s S tier.
- A $1–10M GMV brand should budget roughly $219–$750+/month for Triple Whale or Polar Analytics.
- Enterprise attribution and omnichannel platforms such as Northbeam and Daasity start around $1,500/month.
What Are the Best E-Commerce Analytics Software Tools in 2026?
PlugRoute ranked seven e-commerce analytics tools for 2026, in this order: Polar Analytics, Triple Whale, Lifetimely by AMP, Daasity, Northbeam, Hotjar by Contentsquare and Glew.io. Each tool was scored against six weighted criteria. Every entry follows the same structure, and every figure carries a date and a credibility label.
1. Polar Analytics: Best Overall for Unified BI with Data Ownership
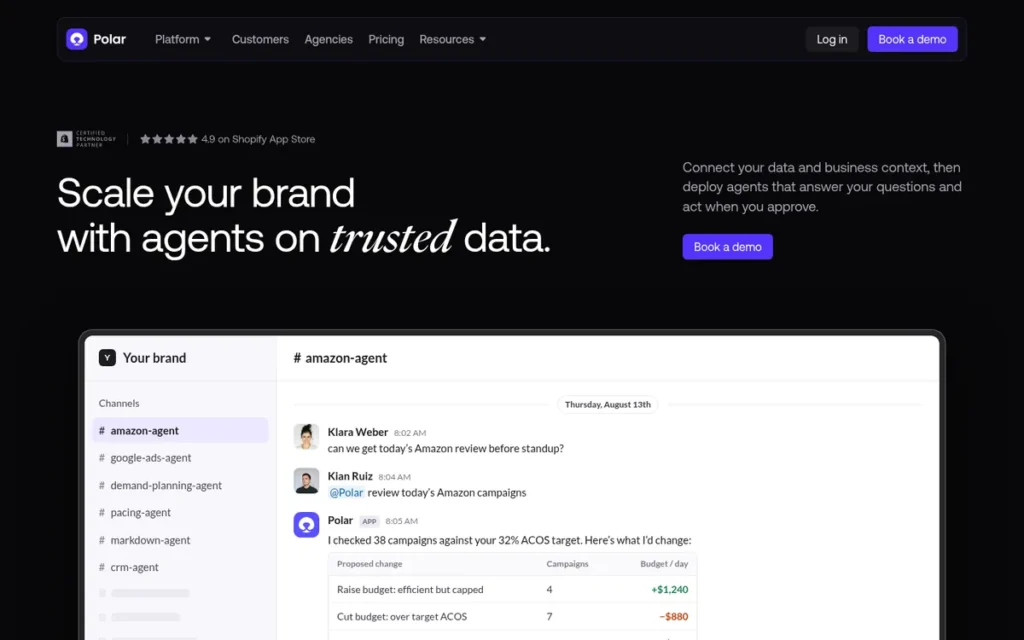
Category: Cross-Channel BI & Data Layer, combines store, ad, email and marketplace data into one governed reporting layer.
At a Glance
- Category: Cross-Channel BI & Data Layer (with built-in attribution)
- Best For: Growing Shopify and multi-store DTC brands (roughly $1–10M+ GMV) that want unified reporting, attribution and ownership of their raw data
- Price Range: From $750/month (Core, under $5M GMV, month-to-month by default); Pro and Custom are quote-only
- Primary Strength: Polar Analytics gives every customer a dedicated Snowflake database with SQL access and a 400+ metric semantic layer, so data stays owned and consistent.
- Biggest Limitation: Polar Analytics starts at $750/month and keeps its upper tiers quote-only, which puts it out of reach for most small stores.
- One-Line Summary: Polar Analytics is an ecommerce BI platform that combines a dedicated Snowflake warehouse, 45+ connectors and multi-touch attribution for brands that want unified, owned data.
- Last Verified: November 2026
Score
- Polar Analytics scored 29.75/37.5 and ranked first on data ownership (C4: 5/5) and job coverage (C6: 4.5/5).
- Polar Analytics’ weakest criteria were pricing transparency (C3: 3.5) and implementation and support burden (C5: 3).
Overview
Polar Analytics is an e-commerce business intelligence platform that gives each Shopify and multi-channel brand its own Snowflake database, a 400+ metric semantic layer, a server-side pixel and multi-touch attribution. Polar Analytics is built for growth and analytics leads who want unified data that they own.
Polar Analytics says more than 4,000 brands and agencies use it (Polar Analytics, company-reported, 2026). Polar Analytics was founded in Paris and raised a $9M Series A led by Point Nine in September 2023 (Polar Analytics, 2023).
Key Features
- Polar Analytics sets up a dedicated Snowflake database for each customer, with SQL and raw-data access.
- Polar Analytics uses a semantic layer of 400+ predefined ecommerce metrics, so every dashboard calculates them the same way.
- Polar Analytics offers 45+ native connectors, including Shopify, Meta, Google, TikTok, Klaviyo, Amazon and Recharge.
- Polar Analytics includes the Polar Pixel for server-side tracking and conversion APIs, plus multi-touch attribution and incrementality testing.
- Polar Analytics supports multiple brands and stores in one account and includes an AI assistant called Ask Polar.
Best For
Polar Analytics is best for growing Shopify and multi-store DTC brands that want one governed reporting layer plus warehouse access. Polar Analytics is not a good fit for stores under about $1M GMV that only need profit tracking.
Pricing
- Polar Analytics prices by annual GMV, and its Core plan starts at $750/month for brands under $5M in annual GMV (Polar Analytics pricing page, November 2026).
- Polar Analytics is month-to-month by default, with optional annual or multi-year commitments (Polar Analytics policy page, November 2026).
- Polar Analytics quotes Pro and Custom plans on request and includes unlimited users and data history, with no per-seat or per-connector fees (Polar Analytics, 2026).
- Polar Analytics quoted one third-party reviewer a price that differed from the price shown in the app (PodVector, 2026).
Strengths
- Polar Analytics is rated 4.7/5 on G2 from 23 reviews and 4.9/5 on the Shopify App Store from 116 reviews (G2 and Shopify App Store, November 2026). Reviewers praise its customizable dashboards and centralized data.
- Polar Analytics is one of only two tools in this ranking, along with Daasity, that include warehouse-level access with SQL on every plan (Polar Analytics pricing page, November 2026).
- Polar Analytics prices per account rather than per store. A three-store Shopify owner said it was the only tool they found that did this (u/neilap123, r/Klaviyo, 2024).
- Polar Analytics reports that The Frankie Shop’s share of purchase events received rose from 5.6% to 59.6%. It also reports that Yellow Pop cut cost per purchase by 36% and raised ROAS by 28% (Polar Analytics, vendor-reported, 2026).
Limitations
Polar Analytics trades a low entry price for depth and data ownership. Its $750/month floor and quote-only upper tiers exclude most small stores.
- Polar Analytics’ pixel reportedly needs about two weeks to build an attribution picture and cannot reconstruct past customer journeys (Saras Analytics, competitor-authored, 2026).
- Polar Analytics G2 reviewers report slow integration setup, data-update problems and data that historically refreshed only at end of day. Polar says it is moving to 15-minute refreshes (G2, 2026).
- Polar Analytics was described by one Reddit user as “a bit clunky with ad syncs” (u/lego_hellothere, r/FacebookAds, 2024). Another user said it falls short when deep customization is needed (u/Significant_Mark9030, r/FacebookAds, 2024).
Verdict
Polar Analytics earned the highest weighted score in PlugRoute’s 2026 evaluation (29.75/37.5) for brands that want unified reporting and ownership of their data. Polar Analytics combines a dedicated warehouse, consistent metric definitions and built-in attribution at a published, month-to-month starting price.
Small stores should start with free tools or a profit app before paying for Polar Analytics. Teams whose only priority is attribution modeling should compare Polar Analytics with Northbeam.
2. Triple Whale: Best All-in-One for Shopify Brands with Heavy Paid Ad Spend
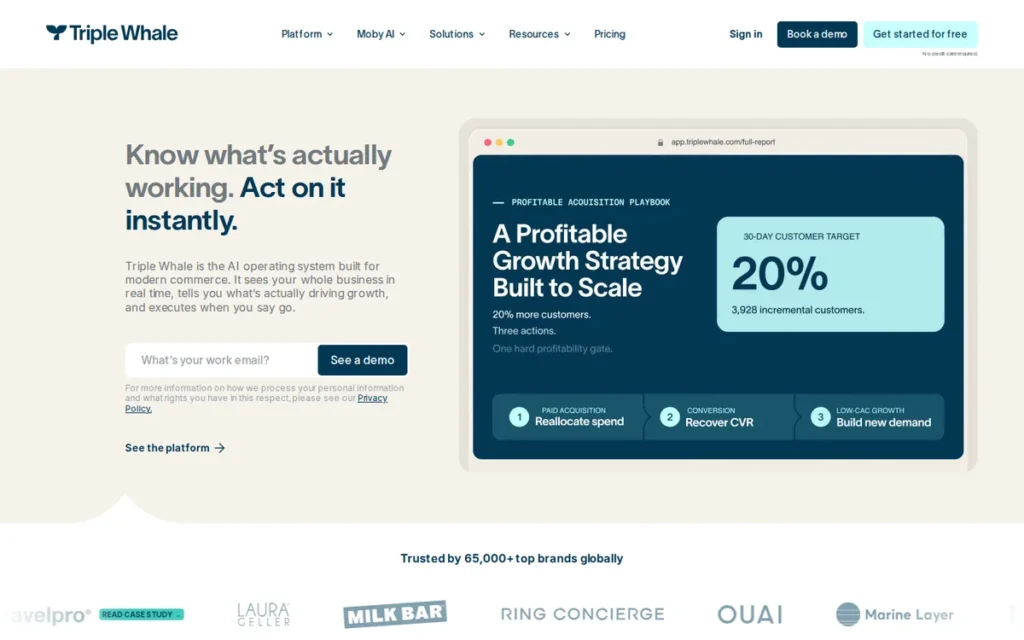
Category: Ad Attribution (All-in-One), assigns credit for sales across ad channels and combines it with store and profit reporting.
At a Glance
- Category: Ad Attribution (All-in-One)
- Best For: Shopify-first DTC brands spending heavily on Meta and Google that want attribution, profit and creative analytics in one dashboard
- Price Range: Free tier; Foundation from $219/month or $2,190/year billed annually (Shopify App Store); higher tiers scale with GMV; Enterprise on a 12-month contract
- Primary Strength: Triple Whale combines a first-party pixel with seven attribution models, profit reporting, cohort LTV and MMM in a single Shopify-native platform.
- Biggest Limitation: Triple Whale prices by GMV, uses a 12-month Enterprise contract, and draws recurring complaints about post-sale support and numbers that don’t match Shopify or ad platforms.
- One-Line Summary: Triple Whale is an all-in-one Shopify analytics and attribution platform that pairs a first-party pixel and seven attribution models with profit dashboards and AI agents.
- Last Verified: November 2026
Score
- Triple Whale scored 27.25/37.5. It ranked highest of all tools on job coverage (C6: 5/5) and tied for highest on rating volume (C2: 4.5).
- Triple Whale’s weakest criterion was implementation and support burden (C5: 2).
- Triple Whale finished 0.25 points ahead of Lifetimely by AMP. Triple Whale scored higher on job coverage, while Lifetimely by AMP scored higher on pricing transparency and support burden.
Overview
Triple Whale is an all-in-one analytics and attribution platform for Shopify-first DTC brands. Triple Whale combines a profit-aware summary dashboard, the first-party Triple Pixel with seven attribution models, cohort LTV, marketing mix modeling and Moby AI agents for teams that spend heavily on paid ads.
Triple Whale was founded in 2021 by ecommerce operators and has raised more than $50M, with Shopify among its investors (Triple Whale, 2026). Triple Whale says more than 50,000 brands use it (Triple Whale, company-reported, 2026).
Key Features
- Triple Whale’s Summary dashboard brings revenue, orders, ad spend, profit and product performance into one view.
- Triple Whale’s Triple Pixel provides first-party tracking with seven attribution models.
- Triple Whale’s Compass module adds marketing mix modeling and incrementality measurement.
- Triple Whale includes cohort and LTV reporting plus creative analytics for ad performance.
- Triple Whale’s Moby AI agents answer data questions. Through Moby Actions, Triple Whale’s agents can also scale or cut Meta and Google campaigns based on rules the user sets.
Best For
Triple Whale is best for Shopify-first brands with significant multi-channel ad spend, roughly $1–10M GMV, that want attribution, profit and creative performance in one dashboard. Triple Whale is a weaker fit for custom or non-Shopify storefronts and for small brands with limited ad spend.
Pricing
- Triple Whale offers a free tier and prices its paid plans by annual GMV and package (Triple Whale pricing page, November 2026).
- Triple Whale’s Foundation plan starts at $219/month, or $2,190/year billed annually, and the final price scales with GMV (Shopify App Store, November 2026).
- Triple Whale Enterprise is sold on a 12-month contract (Stackaible, 2026).
- Triple Whale’s GMV-linked price increases are a commonly named reason brands switch away (Omniconvert, competitor-authored, 2026).
Strengths
- Triple Whale is rated 4.5/5 on G2 from 482 reviews (G2, November 2026), the largest review base in this ranking.
- Triple Whale’s attribution, pixel tracking and ROAS visibility were praised in 9 of 19 reviews in a 2026 review summary (AppStoreResearch, 2026). One operator called Triple Whale “strong on attribution and cohort analysis if you’re heavy on paid ads” (u/luskolunny, r/ShopifyeCommerce, 2025).
- Triple Whale covers more analytics jobs in one product than any other tool evaluated, including profit, attribution, cohorts, creative analytics and MMM (PlugRoute C6 score: 5/5, 2026).
- Triple Whale reports that SFERRA Fine Linens achieved 3x ROAS and more than $300,000 in incremental revenue, and that Gorilla Mind measured a 5.7 incremental ROAS (Triple Whale, vendor-reported, 2026).
- Triple Whale states SOC 2 Type 2 compliance, and its Enterprise tier adds custom security reviews, SSO and audit logs (Triple Whale pricing page, November 2026).
Users on r/FacebookAds noted:
“From what I’ve seen, TripleWhale does a great job breaking down performance at the ad level, but it doesn’t go granular enough to show winning copy combinations within one dynamic ad (like DCTs or Advantage+ setups with multiple copy variations). It won’t tell you which specific hook or line is doing best unless each variation is a separate ad.” Posted by u/Stizzy-Traps
Takeaway: Triple Whale’s creative analytics are strong at the ad level but stop short of copy-variation insight inside dynamic ads, so copy testers still need one variation per ad.
Limitations
Triple Whale trades consistency and support depth for breadth. In a 2026 summary of 19 reviews, users reported numbers that differ from Shopify, Meta and Google, as well as bugs, hard onboarding and weaker support after the sale (AppStoreResearch, 2026).
Triple Whale has the largest review base in this ranking (482 G2 reviews), so its complaints are also the most visible.
- Triple Whale reviewers wrote that “Moby, its AI, needs more work to be accurate” (AppStoreResearch, 2026).
- Triple Whale left nearly half of one brand’s orders with no source assigned. The brand runs a custom, non-Shopify storefront, which is outside Triple Whale’s stated Shopify-first focus, and saw no fix after about three months of support contact (u/Upstairs-Peanut-5756, r/triplewhale, 2025).
- Triple Whale’s AI-based channel grouping overwrote manual rules, according to another user in the same thread (u/Kind_Problem1454, r/triplewhale, 2025).
- Triple Whale “won’t have better tracking then Meta, they just look at attribution differently,” one practitioner argued (u/fathom53, r/PPC, 2024).
Verdict
Triple Whale covers more analytics jobs in one product than any other tool in PlugRoute’s 2026 evaluation (C6: 5/5), combining attribution, profit, cohorts and MMM for Shopify brands with heavy paid ad spend. Triple Whale’s free tier lets buyers test the workflow before committing.
During any trial, check Triple Whale’s numbers against Shopify orders. Get GMV-based pricing and contract terms for Triple Whale confirmed in writing before signing.
3. Lifetimely by AMP: Best for Profit and LTV on a Budget
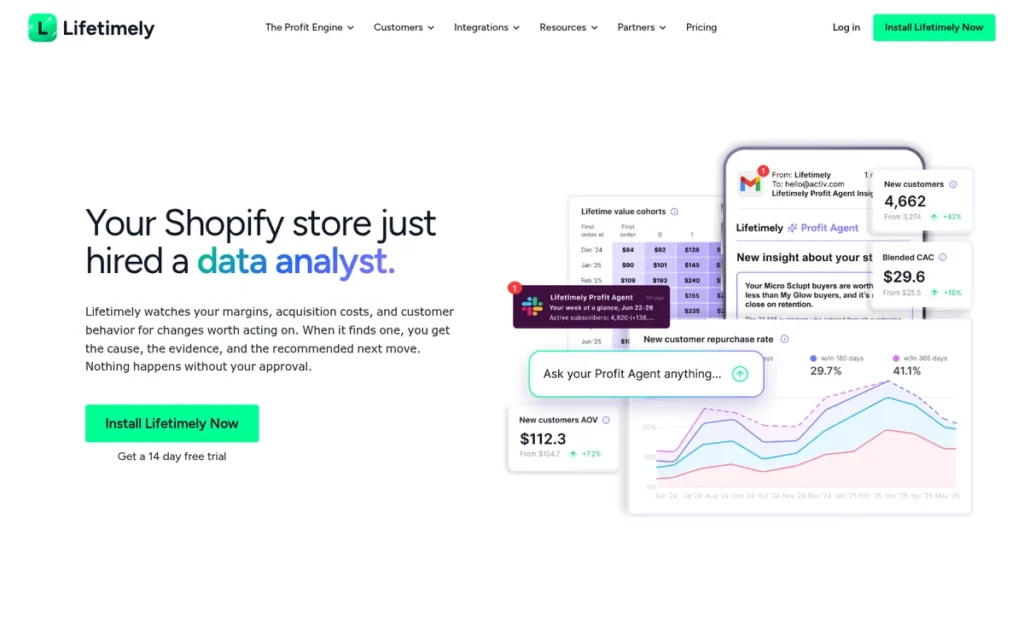
Category: Profit & LTV Analytics, turns store revenue into profit, customer lifetime value and cohort retention reports.
At a Glance
- Category: Profit & LTV Analytics
- Best For: Small and growing Shopify stores that see revenue but not profit, LTV or repeat-purchase patterns
- Price Range: Free up to 50 orders/month; $79–$999/month by order volume; Amazon add-on +$75/month
- Primary Strength: Lifetimely by AMP shows daily profit and cohort-level customer lifetime value, with a free plan and published order-based pricing.
- Biggest Limitation: Lifetimely by AMP works only with Shopify, offers no warehouse or SQL access, and supports only first- and last-touch attribution.
- One-Line Summary: Lifetimely by AMP is a Shopify profit and LTV app that shows daily profit and cohort lifetime value, with a free plan and paid tiers from $79 per month.
- Last Verified: November 2026
Score
- Lifetimely by AMP scored 27.0/37.5. It earned the top pricing-transparency score in this ranking (C3: 4.5) and tied for highest rating volume (C2: 4.5).
- Lifetimely by AMP’s weakest criterion was data ownership and integration breadth (C4: 2).
- Lifetimely by AMP finished 0.25 points behind Triple Whale. Lifetimely by AMP scored higher on pricing transparency and support burden, while Triple Whale scored higher on job coverage.
Overview
Lifetimely by AMP is a Built for Shopify profit and customer lifetime value app. Lifetimely by AMP combines a daily profit-and-loss view, cohort LTV at 3 to 12 months, predictive LTV and CAC payback for small and growing Shopify stores that can see revenue but not profit.
Lifetimely by AMP has been owned by AMP (After Market Pro) since late 2022 (Omniconvert, competitor-authored, 2026). Lifetimely by AMP prices by monthly order volume rather than by GMV, which makes costs easier to forecast.
Key Features
- Lifetimely by AMP calculates customer lifetime value at 3, 6, 9 and 12 months, with cohorts by first product, discount code, country and tag.
- Lifetimely by AMP provides predictive LTV and CAC payback estimates to help plan acquisition spending.
- Lifetimely by AMP produces a daily profit-and-loss view that includes COGS, ad spend, shipping and fees.
- Lifetimely by AMP offers first-touch and last-touch attribution alongside industry benchmarks.
- Lifetimely by AMP includes an AI Profit Agent and an optional Amazon connector for +$75/month.
Best For
Lifetimely by AMP is best for Shopify stores whose main gap is visibility into profit and repeat purchases rather than multi-channel attribution. Lifetimely by AMP is not a fit for non-Shopify stores or teams that need SQL or warehouse access.
Pricing
| Plan | Orders per Month | Price (November 2026) |
|---|---|---|
| Free | Up to 50 | $0 |
| S | 51–500 | $79/month |
| M | 501–3,000 | $149/month |
| L | 3,001–7,000 | $299/month |
| XL | 7,001–15,000 | $499/month |
| XXL | 15,001–25,000 | $749/month |
| Unlimited | 25,000+ | $999/month |
- Lifetimely by AMP publishes these tiers on useamp.com/pricing (November 2026). Some third-party pages still show an older $49 entry price (Saras Analytics, competitor-authored, 2026).
- Lifetimely by AMP charges +$75/month for its optional Amazon connector (useamp.com/pricing, November 2026).
Strengths
- Lifetimely by AMP is rated 4.9/5 from 599 Shopify App Store reviews (Shopify App Store, November 2026), the largest review base among the Shopify-native tools in this ranking.
- Lifetimely by AMP publishes every paid tier, from $79/month (S) to $999/month (Unlimited), alongside a free plan for up to 50 orders (useamp.com/pricing, November 2026).
- Lifetimely by AMP reports that BPN generated $900,000 in incremental revenue by re-engaging churned high-value subscribers (Lifetimely by AMP, vendor-reported, cited by Saras Analytics, 2026).
- Lifetimely by AMP carries Shopify’s Built for Shopify badge (Shopify App Store, November 2026). The badge is a platform quality designation and does not by itself confirm that the analytics are accurate.
Limitations
Lifetimely by AMP trades depth for simplicity. It works only with Shopify, has no warehouse or SQL access, and limits attribution to first- and last-touch models (The Price Geek, 2026).
- Lifetimely by AMP refreshes data every few hours rather than in real time, and its profit reports are “not very useful until COGS had been added” (The Price Geek, 2026).
- Lifetimely by AMP’s jump from the M tier ($149) to the L tier ($299) roughly doubles the monthly cost, so seasonal order spikes can raise bills sharply (useamp.com/pricing, November 2026).
- Lifetimely by AMP reviewers mention dissatisfaction with support and delays syncing Amazon data. One merchant cancelled because the features overlapped with Triple Whale (Shopify App Store and AppStoreResearch, 2026).
Verdict
Lifetimely by AMP is the most cost-transparent way for a Shopify store to move from revenue reporting to profit and customer lifetime value in 2026. Lifetimely by AMP’s free plan lets stores test it before committing.
Lifetimely by AMP’s order-based tiers are easy to forecast. Brands that need multi-touch attribution or warehouse access will outgrow Lifetimely by AMP and should look at Triple Whale or Polar Analytics.
4. Daasity: Best for Omnichannel Brands Selling via DTC, Amazon, Wholesale and Retail
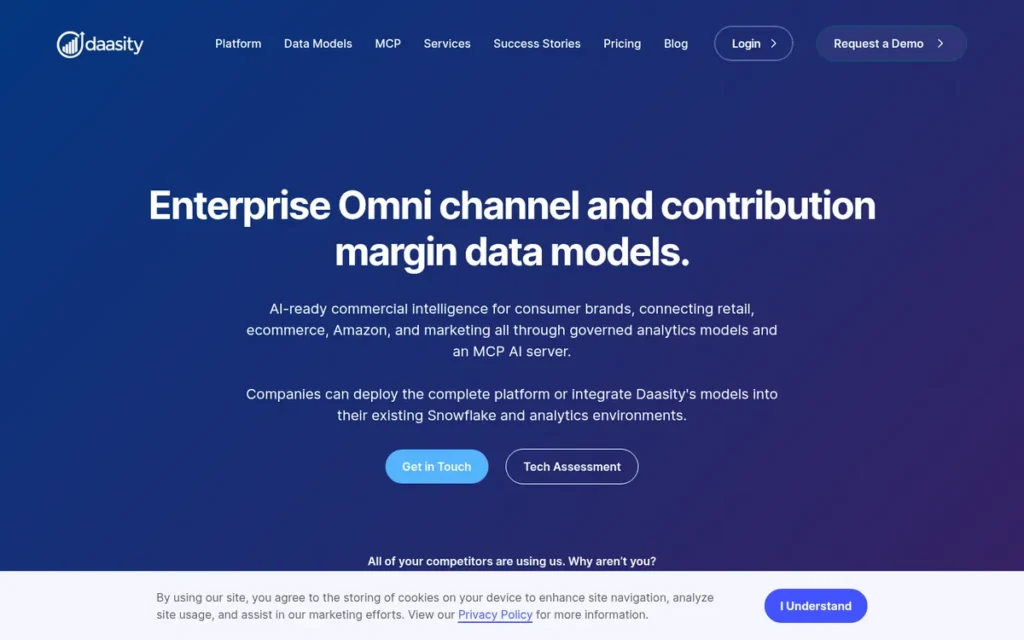
Category: Cross-Channel BI & Data Layer.
At a Glance
- Category: Cross-Channel BI & Data Layer (Omnichannel)
- Best For: Consumer brands selling across DTC, Amazon, wholesale and retail that have in-house analyst capacity
- Price Range: $1,499–$1,999/month published (the Shopify listing shows $1,899/month); Enterprise custom; annual contracts reported
- Primary Strength: Daasity combines DTC, Amazon, wholesale and retail data in a managed warehouse with pre-built LTV, retention and contribution margin models.
- Biggest Limitation: Daasity starts near $1,500/month, reportedly needs analyst support, and draws reviewer complaints about onboarding fees, delays and implementation effort.
- One-Line Summary: Daasity is an omnichannel e-commerce data platform that unifies DTC, Amazon, wholesale and retail data in a managed warehouse with pre-built analytics models.
- Last Verified: November 2026
Score
- Daasity scored 26.0/37.5 and tied for the top score on data ownership (C4: 5/5).
- Daasity was held back by implementation burden (C5: 2) and small review samples (C2: 3.5).
Overview
Daasity is an omnichannel e-commerce data platform that pulls data from 380+ sources into a managed warehouse with pre-built models for LTV, retention, RFM and contribution margin. Daasity is built for consumer brands that sell across DTC, Amazon, wholesale and retail and have analyst capacity.
Daasity has reportedly raised $20.7M in total funding (Saras Analytics, competitor-authored, 2026). Daasity does not list a native tracking pixel among its features (Daasity product pages, November 2026).
Key Features
- Daasity runs ELT pipelines that pull data from 380+ sources into a managed data warehouse (G2, 2026).
- Daasity ships pre-built data models for LTV, cohorts, retention, RFM segmentation, subscriptions and contribution margin.
- Daasity covers DTC, Amazon, wholesale and physical retail channels in one data foundation.
- Daasity supports audience segmentation for marketing activation.
- Daasity offers optional Nielsen and SPINS retail data, reportedly as a $499/month add-on (unverified).
Best For
Daasity is best for omnichannel consumer brands with meaningful Amazon, wholesale or retail revenue and an analyst who can work with warehouse data models. Daasity is not a fit for single-channel Shopify stores without analyst support or for brands that mainly need ad attribution.
Pricing
- Daasity lists Starter Essentials at $1,499/month, Essentials at $1,999/month and Enterprise at custom pricing (Daasity pricing page, November 2026).
- Daasity’s Shopify App Store listing shows $1,899/month, with usage based on an annualized rolling three-month average of revenue (Shopify App Store, 2026).
- Daasity deployments are estimated by a third party at $1,500–5,000/month on annual contracts (Saras Analytics, competitor-authored, 2026).
- Daasity reviewers mention onboarding and setup fees (Shopify App Store, 2026).
Strengths
- Daasity is rated 4.7/5 on G2 from 17 reviews and 4.6/5 on the Shopify App Store from 52 reviews (G2 and Shopify App Store, 2026). One G2 reviewer valued “the flexibility in the questions it lets me answer.”
- Daasity is one of only two tools in this ranking, along with Polar Analytics, that include warehouse-level access on every plan (Daasity pricing page, November 2026).
- Daasity’s G2 reviewers describe combining Shopify, NetSuite, Amazon and Northbeam data into one source of truth and cutting manual reconciliation work (G2, 2026).
- Daasity is the only tool in this ranking that documents wholesale coverage alongside DTC, Amazon and retail channels (Daasity product pages, November 2026).
This aligns with community sentiment on r/dataanalysis:
“If < $10MM GMV you should look at peel, polar, triple whale. If over $10MM look at tydo, daasity, source-medium. These will be cheaper than DIY and let you focus on analysis not pipelines.” Posted by u/BigData-dan
Takeaway: Practitioners place Daasity in the over-$10M GMV tier and see packaged platforms like Daasity and Polar Analytics as cheaper than building an in-house data pipeline.
Limitations
Daasity trades ease of use for flexibility and data ownership. Daasity costs roughly $1,500/month or more and works best with an analyst on staff.
- Daasity’s G2 reviewers cite high cost for small teams and implementation effort (G2, 2026).
- Daasity’s Shopify App Store reviewers mention setup fees, delays and features that weren’t working during onboarding (Shopify App Store, 2026).
- Daasity does not list a native pixel or multi-touch attribution, so brands that need ad attribution must pair Daasity with a separate tool (Daasity product pages, November 2026).
- Daasity had no named, quantified case studies in this research, and its review samples are small.
Verdict
Daasity offers the broadest documented channel coverage in PlugRoute’s 2026 evaluation for brands selling across DTC, Amazon, wholesale and retail that want to own their data models. Daasity’s pre-built warehouse models can save teams with analyst capacity substantial data engineering work.
Single-channel Shopify stores and teams without an analyst are likely to pay for Daasity capability they can’t use.
5. Northbeam: Best for Multi-Channel Attribution at High Ad Spend
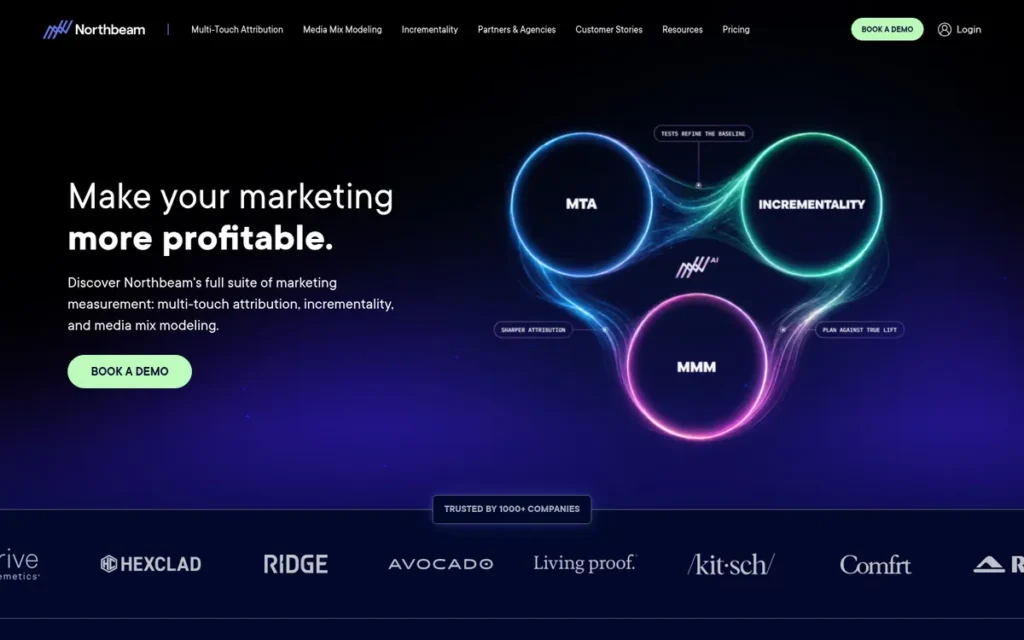
Category: Ad Attribution, assigns credit for sales across ad channels to estimate true return on ad spend.
At a Glance
- Category: Ad Attribution
- Best For: DTC brands spending roughly $30,000–$50,000+ per month across several ad platforms
- Price Range: Starter from $1,500/month (month-to-month); Professional from $3,500/month (annual); Enterprise custom (annual); based on pageviews
- Primary Strength: Northbeam offers the most extensively documented attribution toolkit in this ranking, combining multi-touch attribution, modeled views, MMM+ and incrementality.
- Biggest Limitation: Northbeam has a steep learning curve, needs 2–4 weeks of calibration, and costs $1,500–$3,500+ per month, mostly on annual contracts.
- One-Line Summary: Northbeam is a machine-learning multi-touch attribution platform with modeled views, MMM+ and incrementality, built for brands with high multi-channel ad spend.
- Last Verified: November 2026
Score
- Northbeam scored 25.5/37.5 and earned the only 5/5 for measurement rigor (C1) in this ranking.
- Northbeam ranked fifth because it covers mainly one analytics job (C6: 3) and has a 16-review G2 base (C2: 3).
Overview
Northbeam is a machine-learning multi-touch attribution platform that models the impact of both clicks and ad views across paid channels, with optional marketing mix modeling and incrementality on Enterprise. Northbeam is built for DTC brands spending roughly $30,000 to $50,000 or more per month across several ad platforms.
Northbeam was founded in 2019 and has reportedly raised about $15M, including a Series A in August 2022 (StartupHub, secondary source, 2026). Northbeam says it tracks more than $130B in ad-attributed revenue (Northbeam, company-reported, 2026).
Key Features
- Northbeam provides machine-learning multi-touch attribution with “Clicks + Modeled Views” and “Clicks + Deterministic Views” models.
- Northbeam uses an identity and device graph to connect a customer’s touchpoints across devices.
- Northbeam reports creative analytics and product-level CAC and ROAS.
- Northbeam offers MMM+ and incrementality testing as optional Enterprise add-ons.
- Northbeam sends conversion data back to ad platforms to improve their optimization.
Best For
Northbeam is best for brands with large, multi-channel paid media budgets where attribution is the main reason for buying. Northbeam is not a fit for small brands with modest ad spend or teams that need results within days of setup.
Pricing
- Northbeam Starter costs from $1,500/month on a month-to-month basis and is aimed at Shopify brands spending under $1.5M a year on ads (Northbeam pricing page, November 2026).
- Northbeam Professional costs from $3,500/month on an annual contract, billed annually or semi-annually, and covers up to $500K/month in ad spend (Northbeam pricing page, November 2026).
- Northbeam Enterprise is custom-priced on an annual contract and adds a media-strategy team and up to $200K in ad credits (Northbeam, 2026).
- Northbeam charges onboarding fees, according to a third party (Trivas, competitor-authored, 2026).
Strengths
- Northbeam has the most extensively documented attribution method in this ranking, including modeled views, an identity graph, MMM+ and incrementality (Northbeam docs, 2026).
- Northbeam reports that its Enterprise customers saw ROAS rise 37% and CAC fall 20% over one year, and that Dr. Squatch increased ROAS by 24% (Northbeam, vendor-reported, 2026).
- Northbeam is rated 4.5/5 on G2 from 16 reviews (G2, 2026), and reviewers consistently name multi-touch attribution as its strongest feature.
- Northbeam publishes dollar prices for Starter and Professional, and Northbeam Starter is month-to-month (Northbeam pricing page, November 2026).
Limitations
Northbeam trades accessibility for attribution depth. G2 reviewers describe a steep learning curve, and one reported “going back and forth for 29 days” during onboarding (G2, 2026).
- Northbeam models reportedly need 2–4 weeks of calibration before they are reliable (Saras Analytics, competitor-authored, 2026).
- Northbeam costs rise with data volume, and reviewers say support is slower after onboarding (G2, 2026).
- Northbeam and Meta showed a 60–70% conversion gap for one Reddit user who had full CAPI and server-side tracking set up. The case shows how far platform and independent figures can diverge (u/Ill_Rope2632, r/FacebookAds, 2024).
- Northbeam’s G2 review base of 16 is small, and Northbeam’s security certifications could not be verified.
Verdict
Northbeam has the most extensively documented attribution methodology in PlugRoute’s 2026 evaluation and suits brands with high multi-channel ad spend. Northbeam’s modeled views, MMM+ and incrementality support a hybrid measurement approach that click-only tools can’t match.
Buyers should budget for Northbeam’s calibration time and check its outputs against incrementality tests. PlugRoute found no independent, published accuracy benchmark for any attribution tool as of November 2026.
As one user on r/digital_marketing described:
“tbh the thing that broke it for me was pausing stuff. A channel would look like it was carrying the week, then we’d cut it and revenue barely moved. After that I started treating attribution as a clue, not the truth.” Posted by u/escalicha
Takeaway: Pause tests often show that attributed revenue overstates a channel’s real impact, which is why even Northbeam’s advanced attribution needs to be checked against incrementality tests before budgets move.
6. Hotjar by Contentsquare: Best for Diagnosing Checkout and On-Site Friction
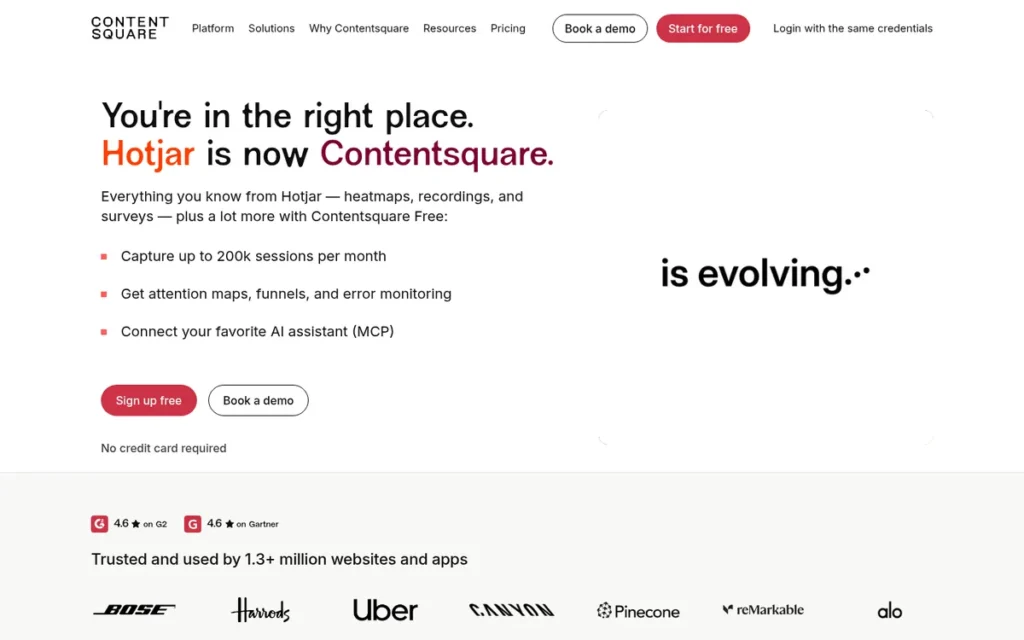
Category: Behavior Analytics, shows how shoppers interact with pages and where they hit friction, without measuring revenue.
At a Glance
- Category: Behavior Analytics
- Best For: Ecommerce teams diagnosing checkout abandonment and page friction who want surveys alongside heatmaps and recordings
- Price Range: Free plan; Growth from €39/month (billed annually); Pro and Enterprise quote-only
- Primary Strength: Hotjar by Contentsquare combines heatmaps, session recordings, funnels and on-site surveys to show why shoppers abandon pages and checkouts.
- Biggest Limitation: Hotjar by Contentsquare doesn’t connect behavior to revenue or ROI, and its post-merger paid pricing is harder to compare.
- One-Line Summary: Hotjar by Contentsquare is a behavior analytics tool that uses heatmaps, recordings and surveys to reveal why shoppers drop off, with a free plan.
- Last Verified: November 2026
Score
- Hotjar by Contentsquare scored 24.75/37.5 and scored highest of all tools on low implementation burden (C5: 4.5).
- Hotjar by Contentsquare is a single-job behavior tool with no revenue linkage, which lowered its data ownership (C4: 2) and job coverage (C6: 2.5) scores.
Overview
Hotjar by Contentsquare is a behavior analytics tool that combines heatmaps, session recordings, funnels, rage-click detection and on-site surveys to show why shoppers abandon pages and checkouts. Hotjar by Contentsquare is built for e-commerce teams diagnosing conversion friction, not for measuring revenue or ad attribution.
Contentsquare acquired Hotjar in September 2021, and Hotjar’s business was legally transferred into the Contentsquare Group on July 1, 2025 (Hotjar Help Center, 2025). Hotjar by Contentsquare now bills and prices through Contentsquare.
Key Features
- Hotjar by Contentsquare’s Observe tools provide heatmaps, session recordings, funnels, and rage-click and dead-click detection.
- Hotjar by Contentsquare’s Ask tools provide on-site surveys and feedback widgets for asking shoppers questions directly.
- Hotjar by Contentsquare’s Engage tool supports recruiting and running user interviews.
- Hotjar by Contentsquare masks form fields by default to protect shopper data.
- Hotjar by Contentsquare offers a free plan, with paid Growth, Pro and Enterprise plans under Contentsquare’s packaging.
Best For
Hotjar by Contentsquare is best for teams whose main question is where and why shoppers drop off, especially when they want survey feedback alongside recordings. Hotjar by Contentsquare does not replace sales or attribution reporting.
Pricing
- Hotjar by Contentsquare now sells Contentsquare’s Free, Growth, Pro and Enterprise plans (G2 pricing listing, November 2026).
- Hotjar by Contentsquare’s Growth plan starts from €39/month billed annually, and Pro and Enterprise are quote-only (G2 pricing listing, November 2026).
- Hotjar by Contentsquare no longer offers its former Plus, Business and Scale tiers. Buyers should confirm the free plan’s session allowance on the live Contentsquare plans page.
- Hotjar by Contentsquare’s packaging is described by third-party reviewers as more complex since the merger (Formbricks, competitor-authored, 2026).
Strengths
- Hotjar by Contentsquare reports that CCV Shop raised marketing-site conversion by 38%, from 1.3% to 1.8%, and that Wyldsson grew online sales by 30% (Hotjar, vendor-reported, 2026).
- Hotjar by Contentsquare is rated 4.3/5 on G2 from 345 reviews (G2, November 2026), and reviewers praise its easy-to-read heatmaps and quick setup.
- Hotjar by Contentsquare is the only tool in this ranking aimed squarely at checkout friction. Baymard Institute’s average documented cart abandonment rate is 70.22%, based on 50 studies (Baymard Institute, 2025).
- Hotjar by Contentsquare’s on-site surveys are the feature practitioners most often name as missing from Microsoft Clarity (u/wearethemonstertruck, r/PPC, 2025).
Limitations
Hotjar by Contentsquare trades revenue context for behavioral insight. It shows why shoppers struggle but doesn’t tie that behavior to revenue, profit or ad ROI.
- Hotjar by Contentsquare’s core features are matched by free Microsoft Clarity “for 90% of businesses,” according to one practitioner (u/QuantumWolf99, r/PPC, 2025).
- Hotjar by Contentsquare lacks real-time session monitoring and has limited native mobile-app support (FullSession, competitor-authored, 2026).
- Hotjar by Contentsquare offers priority support only on higher plans (TopAlternatives, 2026).
- Hotjar by Contentsquare retired its Plus, Business and Scale plans. Existing customers moving to Growth, Pro or Enterprise should compare their session allowances (G2, November 2026).
- Hotjar by Contentsquare’s effect on page speed is disputed in both directions on Reddit, so stores should test it on their own site (r/PPC, 2025).
Users on r/PPC shared their experience:
“I’ve been using Microsoft Clarity for a while now and can confirm that it’s a really good application… Clarity is perfectly sufficient for most use cases… I switched directly from Hotjar to Clarity and have not regretted it.” Posted by u/bubbleblub17
Takeaway: Hotjar by Contentsquare faces real pressure from free Microsoft Clarity, and some users have left Hotjar entirely once heatmaps and recordings were all they needed.
Verdict
Hotjar by Contentsquare is the only behavior analytics tool in PlugRoute’s 2026 ranking and suits teams diagnosing why shoppers abandon pages and checkouts, especially when survey feedback is needed. Hotjar by Contentsquare’s free plan lets teams test it at no cost.
Teams that only need heatmaps and recordings should compare Hotjar by Contentsquare with free Microsoft Clarity before paying for the Growth plan.
7. Glew.io: Best for Retailers Combining Online and Physical-Store Data
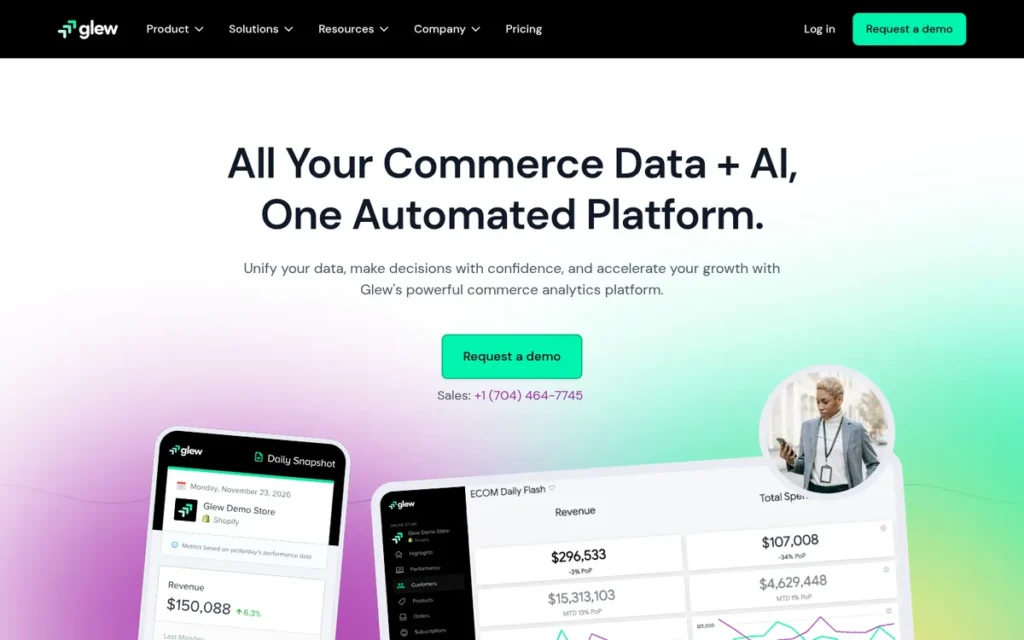
Category: Cross-Channel BI & Data Layer.
At a Glance
- Category: Cross-Channel BI & Data Layer (Multichannel Retail)
- Best For: Retailers with both online and physical-store sales that want managed data pipelines and customer, product and inventory reporting
- Price Range: Pro $250/month (annual prepayment required); Plus custom-priced
- Primary Strength: Glew.io combines online and physical-store data into customer, product, inventory and channel-level profit reporting through managed pipelines.
- Biggest Limitation: Glew.io uses only first-order and last-click attribution and requires annual prepayment on its Pro plan.
- One-Line Summary: Glew.io is a multichannel ecommerce BI platform that combines online and in-store data into customer, product, inventory and channel profit reporting.
- Last Verified: November 2026
Score
- Glew.io scored 22.75/37.5 and ranked last mainly on measurement depth (C1: 2.5), because it offers only first-order and last-click attribution.
- Glew.io’s annual-prepay pricing (C3: 3) also held it back. Missing data did not drive its ranking.
Overview
Glew.io is a multichannel e-commerce business intelligence platform that combines online store, social channel and physical-store data into customer, product, inventory and channel-level profit reporting. Glew.io is built for retailers with both online and in-store sales who want managed pipelines instead of a self-built warehouse.
Glew.io includes a managed data warehouse, a bundled Looker license and 150+ integrations on its custom-priced Plus plan (Glew.io, vendor-reported, 2026). Glew.io’s founding details and security certifications could not be verified.
Key Features
- Glew.io segments customers into groups such as VIPs, first-time buyers and lookalikes.
- Glew.io provides product, bundle and inventory analytics, including inventory turnover tracking.
- Glew.io reports profit and LTV by acquisition channel using first-order lifetime attribution, with last-click as an option.
- Glew.io runs managed ETL pipelines with pre-built ecommerce data structures and automated daily snapshots.
- Glew.io includes a managed data warehouse on its Plus plan for consolidated online and offline data.
Best For
Glew.io is best for retailers that need online and physical-store data in one place with less setup than an analyst-led warehouse platform. Glew.io is not a fit for brands that need multi-touch attribution, MMM or incrementality.
Pricing
- Glew.io’s Pro plan costs $250/month, with annual prepayment required (glew.io/pricing, November 2026).
- Glew.io’s Plus plan, which adds a managed data warehouse, a bundled Looker license and 150+ integrations, is custom-priced (glew.io/pricing, November 2026).
- Glew.io has historically offered a free tier, but current availability was not verified.
- Glew.io buyers considering Plus should get a written quote before evaluating it against Daasity or Polar Analytics.
Strengths
- Glew.io reports that home-goods brand VIETRI grew ecommerce from 8% to 30% of total business, with 3x year-over-year online sales (Glew.io, vendor-reported, 2026).
- Glew.io documents bringing together data from more than 30 physical stores plus online and social channels for retailer Hemline (Glew.io, vendor-reported, 2026).
- Glew.io reports that The Little Market increased revenue by 15% (Glew.io, vendor-reported, 2026).
- Glew.io reports a 12% increase in inventory turnover for Sunflower Digital (Glew.io editorial article, vendor-reported, 2026).
Limitations
Glew.io trades attribution depth for multichannel retail coverage. It offers only first-order or last-click attribution, with no multi-touch, MMM or incrementality (Glew FAQ, 2026).
- Glew.io requires annual prepayment on its $250/month Pro plan (glew.io/pricing, November 2026).
- Glew.io’s 4.0/5 G2 rating from 57 reviews is the lowest rating in this ranking (G2, November 2026).
- Glew.io lists 150+ integrations on its custom-priced Plus plan (Glew.io, vendor-reported, 2026), but its Amazon coverage was not verified.
- Glew.io had no Reddit discussion in this research. That says nothing about its quality either way, but it leaves less independent user evidence.
Verdict
Glew.io is a credible option in PlugRoute’s 2026 evaluation for retailers that need online and physical-store data in one reporting layer without building their own warehouse. Glew.io’s channel-level profit and LTV reporting suits merchandising and operations questions better than ad attribution questions.
Buyers should get Glew.io’s Plus-plan pricing and Amazon coverage confirmed in writing before committing, because neither could be independently verified.
What Red Flags Should I Watch For When Evaluating E-Commerce Analytics Software?
The most important red flags in e-commerce analytics software are numbers that exceed your real Shopify orders, pricing that hides cost or locks you in, attribution models used before calibration, and weak post-sale support. Each signals either cost risk or data you cannot trust, so test for them before signing any contract.
Red Flag #1: Revenue That Exceeds Your Store’s Actual Orders
If platform-reported revenue adds up to more than your Shopify orders, channels are double-counting the same sales. Adding up platform-reported revenue almost always overstates real sales, because Meta, Google and email can each claim the same Shopify order (Tribe Studio, 2026).
- Suppose Meta, Google and Klaviyo each claim the same $100 order. Your ad dashboards show $300 of attributed revenue while your bank account shows $100, so adding up platform ROAS triples your apparent return.
Red Flag #2: Pricing That Hides Cost or Locks You In
Quote-only pricing, annual commitments and tiers that jump with seasonal volume make costs hard to compare and can leave you stuck if a tool underperforms. Model your peak month, not your average month, and get every term in writing before signing.
- Glew.io Pro requires annual prepayment (glew.io/pricing, November 2026), Northbeam Professional is annual (Northbeam pricing page, November 2026) and Triple Whale Enterprise uses a 12-month contract (Stackaible, 2026). Polar Analytics, by contrast, defaults to month-to-month (Polar Analytics policy page, November 2026).
- Polar Analytics, Triple Whale and Daasity raise their prices as GMV or rolling revenue grows, so one strong sales season can move a brand into a higher tier.
- A store averaging 2,800 orders a month sits on Lifetimely by AMP’s $149 M tier. A 3,200-order Black Friday month crosses into the $299 L tier (useamp.com/pricing, November 2026).
Red Flag #3: No Stated Calibration Period for New Attribution Tracking
Attribution tools need time before their models are reliable. A vendor that doesn’t say how long invites budget decisions based on early, unstable data. Ask for the calibration period in writing, and don’t move ad budgets until it has passed.
- Northbeam reportedly needs 2–4 weeks of calibration. The Polar Analytics pixel reportedly needs about two weeks and cannot reconstruct past journeys (Saras Analytics, competitor-authored, 2026).
Red Flag #4: AI Features That Overwrite Your Manual Rules
AI-driven configuration that overwrites manual channel rules can quietly corrupt attribution, because the changes happen without an obvious audit trail. Before relying on any vendor’s AI agent, ask how manual overrides persist after edits, and test one rule yourself during the trial.
- One Triple Whale user reported that “clear prompts, regex, and manual assigning are overwritten” whenever an edit was made (u/Kind_Problem1454, r/triplewhale, 2025).
- AI agents such as Triple Whale’s Moby, Polar Analytics’ Ask Polar and Lifetimely by AMP’s Profit Agent can only be as reliable as the governed metrics underneath them (Leadgen Economy, 2026).
Red Flag #5: Months of Unresolved Support Tickets
Weak support after the sale is a recurring complaint in this category. It turns tracking errors into lasting data gaps, because tracking problems often surface months after onboarding ends. Ask for a named support contact and a written response-time commitment before signing.
- One Triple Whale customer reported about three months of support contact without a fix (u/Upstairs-Peanut-5756, r/triplewhale, 2025).
- Northbeam G2 reviewers cite slower support after onboarding (G2, 2026), and Daasity Shopify App Store reviewers mention onboarding delays (Shopify App Store, 2026).
Red Flag #6: Comparison Content Written by a Competing Vendor
Much of the published comparison content on e-commerce analytics is written by vendors that sell competing tools, which can skew rankings, ratings and limitations. Check who wrote any comparison, and confirm ratings directly on G2 or the Shopify App Store before trusting them.
- Saras Analytics, Omniconvert, Trivas, Admetrics and Polar Analytics all publish comparison content about tools they compete with, so PlugRoute labels those claims competitor-authored.
- Polar Analytics’ founder and Trivas staff posted in r/FacebookAds and r/ShopifyeCommerce threads reviewed for this article (Reddit, 2024–2025).
What Questions Should I Ask Before Choosing E-Commerce Analytics Software?
Before choosing e-commerce analytics software, confirm which of the four categories is your real gap, whether your free tracking already matches Shopify orders, and what the full pricing basis, contract and fees are. Then ask about data ownership, attribution calibration time and post-onboarding support. Together, these questions prevent overlapping purchases and lock-ins.
Question #1: Which of the four analytics categories is my actual gap?
Your gap determines your category: profit and LTV, ad attribution, behavior, or cross-channel BI. Buying across categories without a clear gap often means paying twice for overlapping reports. Before you compare vendors, name the single question you cannot answer today.
- One Shopify merchant cancelled Lifetimely by AMP because its features overlapped with Triple Whale (AppStoreResearch, 2026).
Question #2: Does my GA4 and Shopify order count match today?
Compare one day of Shopify orders with GA4 purchases and Meta Events Manager before buying anything. If the counts are far apart, the problem is tracking rather than a missing tool, and a new dashboard will only show the same gap.
- Tracking vendors estimate that client-side GA4 misses 15–30% of Shopify orders without extra setup (Analytics Agent and Heatmap.com, vendor-reported, 2026).
Question #3: What is the pricing basis, contract length and onboarding fee?
Ask whether pricing scales with orders, GMV, pageviews, sessions or rolling revenue. Then get contract length, onboarding fees and your peak-month price in writing. A good answer gives a written dollar figure for your busiest month, not a range or a promise made on a sales call.
- Onboarding or setup fees are reported for Northbeam (Trivas, competitor-authored, 2026) and Daasity (Shopify App Store, 2026).
Question #4: Will I own my raw data and have SQL access?
Data ownership decides whether you can run custom analysis or migrate later without losing history. A clear vendor answer names the warehouse and how you access it, such as SQL or export. It should also state any limits on historical data or connectors.
- Polar Analytics and Daasity include warehouse-level access on every plan, and Glew.io offers a managed warehouse on its custom-priced Plus plan (vendor pricing pages, November 2026).
Question #5: How long until the attribution model is reliable?
A credible vendor states how long its attribution model needs before results are reliable, and explains which past data it can and cannot reconstruct. A good answer gives a specific number of days, a validation plan such as an incrementality test, and next steps if the numbers disagree with Shopify.
- Attribution vendors that cannot name a calibration window or a validation method should be tested with a holdout or incrementality test before any budget moves.
Question #6: Who handles support after onboarding, and how fast?
Support after onboarding matters more than how quickly the sales team responds, because tracking problems often appear months after setup. A strong answer, given in writing, names a dedicated contact, a response-time commitment and how data discrepancies between the tool and Shopify get escalated.
- Northbeam Enterprise lists a dedicated customer success manager and Slack channel (Northbeam pricing page, November 2026).
How Did We Rank These E-Commerce Analytics Tools?
PlugRoute scored each tool from 1 to 5 on six published criteria. Three primary criteria are weighted ×1.5 and three secondary criteria ×1.0, for a maximum of 37.5 points. Every score is tied to a dated source labelled independent, vendor-reported, competitor-authored or unverified, and scores were re-verified on November 5, 2026.
No tool is ranked “most accurate,” because PlugRoute found no independent, published benchmark of attribution accuracy as of November 2026.
Primary criteria (×1.5):
- C1: Measurement Rigor and Analytical Depth. C1 matters because 63% of DTC brands and agencies name data quality and accuracy as their top challenge (Digiday/Klaviyo, State of DTC Marketing, 2025).
- C2: Verified User Ratings and Review Volume. C2 matters because ratings backed by enough reviews are the most independent signal available, while small samples can mislead.
- C3: Pricing Transparency and Commitment Risk. C3 matters because quote-only pricing, GMV-based fees and 12-month contracts make costs hard to compare.
Secondary criteria (×1.0):
- C4: Data Ownership and Integration Breadth. C4 matters because 43% of 134 DTC brands and agencies surveyed cite integration complexity that prevents a unified customer view (Digiday/Klaviyo, State of DTC Marketing, 2025).
- C5: Implementation and Support Burden. C5 matters because long onboarding, calibration and analyst dependency can overwhelm small teams.
- C6: Breadth of Analytics Jobs Covered. C6 matters because buyers want to avoid paying for overlapping single-purpose apps.
| Rank | Tool | C1 | C2 | C3 | C4 | C5 | C6 | Total (of 37.5) |
|---|---|---|---|---|---|---|---|---|
| 1 | Polar Analytics | 4 | 4 | 3.5 | 5 | 3 | 4.5 | 29.75 |
| 2 | Triple Whale | 4 | 4.5 | 3 | 3 | 2 | 5 | 27.25 |
| 3 | Lifetimely by AMP | 3 | 4.5 | 4.5 | 2 | 4 | 3 | 27.0 |
| 4 | Daasity | 3.5 | 3.5 | 3 | 5 | 2 | 4 | 26.0 |
| 5 | Northbeam | 5 | 3 | 4 | 2.5 | 2 | 3 | 25.5 |
| 6 | Hotjar by Contentsquare | 3 | 4 | 3.5 | 2 | 4.5 | 2.5 | 24.75 |
| 7 | Glew.io | 2.5 | 3 | 3 | 3.5 | 3 | 3.5 | 22.75 |
Scoring rules:
- PlugRoute combined review counts across G2 and the Shopify App Store before applying C2 caps. Polar Analytics (139 combined reviews) scored 4, Daasity (69) scored 3.5 and Northbeam (16) scored 3.
- PlugRoute capped C2 at 3–3.5 for fewer than 25 combined reviews and at 2 for ratings with no visible review count.
- PlugRoute gave a neutral 3 for support and implementation where no evidence existed. Missing evidence counted against a tool only when pricing was unpublished (C3).
- PlugRoute did not credit unverified integration counts or customer claims.
- PlugRoute re-verified pricing and ratings on November 5, 2026 and updated scores where the evidence had changed, which moved Triple Whale above Lifetimely by AMP. PlugRoute will re-score this article when vendors change their pricing.
Credibility labels:
- Independent marks review-platform data and community discussion.
- Vendor-reported marks case studies and company claims that PlugRoute has not independently checked.
- Competitor-authored marks claims published by companies that sell competing tools.
- Unverified marks figures that PlugRoute could not confirm on a vendor-owned page.
After live verification on November 5, 2026, ranks two and three are separated by 0.25 points (Triple Whale 27.25, Lifetimely by AMP 27.0). Ranks two through four sit within 1.25 points. At these margins, fit to your specific gap matters far more than rank position.
Scope:
- PlugRoute treated GA4, Shopify reports and Microsoft Clarity as the free baseline rather than ranking them, because every buyer should check them first.
- PlugRoute excluded Adobe Analytics, Mixpanel and other enterprise suites because this evaluation found too little verifiable ecommerce-specific data on them.
PlugRoute has no affiliate relationships with any company listed, and rankings are determined entirely by research data and objective evaluation criteria.
What Do Buyers Most Often Ask About E-Commerce Analytics Software?
Buyers most often ask which tool suits a small Shopify store, which tool handles multi-touch attribution best, and how PlugRoute sets its rankings. Each answer below leads with a direct answer and cites dated evidence from PlugRoute’s November 2026 verification, so each answer can be read on its own.
What is the best e-commerce analytics software for a small Shopify store in 2026?
For most small Shopify stores, the best starting point is Shopify reports, a correctly configured GA4 and free Microsoft Clarity, with Lifetimely by AMP added for profit and LTV. Lifetimely by AMP is free up to 50 orders a month, with paid tiers from $79/month (useamp.com/pricing, November 2026). Add attribution tools once your paid ad spend justifies them.
What is the best e-commerce analytics software with multi-touch attribution?
Northbeam has the most extensively documented multi-touch attribution in this ranking, with modeled views, MMM+ and incrementality, for brands spending about $30,000+ a month on ads. Triple Whale and Polar Analytics also offer multi-touch attribution, alongside profit and BI reporting, at lower entry prices (vendor pricing pages, November 2026). Validate any model with an incrementality test.
How does PlugRoute determine its e-commerce analytics rankings?
PlugRoute scores each tool from 1 to 5 on six published criteria. Three primary criteria are weighted ×1.5 and three secondary criteria ×1.0, for a 37.5-point maximum. Every score cites a dated, credibility-labelled source. Polar Analytics scored highest (29.75/37.5), and ranks two through four sit within about 1.25 points, so fit matters more than rank.
What Do Key E-Commerce Analytics Software Terms Mean?
GMV (Gross Merchandise Value): The total value of sales a store processes over a period, usually measured each year. Several platforms set their prices by annual GMV, so your bill can rise as your sales grow. Work out your expected growth before you sign.
Customer Lifetime Value (LTV): An estimate of how much revenue or profit a customer brings in over the whole relationship, often tracked at set intervals such as 3, 6, 9 and 12 months. It shows whether repeat buyers justify what you spend to win them, which revenue-only dashboards can’t show.
Cohort Analysis: Grouping customers by a shared trait, such as the month or product of their first purchase, and tracking how each group retains and spends over time. Buyers use it to spot repeat-purchase patterns and to compare how valuable customers from different sources turn out to be.
ROAS and MER: ROAS (return on ad spend) is the revenue credited to ads divided by what those ads cost. MER (marketing efficiency ratio) is a blended measure of total revenue against total marketing spend. If you add up the ROAS each ad platform reports, the result is usually too high, because several channels can claim the same order. Blended figures help you reconcile those numbers.
Multi-Touch Attribution: A method that splits credit for a sale across the several ads and channels a shopper touched before buying. It matters most for brands that spend heavily across several ad platforms. Attribution tools don’t see more data than the ad platforms do. They just assign credit differently.
First-Touch and Last-Click Attribution: Simpler models that give all the credit for a sale to the first or the last channel a shopper interacted with. They are easy to read but can misjudge channels that play a middle role. Brands with complex ad mixes may outgrow tools that offer only these models.
Marketing Mix Modeling (MMM): A statistical approach that estimates how much each marketing channel contributes to sales from aggregate spend and revenue data, without tracking individual users. More measurement setups now combine it with attribution and incrementality testing for a fuller picture.
Incrementality Testing: An experiment, such as a holdout or pausing a channel, that measures how many sales a channel actually adds and not just how many it gets credit for. It is the recommended way to check any attribution model before you move ad budget.
Server-Side Tracking and Conversions API (CAPI): Methods that send purchase events from a server rather than the shopper’s browser. They recover signals lost to iOS privacy changes and cookie restrictions. If browser-based tracking is missing orders, buyers often need this before any dashboard can be trusted.
Calibration Period: The time a new tracking pixel or attribution model needs to collect data before its results are reliable, often a matter of weeks. Ask vendors for this period in writing, and don’t change ad budgets until it has passed.
Data Warehouse and SQL Access: A dedicated database holding your raw store, ad and marketplace data, which you can query directly with SQL. It decides whether you can run custom analysis or move to another tool later without losing your history, and only some plans include it.
Semantic Layer: A shared set of predefined metric definitions, so every dashboard calculates figures like profit or LTV the same way. It prevents conflicting numbers across reports, and AI assistants built on top of the data can only be as reliable as these definitions.
Which E-Commerce Analytics Tool Is Right for You?
Key Insights
The right e-commerce analytics tool is the one that fills your specific gap, and most brands should confirm their free GA4 and Shopify tracking before paying. Polar Analytics led PlugRoute’s 2026 scoring. Ranks two through four (Triple Whale, Lifetimely by AMP and Daasity) sit within 1.25 points, so category fit matters more than rank.
- No single e-commerce analytics tool fully covers profit reporting, behavior, attribution and cross-channel BI, so most mature brands combine two or three tools.
- A one-day comparison of Shopify, GA4 and Meta order counts shows whether a store needs better tracking before it needs new software.
- Polar Analytics led PlugRoute’s 2026 scoring (29.75/37.5) on data ownership and breadth, while Lifetimely by AMP is the lowest-risk paid entry point for Shopify profit and LTV.
- Attribution tools do not see more data than Meta; they assign credit differently, so validate any attribution model with an incrementality test before moving budget.
- Because many tools price by GMV, orders or pageviews, get contract length, onboarding fees and tier thresholds confirmed in writing before signing.
Match the tool to your gap:
- Lifetimely by AMP fits brands that need profit and LTV reporting on a budget.
- Triple Whale or Northbeam fits brands whose main gap is ad attribution.
- Hotjar by Contentsquare fits teams diagnosing checkout friction.
- Polar Analytics, Daasity or Glew.io fits brands that need unified cross-channel data.
If you run a small Shopify store, start with the free stack plus a profit app. Add Hotjar by Contentsquare or Microsoft Clarity when checkout conversion becomes the problem.
If you run a $1–10M GMV brand with heavy ad spend, choose either Triple Whale or Polar Analytics. Running both alongside a separate profit app usually means paying for overlapping reports.
How to validate any tool during a trial:
- Compare seven days of the tool’s reported orders against Shopify’s order count.
- Confirm the vendor’s stated calibration period, and don’t change ad budgets until it has passed.
- Get pricing for your peak-month volume in writing from the vendor.
- Test one manual channel rule and confirm the rule persists after the tool’s AI or data sync runs.
Measurement is shifting toward blending multi-touch attribution, MMM and incrementality testing (Leadgen Economy, 2026), so expect these categories to overlap more. Accurate source data will still decide whether any dashboard can be trusted.
We update this guide quarterly. Last updated: November 5, 2026. To see how these scores were built, read PlugRoute’s full scoring methodology or browse our other independent SaaS reviews.