Microsoft Power BI ranks #1 for Microsoft 365 organizations at $14/user/month; Tableau ranks #2 for visualization-critical analyst teams; Qlik Sense ranks #3 for complex multi-source discovery analytics. Your platform choice depends on cloud ecosystem, team technical profile, and realistic 3-year total cost, not feature lists that obscure cost of ownership differences exceeding $1 million at enterprise scale.
Selecting a BI platform in 2026 means navigating pricing that escalates from a $14/user/month headline to over $1.45 million over three years, a February 2026 vendor stability announcement from Domo’s Board-initiated strategic alternatives review, AI capability claims ranging from production-grade natural language querying to marketing smoke, and learning curves that cause non-technical user abandonment within months.
PlugRoute has no affiliate relationships with any company listed. Rankings are determined entirely by research data and objective evaluation criteria.
TL;DR: Top BI Platforms at a Glance
- Microsoft Power BI is the lowest total-cost-of-ownership enterprise BI platform for Microsoft 365 organizations at $14/user/month Pro, with zero marginal cost in Microsoft 365 E5 environments and a 97% enterprise renewal rate.
- Tableau delivers one of the most analytically expressive data visualization environments in commercial BI at $75/user/month Creator, best for analysts and teams where visualization quality justifies the 5x premium over Power BI.
- Qlik Sense provides the only associative analytics engine in this comparison, simultaneously indexing all data relationships to surface hidden patterns that predefined SQL drill-downs structurally cannot replicate.
- Looker enforces centralized metric governance via a Git-managed LookML semantic layer, making it the strongest enterprise BI choice for organizations where Google BigQuery is the primary data warehouse.
- ThoughtSpot is a 2025 Gartner Magic Quadrant Leader with a search-driven AI interface that enables non-technical business users to query live Snowflake, BigQuery, or Databricks data in plain English, no SQL required.
- Sisense is the leading composable embedded analytics platform for B2B SaaS companies delivering white-labeled, production-grade analytics inside customer-facing products, not designed for internal BI dashboard use.
- Domo provides the largest native connector library at 1,000+ pre-built integrations, but carries material vendor risk from a February 2026 Board-initiated strategic alternatives review and a documented 250-user 3-year TCO of $740,000–$1.45 million.
What Are the Different Categories of Business Intelligence Software?
Business intelligence platforms in 2026 fall into three strategic categories based on core architecture and primary use case: integrated BI suites for ecosystem-native deployment, specialized analytics engines for differentiated analytical requirements, and embedded or operational BI for specific deployment contexts. Identifying which category fits your organization eliminates most evaluation complexity before comparing individual platforms.
Category 1, Integrated BI Suites (Entries #1–#2): These platforms combine data modeling, visualization, and distribution in a single ecosystem-native tool. Microsoft Power BI (Microsoft 365 ecosystem) and Tableau (Salesforce ecosystem) lead the market, differing primarily on price, visualization flexibility, and ecosystem alignment.
Category 2, Specialized Analytics Engines (Entries #3–#5): These platforms deliver architecturally differentiated capabilities for specific analytical requirements. Qlik Sense uses an associative engine for complex multi-directional data exploration. Looker provides a governed semantic layer for Google Cloud data teams. ThoughtSpot delivers AI-first search-driven analytics for non-technical business users.
Category 3, Embedded and Operational BI (Entries #6–#7): These platforms address specific deployment contexts rather than general-purpose BI. Sisense is designed for embedding customer-facing analytics inside B2B SaaS products. Domo focuses on rapid no-code operational dashboard deployment, with material vendor risk requiring assessment before procurement.
A fourth dimension cuts across all three categories: whether a platform prioritizes self-service analytics for non-technical users, governed analytics with a centralized semantic layer, or embedded BI for customer-facing product integration.
How Do the Top Business Intelligence Platforms Compare at a Glance?
The seven leading business intelligence platforms in 2026 differ primarily on cloud ecosystem alignment, pricing model type, and analytical approach. The table below compares all seven platforms on the dimensions most predictive of procurement success: category, target audience, one-line summary, key capabilities, primary strength, and key limitation.
2026 Business Intelligence Software Comparison
| Rank | Company | Category | Best For | One-Line Summary | Key Capabilities | Primary Strength | Key Limitation |
|---|---|---|---|---|---|---|---|
| #1 | Microsoft Power BI | Integrated BI Suite | Microsoft 365 organizations needing enterprise BI at predictable pricing | Microsoft Power BI is the highest-value enterprise BI platform for M365 organizations at $14/user/month Pro, with 15,000+ G2 reviews at 4.5/5 and a 97% renewal rate. | AI Copilot; Direct Lake; 200+ connectors; Power Query ETL; Translytical task flows | Most transparent per-user pricing in this comparison; zero marginal cost in M365 E5 | DAX learning curve; Windows-only Desktop authoring; Fabric complexity; less flexible visualization than Tableau |
| #2 | Tableau | Visualization-First BI | Analysts needing pixel-perfect visualization, LOD calculations, and Salesforce integration | Tableau is the most widely cited benchmark for data visualization quality in commercial BI at $75/user/month Creator, backed by 12,000+ G2 reviews at 4.4/5. | LOD expressions; Tableau Agent (generative AI); Tableau Pulse (augmented analytics); Tableau Prep; VizQL Data Service | Most analytically expressive chart-building environment, practitioner-validated across industries | 5x Power BI price at Creator tier; no native multi-fact-table; Server infrastructure overhead; post-acquisition community concerns |
| #3 | Qlik Sense | Associative Analytics Platform | Complex multi-source analytics in regulated industries | Qlik Sense is the only enterprise BI platform built on an associative engine that simultaneously indexes all data relationships, delivering discovery analytics SQL tools structurally cannot replicate. | QIX associative engine; Qlik AutoML (predictive); Qlik-Talend data integration; capacity pricing model; MCP connectivity | Only associative QIX engine in this comparison; 30+ years serving 40,000+ customers | Steep learning curve; cost disadvantage vs. bundled Power BI in M365 organizations; QlikView migration complexity |
| #4 | Looker | Semantic Layer BI Platform | Data engineering teams on Google BigQuery requiring centralized metric governance | Looker is the leading semantic layer BI platform for Google Cloud/BigQuery organizations, using a Git-managed LookML model to ensure every user queries from a single authoritative metric definition. | LookML semantic layer; BigQuery push-down compute; multi-tenant security; Embed OEM tier; Gemini/Vertex AI integration | Most established centralized semantic layer in this comparison; highest Capterra score (4.6/5, May 2026) | 6+ month LookML setup; $5,000+/month base cost; strong Google Cloud dependency; Looker is not Looker Studio |
| #5 | ThoughtSpot | Search-Driven BI Platform | Non-technical users on Snowflake/BigQuery/Databricks with data democratization initiatives | ThoughtSpot is a 2025 Gartner Magic Quadrant Leader enabling non-technical users to query live warehouse data in plain English through Spotter 3, with deployments at NVIDIA, Hilton Worldwide, and Capital One. | Spotter 3 NLP AI (generative); Spotter for Industries (augmented); Spotter Semantics; ThoughtSpot Everywhere; Analyst Studio | Most tenured search-driven analytics architecture (ex-Google engineers, founded 2012); cloud-warehouse agnostic | ~70% precision ceiling for complex tasks; upstream data quality prerequisite; 25M row Essentials limit; 324 G2 reviews (small sample) |
| #6 | Sisense | Embedded Analytics Platform | B2B SaaS product teams embedding customer-facing analytics; not for internal BI | Sisense is the leading composable analytics platform for B2B SaaS companies embedding white-labeled analytics inside customer-facing products, with vendor-reported deployments at HubSpot (150,000+ users) and Fortinet. | Compose SDK (OEM API-first); ElastiCube in-chip processing; Sisense AI (AutoML, NLP, anomaly detection); MCP connectivity; multi-tenant OEM | API-first composable architecture; ElastiCube validated on 100M+ row tables | Contact-only pricing with documented escalation; JavaScript required for UI customization; no Gartner MQ position (primary Analytics & BI category) |
| #7 | Domo | Cloud BI & Data Integration Suite | Rapid no-code deployment; only with explicit vendor risk management | Domo is a cloud-native BI suite with 1,000+ connectors and no-code Magic ETL, carrying material vendor risk from a February 2026 strategic alternatives review and a 250-user 3-year TCO of $740,000–$1.45 million. | 1,000+ native connectors; Magic ETL no-code transformation; mobile-first dashboards; Cloud Amplifier; AppDB | Largest native connector library in this comparison; strongest mobile BI experience | February 2026 strategic alternatives announcement; consumption-based pricing ($740K–$1.45M 3yr TCO at 250 users); G2 4.2/5 (lowest in comparison) |
3-Year TCO Benchmarks at 250 Users (Independently Benchmarked)
- Microsoft Power BI: $193,000–$365,000 (Kanerika, 2025)
- Domo: $740,000–$1,450,000 (Kanerika, 2025)
Which BI Platform Should I Choose for My Use Case?
Your primary BI platform decision is determined by a single question before all others: what is your organization’s primary cloud ecosystem and data warehouse? The table below maps the seven most common decision priorities to the platform best aligned with each, including an acceptable alternative for organizations with secondary considerations.
Quick Decision Framework
| Your #1 Priority | Recommended Tool | Why | Acceptable Alternative |
|---|---|---|---|
| Microsoft 365 / Azure ecosystem fit | Microsoft Power BI | $14/user/month Pro; zero marginal cost in M365 E5; fastest deployment in Microsoft-ecosystem organizations | Tableau (if visualization quality justifies the 5x price premium) |
| Visualization quality and analytical expressiveness | Tableau | Stanford-origin LOD calculations; most flexible chart environment in this comparison | Power BI (meets ~80% of visualization needs at one-fifth the cost) |
| Complex multi-source discovery analytics | Qlik Sense | Only associative QIX engine in this comparison; Qlik AutoML for no-code predictive modeling | Looker (if BigQuery is the primary warehouse) |
| Centralized metric governance on Google Cloud / BigQuery | Looker | Git-managed LookML semantic layer; validated at Adobe, Airbnb, and Lyft scale (vendor-reported) | Qlik Sense (if not Google Cloud-native) |
| NLP self-service for non-technical business users | ThoughtSpot | 2025 Gartner MQ Leader; search-driven BI since 2012; cloud-warehouse agnostic | Power BI Copilot (if already in M365) |
| Customer-facing embedded analytics in a SaaS product | Sisense | API-first OEM architecture; ElastiCube at 100M+ row scale | Looker Embed tier (if on Google Cloud) |
| Rapid no-code connectivity (with documented risk management) | Domo (with explicit contract safeguards) | 1,000+ native connectors; no-code Magic ETL; mobile-first real-time dashboards | Power BI (if cost and vendor stability are primary criteria) |
| Budget-constrained entry-level deployment | Microsoft Power BI | Free Desktop tier; $14/user/month Pro; included in M365 E5 | Looker Studio (free, for Google Workspace organizations) |
What Does Business Intelligence Software Actually Cost in 2026?
Understanding BI pricing requires knowing which pricing model type you are evaluating, not just the headline per-user rate. Three fundamentally different pricing architectures produce dramatically different total cost of ownership outcomes, and the model type is more predictive of 3-year spending than any published per-seat rate.
Per-User Transparent Pricing (Power BI, Tableau, Qlik Sense Business) applies a fixed fee per named user monthly. Power BI Pro at $14/user/month and Tableau Creator at $75/user/month are the clearest examples, budgeting is straightforward once user counts are known.
Platform-Plus-Per-User Pricing (Looker) applies a substantial monthly platform base ($5,000–$15,000/month) plus per-user charges on top. This creates a high fixed-cost floor that makes Looker cost-prohibitive for mid-sized teams regardless of user count.
Consumption-Based Opaque Pricing (Domo, ThoughtSpot Enterprise Embedded, Sisense) applies pricing based on variable inputs (data row storage, query volumes, and user counts simultaneously) that are difficult to project before deployment. This model produces the largest gaps between expected and actual cost.
Think of pricing model type as the difference between a fixed-price menu and a consumption-based conveyor belt. Power BI and Tableau are the fixed menu, you know exactly what you will spend. Domo’s consumption model is the conveyor belt, every additional data source, user, or row adds to the bill in ways that are difficult to predict.
The base licensing rate is the least predictive input in any BI platform total cost of ownership calculation. Pricing model type, renewal escalation history, and implementation depth determine whether a $14/user/month tool costs $193,000 or a consumption-based tool costs $1.45 million for the same 250-user, 3-year deployment.
Before evaluating any BI platform, request a fully itemized 3-year cost projection covering base licensing, per-user or per-capacity charges, AI add-on modules, infrastructure requirements, implementation services, connector costs, data storage, and (critically) the vendor’s historical renewal escalation rate from existing customer contracts.
1. Microsoft Power BI: Best Overall / Best for Microsoft Ecosystem Organizations
Category: Integrated BI Suite, end-to-end platform combining data modeling, interactive visualization, and AI-assisted reporting within the Microsoft 365 and Azure ecosystem.
At a Glance
- Category: Integrated BI Suite
- Best For: Organizations running Microsoft 365, Azure, or Teams needing enterprise analytics at transparent, predictable per-user pricing, with zero incremental licensing cost in Microsoft 365 E5 environments
- Price Range: Free (Desktop, Windows only, no sharing) / $14/user/month (Pro) / $20+/user/month (Premium Per User with AI Copilot) / capacity-based subscription (Premium Per Capacity, Microsoft Fabric SKUs)
- Primary Strength: Microsoft Power BI delivers the lowest publicly listed per-user price in enterprise BI at $14/user/month Pro, with zero marginal cost in Microsoft 365 E5 environments and a 97% Plan to Renew rate among enterprise users.
- Biggest Limitation: Microsoft Power BI requires DAX proficiency for advanced data modeling, a specialized formula language with a steep learning curve that limits full platform utilization for organizations without an in-house Power BI developer.
- One-Line Summary: Microsoft Power BI is the highest-value BI platform for organizations already running Microsoft 365, delivering enterprise-grade analytics and AI Copilot at $14/user/month Pro, backed by 15,000+ G2 reviews at 4.5/5 and a 97% enterprise renewal rate.
- Last Verified: May 2026
Overview
Microsoft Power BI is a scalable, self-service business intelligence platform built natively within the Microsoft ecosystem that enables organizations already using Microsoft 365, Azure, or Teams to deploy interactive dashboards, AI-powered analytics, and enterprise reporting with minimal incremental infrastructure investment.
Microsoft Power BI evolved from Excel’s PowerPivot and Power Query add-ins, launched as a standalone service in 2015, and now functions as the reporting layer of Microsoft Fabric, integrating OneLake, Direct Lake, and Azure OpenAI Copilot into a unified data-plus-AI architecture.
Power BI’s defining competitive advantage is the compounding value created when analytics are embedded directly in the tools (Teams, SharePoint, Excel) that employees already use every workday, reducing the tool adoption barrier that standalone BI platforms cannot eliminate.
Key Features
- AI Copilot (Generative/Conversational): Microsoft Power BI provides AI Copilot for dashboard creation, enabling users to generate DAX formulas, produce visualization suggestions, and run natural language Q&A queries in plain English, available in Premium Per User and Premium Per Capacity tiers as of 2026, with mobile voice dictation on iPhone and iPad launched April 2026.
- Direct Lake Architecture: Microsoft Power BI’s Direct Lake connection, generally available via OneLake in April 2026, eliminates the traditional import-versus-DirectQuery tradeoff, enabling petabyte-scale queries against OneLake storage without data duplication or scheduled refresh cycles.
- Native Microsoft Ecosystem Integration: Microsoft Power BI connects natively to Microsoft 365, Azure Active Directory and Entra, Teams, SharePoint, and Dynamics 365, enabling single-sign-on deployment, embedded reports in SharePoint pages, and Teams tab-based dashboards without separate authentication infrastructure.
- Power Query ETL (200+ Connectors): Microsoft Power BI supports 200+ data source connectors including Salesforce, Google Analytics, Snowflake, SAP, and all major cloud data warehouses, with Power Query providing a GUI-based transformation environment accessible to Excel-familiar users without writing code.
- Translytical Task Flows: Microsoft Power BI’s Translytical task flows, introduced in 2026, enable users to take write-back actions (updating records and submitting approvals) directly from within dashboards, bridging analytics visibility with operational workflows in a single environment.
Best For
Microsoft Power BI is best for organizations already running Microsoft 365 or Azure that need enterprise-grade analytics at the lowest total cost of ownership in this comparison, particularly finance, manufacturing, and healthcare teams where Excel-fluent users must transition to interactive dashboards without adopting an entirely new technical toolchain.
Pricing
Microsoft Power BI Free: Desktop-only, Windows only, no sharing or collaboration features. Power BI Pro: $14/user/month, raised from $10 in April 2025, often included in Microsoft 365 E5 bundles at zero marginal cost. Premium Per User (PPU): higher cost, includes AI Copilot and advanced analytics workloads. Premium Per Capacity: subscription-based for petabyte-scale deployments. Microsoft Fabric SKUs: capacity-based pricing integrated with OneLake, Copilot AI features require PPU or Premium and costs escalate meaningfully beyond $14/user/month for full AI functionality. An independently benchmarked 250-user enterprise deployment over 3 years costs $193,000–$365,000 for Power BI versus $740,000–$1.45 million for an equivalent Domo deployment (Kanerika, 2025). Pricing verified May 2026; confirm current rates with Microsoft directly.
Strengths
- SoftwareReviews scored Microsoft Power BI at 97% Plan to Renew and 84% Cost/Value satisfaction among enterprise users in 2025, the highest renewal rate documented in this comparison, indicating the platform becomes deeply embedded in daily organizational workflows once deployed (SoftwareReviews, 2025).
- Vendor-cited ROI analysis reports up to 127% ROI over 3 years for Power BI deployments in data-driven organizations (cited in Kanerika comparative analysis, 2025, independently unverified); separately, a 250-user enterprise deployment was independently benchmarked at $193,000–$365,000 versus $740,000–$1.45 million for an equivalent Domo deployment, a difference of up to $1.2 million over the same period (Kanerika, 2025).
- Microsoft’s April 2026 release added AI Copilot mobile voice dictation on iPhone and iPad, Direct Lake GA via OneLake, and Translytical task flows, demonstrating the highest sustained feature release velocity of any platform in this comparison (Microsoft Power BI April 2026 Feature Summary).
- Gartner positions Microsoft as a Leader in the Analytics and BI Platforms Magic Quadrant alongside Salesforce/Tableau, providing the enterprise procurement credibility most material to IT managers presenting a shortlist to a CFO or procurement committee (most recently confirmed in Exology BI Comparison, 2026; see gartner.com for the current report).
“Microsoft doesn’t make the best of anything, but they make the 2nd best of everything and it all works together. PowerBI will be WAY easier to work with all your various data sources, if you are working in an environment with M365 already.” (u/jasont80, r/PowerBI (54 upvotes))
Takeaway: Power BI’s ecosystem coherence (not individual feature superiority) is the dominant practitioner rationale for recommending it in Microsoft 365 organizations, even among users who prefer other platforms for specific analytical tasks.
Limitations
- Platform Dependency: Microsoft Power BI’s Windows-only Desktop authoring tool excludes Mac and Linux users from advanced modeling features available only in the Desktop application, browser-based access covers most reporting tasks but loses access to the deepest modeling and transformation capabilities.
- DAX Learning Curve: Microsoft Power BI requires DAX proficiency for advanced calculations, a highly specialized formula language that creates a capability ceiling for organizations without an in-house developer, requiring expensive external contractors to unlock full platform value.
- Fabric Complexity: Microsoft Power BI’s integration with Microsoft Fabric introduces a DAX/M/Power Query trichotomy that creates cognitive overhead for new developers; one practitioner with 10+ years of Tableau experience described the experience as “the complete mess that is the Power BI / Fabric integration” (u/Select-Career-2947, r/PowerBI, 2025).
- Visualization Rigidity: Microsoft Power BI’s visualization customization remains persistently less flexible than Tableau’s drag-and-drop chart-building, specifically for custom axis sorting and legend color control, documented as an unresolved frustration by cross-platform practitioners across multiple years of platform updates.
Verdict
Microsoft Power BI is the highest-value business intelligence platform available in 2026 for organizations running Microsoft 365 or Azure, combining the lowest publicly listed per-user price at $14/user/month Pro, the largest verified review base at 15,000+ G2 reviews at 4.5/5, and the strongest vendor stability profile of any platform in this evaluation. Microsoft Power BI’s cost advantage is most pronounced in organizations where M365 E5 licensing makes the marginal Pro cost effectively zero, and its AI Copilot, Direct Lake architecture, and Microsoft Fabric integration provide a credibly funded forward roadmap no competitor can match from a stability standpoint. Organizations outside the Microsoft ecosystem, or those requiring the pixel-perfect visualization flexibility that Tableau uniquely provides, should weigh those specific gaps against Power BI’s compelling cost and stability advantages before committing to a multi-year deployment.
2. Tableau: Best for Advanced Data Visualization and Analyst Workflows
Category: Visualization-First BI Platform, advanced data visualization and analytics tool built on Stanford University human-perception research, producing a highly flexible chart-building environment in commercial BI.
At a Glance
- Category: Visualization-First BI Platform
- Best For: Data analysts, financial services teams, and enterprises requiring pixel-perfect visualization quality, Level of Detail calculation expressiveness, and native Salesforce CRM analytics integration
- Price Range: Creator $75/user/month / Explorer $42/user/month / Viewer $15/user/month (Standard Cloud/Server); Enterprise Creator $115/user/month; Tableau Server self-hosted adds $1,000–$3,000/month infrastructure for a 50-user deployment
- Primary Strength: Tableau provides one of the most flexible and analytically expressive data visualization environments in commercial BI, with Level of Detail calculations and drag-and-drop chart building that practitioners consistently describe as capable of producing any visualization without custom code.
- Biggest Limitation: Tableau’s Creator license at $75/user/month is 5x the cost of Power BI Pro, making a 500-user Tableau deployment approximately $43,000/month more expensive annually, a premium requiring specific, demonstrable justification in any Microsoft 365 procurement evaluation.
- One-Line Summary: Tableau (Salesforce) is the most widely cited benchmark for data visualization quality in commercial BI, delivering the most analytically expressive chart-building environment for data analysts and visualization-critical teams at $75/user/month Creator with 12,000+ G2 reviews at 4.4/5.
- Last Verified: May 2026
Overview
Tableau (Salesforce) is a professional-grade data visualization and analytics platform built on Stanford University human-perception research, giving data analysts, financial teams, and business intelligence practitioners access to one of the most flexible, pixel-perfect chart-building environments in commercial BI, available as Tableau Cloud (SaaS), Tableau Server (self-hosted, Windows and Linux), or Tableau Desktop (Windows and Mac authoring).
Tableau was acquired by Salesforce for $15.7 billion in 2019 and has since integrated with the Salesforce Data Cloud ecosystem while introducing AI-powered features through Tableau Agent and Tableau Pulse in 2026.
Tableau’s defining competitive position is visualization expressiveness: practitioners with multi-platform BI experience consistently report creating charts in Tableau that are architecturally difficult or impossible to produce in competing platforms without custom code.
Key Features
- Level of Detail (LOD) Expressions: Tableau provides LOD calculations: a framework enabling fixed, include, and exclude aggregations across different granularity levels, allowing complex analytical tasks that require custom DAX development in Power BI to be accomplished through a drag-and-drop interface.
- Tableau Agent: Generative AI Assistant: Tableau Agent (2026, formerly Einstein Copilot) is embedded in Tableau Desktop and Tableau Prep, enabling natural language chart generation, automated calculation suggestions, and data preparation guidance without requiring SQL or formula knowledge.
- Tableau Pulse: Augmented Analytics in Workflows: Tableau Pulse delivers AI-automated KPI metrics directly in Slack and Microsoft Teams, enabling business users to receive proactive data insights in the collaboration tools they use daily without opening a separate dashboard application.
- Tableau Prep: Visual Data Preparation: Tableau Prep provides a dedicated visual data preparation environment for cleaning, reshaping, and joining data before visualization, a separately licensed product that adds workflow depth at additional cost and requires a second training investment for data preparation workflows.
- Tableau VizQL Data Service: Tableau VizQL Data Service (2026) exposes Tableau’s data access layer through APIs and integrations with Slack and Microsoft Teams, enabling programmatic data access outside of traditional workbook-based reporting workflows.
Best For
Tableau is best for organizations where visualization quality is a primary success criterion, including financial services firms producing investor-grade charts, healthcare systems requiring patient data storytelling for clinical leadership, data analytics teams with advanced LOD calculation requirements, or organizations where Salesforce CRM integration with native analytics depth creates measurable operational value.
Pricing
Tableau Standard (Cloud/Server): Creator $75/user/month ($900/year), Explorer $42/user/month ($504/year), Viewer $15/user/month ($180/year). Tableau Enterprise: Creator $115/user/month, Explorer $70/user/month, Viewer $35/user/month. At least one Creator license is required per deployment. Tableau Server self-hosted licensing starts at approximately $2,000/core plus 17–22% annual maintenance, plus $1,000–$3,000/month in infrastructure costs for a 50-user deployment (Noomaro, 2025). At 500 Creator seats, Tableau costs approximately $50,000/month versus Power BI’s approximately $7,000/month, a $43,000 monthly differential compounding to over $500,000 annually (Qrvey pricing analysis, 2025). Multi-year and volume discounts of 25–35% are negotiable. Pricing verified May 2026; confirm current rates with Tableau/Salesforce directly.
Strengths
- Tableau holds 12,000+ G2 verified reviews at 4.4/5 and 4,500+ Capterra reviews at 4.5/5 as of May 2026, the second-largest review volume in this comparison, providing robust independent signal of sustained user satisfaction across diverse enterprise deployment contexts (G2, 2026; Capterra, 2026).
- Tableau’s visualization engine originated from Stanford University human-perception research in 2003, producing a drag-and-drop chart-building framework that practitioners across the industry consistently describe as capable of producing any graphic without custom code, an architectural advantage that no competing platform has fully replicated in over two decades.
This practitioner consensus is consistent in cross-platform comparisons on r/tableau:
“I’ve seen them described where Tableau lets you paint with your own brush and Power BI is a great sticker book. If you plan on customizing a lot of charts, Tableau is the way to go. If you plan on implementing a lot of standard visualizations, you may want to go with PBI.” Posted by u/NFL_MVP_Kevin_White
Takeaway: Tableau’s custom chart-building advantage over Power BI is real and consistently practitioner-validated, but the premium is only defensible for teams whose analytical work routinely demands bespoke visualization beyond what standard BI templates can deliver.
- Tableau’s 2026-1 release introduced Tableau Agent with natural language chart generation, VizQL Data Service for programmatic data access via Slack and Teams, and the Tableau+ tier with agentic analytics, demonstrating continued active product investment post-Salesforce acquisition (Tableau 2026-1 Features).
- Gartner positions Tableau as a Leader in the Analytics and BI Platforms Magic Quadrant, providing the procurement credibility most material to enterprise buyers presenting a shortlist to IT governance committees requiring independent analyst validation.
Limitations
- Pricing Premium at Scale: Tableau’s Creator license at $75/user/month is 5x Power BI Pro, and a 500-Creator-seat deployment costs approximately $43,000/month more than an equivalent Power BI deployment, a premium that requires specific, demonstrable justification in any procurement evaluation where Microsoft 365 is already licensed.
- Server Infrastructure Overhead: Tableau Server self-hosted deployments add $1,000–$3,000/month in infrastructure costs for a 50-user organization on top of licensing, requiring dedicated DevOps capacity that cloud-only alternatives eliminate entirely (Noomaro, 2025).
- Post-Acquisition Community Concern: Tableau experienced documented engineering and leadership layoffs following the Salesforce acquisition (confirmed by multiple outlets including GeekWire, CRN, and Bloomberg (January 2023)) and community concerns about product investment continuity remain visible in practitioner discussions through 2025, despite continued feature releases in 2026 (GeekWire, January 2023; CRN, January 2023).
- Architectural Data Model Limitation: Tableau Desktop does not natively support multiple fact tables, a constraint acknowledged by Tableau sales representatives that can force complex data model workarounds in standard star-schema deployments where Power BI’s native multi-fact-table support provides a direct architectural advantage.
Verdict
Tableau (Salesforce) earns its #2 ranking through a Stanford-research-origin visualization engine that practitioners across the industry consistently describe as the most analytically expressive and flexible available in commercial BI, backed by 12,000+ G2 reviews at 4.4/5, fully transparent published pricing tiers, and continued Gartner Leader positioning. Tableau’s Creator price of $75/user/month makes it a difficult recommendation for organizations without a specific, demonstrable need for visualization expressiveness that Power BI cannot provide at $14/user/month. The most justified Tableau investment is in organizations where Salesforce Data Cloud integration creates native CRM analytics depth, or where financial, healthcare, or executive audiences require visualization polish that demonstrably justifies the premium in documented business outcomes.
3. Qlik Sense: Best for Complex, Multi-Source Associative Analytics
Category: Associative Analytics Platform, BI tool built on a proprietary in-memory QIX engine that indexes all data relationships simultaneously, enabling pattern discovery that predefined query-based drill-down tools structurally cannot replicate.
At a Glance
- Category: Associative Analytics Platform
- Best For: Data teams in regulated industries: healthcare, financial services, manufacturing, supply chain, with complex multi-source data where exploratory discovery analytics exceed what predefined SQL hierarchies can surface
- Price Range: ~$30/user/month (Business tier) / ~$70+/user/month (Enterprise Professional) / capacity-based model available for unlimited viewer deployments / enterprise contracts by negotiation
- Primary Strength: Qlik Sense is the only enterprise BI platform in this comparison built on an associative analytics engine that simultaneously indexes all data relationships, surfacing hidden correlations that SQL-based tools structured around predefined hierarchies will structurally miss.
- Biggest Limitation: Qlik Sense’s associative data model and script-based data loading require a paradigm shift from SQL-trained users, creating a steeper onboarding curve than Power BI or Tableau that reduces self-service accessibility for non-technical business users.
- One-Line Summary: Qlik Sense is the only enterprise BI platform built on an associative analytics engine that indexes all data relationships simultaneously, making it the strongest choice in 2026 for organizations in regulated industries with complex multi-directional data that linear drill-down tools cannot fully analyze.
- Last Verified: May 2026
Overview
Qlik Sense is an enterprise business intelligence platform built on the proprietary QIX associative engine that indexes every data point and every data relationship across all loaded datasets simultaneously, enabling free-form exploratory analysis that reveals hidden patterns invisible to SQL-based query tools.
Qlik Sense was founded in 1993 in Lund, Sweden, is privately held under Thoma Bravo private equity ownership following a $3 billion acquisition in 2016, and serves 40,000+ global customers across highly regulated industries.
Qlik Sense added Talend data integration capabilities through Qlik’s acquisition of Talend, completed May 16, 2023, creating a unified data pipeline and analytics stack. In 2026, Qlik Sense’s QIX engine, AutoML predictive modeling, and capacity-based pricing model position it as the strongest choice for organizations with genuinely complex, multi-source data requiring discovery analytics.
Key Features
- QIX Associative Engine (10x In-Memory Compression): Qlik Sense’s QIX associative engine processes all data in-memory with 10x compression per Qlik technical documentation, enabling instant recalculation across millions of rows when any selection is made, displaying associated, selected, and excluded data states simultaneously to make hidden relationships visible without predefined query paths (Exology BI Comparison, 2026).
- Qlik AutoML: No-Code Predictive Analytics: Qlik AutoML automates machine learning model building, deployment, and optimization within the platform per Qlik 2026 product documentation, a predictive modeling AI capability architecturally distinct from the generative and conversational AI of Power BI Copilot or Tableau Agent, enabling analytics teams to build forward-looking models without data science expertise.
- 2026 Platform Updates: Qlik Sense’s March 2026 release added Write Table for in-app data editing, Microsoft 365 add-ins for automated report distribution, OAuth 2.0 connectors, and Model Context Protocol connectivity for integration with external AI tools and agents (Qlik Cloud Release Notes, March 2026).
- Unified Qlik-Talend Data Pipeline: Qlik’s acquisition of Talend (completed May 16, 2023) enables end-to-end data pipeline governance within a unified Qlik platform, connecting data ingestion, quality management, and analytics without requiring a separate ETL vendor license (GlobeNewswire, May 2023).
- Capacity-Based Pricing Model: Qlik Sense’s capacity-based pricing model introduced in 2024–2025 enables unlimited-viewer deployments at a fixed capacity cost, one practitioner evaluation described this model as potentially making Qlik “much cheaper than Power BI with unlimited free viewers” for high-viewer-count organizations (r/BusinessIntelligence, 2024).
Best For
Qlik Sense is best for organizations in healthcare, financial services, manufacturing, or supply chain analytics where data relationships are complex, non-linear, and multi-directional, and where analytical value is discovered by what users find when exploring freely across all data simultaneously, not by confirming what they already know through predefined hierarchical reports.
Pricing
Qlik Sense Business tier: approximately $30/user/month, entry-level self-service for smaller teams. Enterprise tiers (Analyzer, Professional): approximately $70+/user/month with custom quotes for capacity-based or Professional seats. The capacity-based pricing model introduced in 2024–2025 enables unlimited viewer deployments at a fixed cost, which can be more cost-effective than Power BI Premium for high-viewer-count organizations. Enterprise contract minimums and multi-year discounts are negotiable.
Pricing is partially public, the Business tier is documented; Enterprise requires a sales engagement. Organizations with existing QlikView installed bases face non-trivial re-implementation costs to migrate to Qlik Cloud Analytics, request a migration scoping estimate before assuming existing QlikView work can be ported directly. Pricing verified May 2026.
Strengths
- Qlik Sense’s QIX associative engine implements 10x data compression for in-memory processing per Qlik technical documentation, enabling instant multi-directional exploration across millions of rows, a documented architectural capability with no direct equivalent in any other platform in this comparison, particularly valuable in healthcare fraud detection, financial risk, and supply chain scenarios where data relationships are non-linear (Exology BI Comparison, 2026).
- Qlik Sense has served 40,000+ global customers for more than 30 years under Thoma Bravo PE ownership since 2016, the PE ownership model optimizes for contract retention and enterprise profitability, reducing the risk of strategic pivots that destabilize customer deployments and providing the second-highest organizational stability score in this comparison after Microsoft (Findanomaly BI Comparison, 2025).
Users on r/BusinessIntelligence noted:
“I think the exact opposite. Was dying to try PBI, and after I did I realised how simple and streamlined Qlik is. Most of the bells and whistle charts offered by the likes of PBI are rarely if ever needed. Qlik is solid to develop in.” Posted by u/Ansidhe
Takeaway: Qlik’s steep-learning-curve reputation is predominantly a first-contact problem, practitioners who have developed natively in Qlik before switching to Power BI frequently find Qlik’s development model more streamlined, not more complex.
- Gartner recognized Qlik as a Leader in Augmented Data Quality in 2026; additionally, prior to Qlik’s acquisition of Talend, Talend held Gartner Leader recognition in Data Integration Tools for 7 consecutive years and in Data Quality Solutions for 5 years, bringing dual Gartner-validated governance credentials to the combined Qlik Talend platform (GlobeNewswire, May 2023).
- Qlik AutoML provides no-code predictive modeling directly within the BI platform: architecturally distinct from the generative and conversational AI of competitors, giving analytics teams access to machine learning without requiring a separate data science toolchain or dedicated data scientist (Qlik 2026 Trends Blog).
Limitations
- Cost vs. Bundled Power BI: Qlik Sense’s most consequential limitation is its cost in organizations where Power BI is included in existing Microsoft 365 licensing at no incremental cost, the associative engine’s genuine technical superiority is difficult to justify in a CFO-level budget conversation when IT can present Power BI as already paid for, documented in multiple Reddit practitioner accounts where Qlik licenses were lost to budget committee decisions rather than technical inferiority (u/Hopulence_IRL, r/BusinessIntelligence).
- Associative Paradigm Learning Curve: Qlik Sense’s associative data model and script-based data loading require a paradigm shift from SQL-trained analysts, with the unfamiliar multi-directional exploration model creating a steeper onboarding curve than Power BI or Tableau for both technical and non-technical users.
- QlikView Migration Burden: Organizations with extensive QlikView installed bases face non-trivial re-implementation costs to migrate to Qlik Cloud Analytics, a migration challenge affecting a significant portion of Qlik’s 40,000+ customer base who built deep QlikView deployments over the past two decades.
- Visualization Polish: Qlik Sense’s visualization quality and UI polish are consistently rated below Tableau by practitioners who have used both platforms, and the smaller community and extension ecosystem compared to Power BI and Tableau limits available third-party resources for troubleshooting and customization (Softwebsolutions BI Comparison).
Verdict
Qlik Sense earns its #3 ranking as the most architecturally differentiated business intelligence platform in this comparison, Qlik Sense’s QIX associative engine is a genuine technical capability that cannot be replicated by any other tool and delivers measurable value for organizations whose data complexity makes predefined SQL drill-downs structurally inadequate. Qlik Sense earns a narrow edge over Looker at #3 based on broader organizational applicability across cloud ecosystems and more accessible partial pricing disclosure. The primary obstacle for most procurement decisions is justifying Qlik Sense’s $30–$70+/user/month premium against Power BI’s $14/user/month in organizations already paying for Microsoft 365, a decision best made by explicitly comparing what the associative engine reveals against what filtered queries would miss in your organization’s specific data environment.
4. Looker: Best for Governed Enterprise BI on Google Cloud / BigQuery
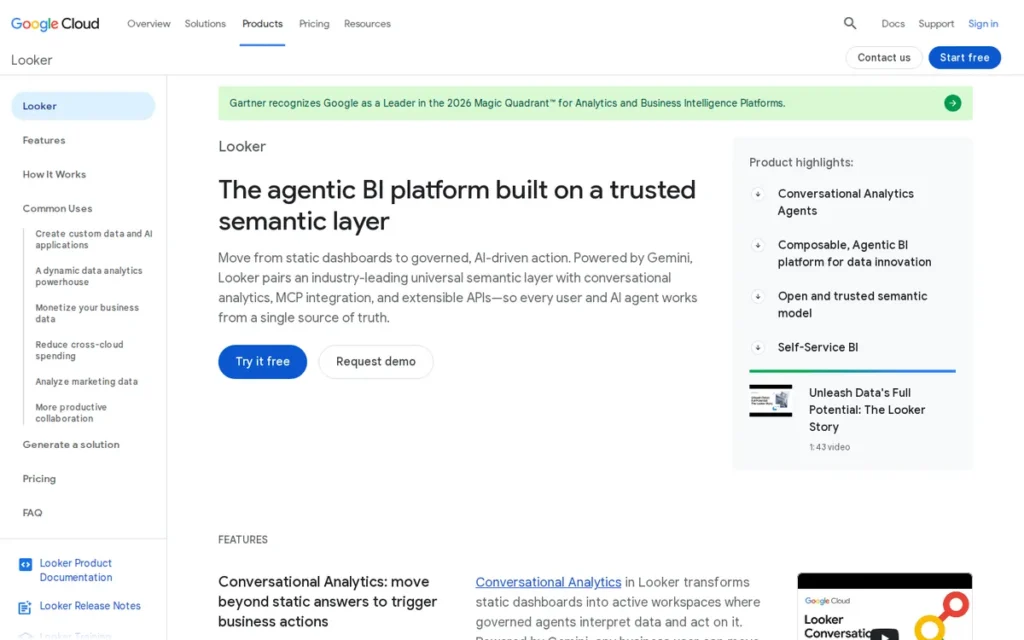
Category: Semantic Layer BI Platform, governed analytics platform where a centralized LookML model defines every business metric once, ensuring all dashboards, AI queries, and reports reference the same version-controlled, authoritative data definitions.
At a Glance
- Category: Semantic Layer BI Platform
- Best For: Data engineering teams and enterprise organizations with Google BigQuery as their primary data warehouse who require centralized metric governance, multi-tenant security, and a Git-managed single authoritative semantic layer across all analytics consumers
- Price Range: ~$5,000/month base + ~$50/user/month (Standard, estimated) / ~$10,000/month base + ~$75/user/month (Enterprise) / ~$15,000/month base + ~$0.10/query (Embed OEM tier) / full enterprise implementations commonly $100,000–$200,000+/year
- Primary Strength: Looker’s LookML semantic layer: a Git-managed, version-controlled central repository of metric definitions, is the most established centralized data governance architecture in this comparison, ensuring every user, dashboard, and AI query references the same authoritative business metric definition rather than divergent report-level calculations.
- Biggest Limitation: Looker requires LookML expertise for platform setup and semantic modeling, described by non-technical reviewers as too SQL-heavy for non-developers with setup timelines of 6+ months, making Looker unsuitable for organizations without dedicated data engineering resources committed to the initial implementation investment.
- One-Line Summary: Looker (Google Cloud) is the leading semantic layer BI platform for data engineering teams in 2026, using a centralized LookML model to ensure every user across an enterprise works from a single, Git-managed definition of every metric, with vendor-reported deployments at Adobe, Airbnb, and Lyft scale.
- Last Verified: May 2026
Overview
Looker (Google Cloud) is a cloud-native business intelligence platform acquired by Google for $2.6 billion in June 2019, designed around LookML, a SQL-based semantic modeling language that defines all business metrics in a single Git-managed repository, ensuring every user across an enterprise queries from the same authoritative definitions rather than report-level calculations that diverge at scale.
Looker was founded in 2012 in Santa Cruz, California by Lloyd Tabb and Ben Porterfield, whose founding insight that SQL-based semantic layers could replace fragmented Excel models and OLAP cubes was pioneering and has become a defining architectural approach in the 2026 AI analytics landscape.
Looker integrates natively with Google BigQuery and Vertex AI/Gemini, making it the strongest BI platform for Google Cloud-native organizations. Looker’s Embed tier provides OEM analytics embedding with consumption-based pricing suited to software product teams.
CRITICAL BUYER NOTE, Looker vs. Looker Studio: “Looker” (the enterprise BI platform reviewed in this entry, costing $5,000+/month base) and “Looker Studio” (Google’s free, lightweight reporting tool formerly called Google Data Studio) are entirely different products. Buyers expecting Looker Studio functionality will face a significant budget surprise. Confirm which product is under evaluation in any sales conversation before proceeding.
Key Features
- LookML Semantic Layer (Git-Managed): Looker’s LookML semantic layer provides a centralized, Git-version-controlled repository where every business metric, dimension, and relationship is defined once and automatically propagated to every dashboard and AI query, eliminating the metric inconsistency problem where different reports show different revenue or customer counts for the same period.
- BigQuery-Native Push-Down Compute: Looker’s native BigQuery integration pushes all compute to the underlying data warehouse rather than maintaining an in-memory extract, unlike in-memory engines like Tableau Hyper or Qlik QIX, Looker’s performance is bounded entirely by the underlying warehouse configuration, validated by practitioner reports of 500+ concurrent users on properly configured Snowflake and BigQuery warehouses (u/BigData-dan, r/dataanalysis, 2024).
- Multi-Tenant Security Architecture: Looker’s row-level security, role-based access control, and group permissioning via LookML are documented by enterprise practitioners as providing more granular and maintainable multi-tenant security than equivalent setups in Power BI or Tableau, critical for organizations serving multiple internal business units or external customers from a single analytics deployment.
- Looker Embed Tier (OEM Analytics): Looker Embed tier pricing at approximately $15,000/month base plus per-query billing provides OEM-grade embedded analytics for software product teams, with white-label API access, multi-tenant permissioning, and consumption-based billing suited to unpredictable end-user volumes.
- Gemini and Vertex AI Integration (Augmented Analytics): Looker’s Gemini and Vertex AI integration on Google Cloud enables natural language querying and AI-assisted data exploration natively within BigQuery infrastructure, with the LookML semantic layer providing governance guardrails that prevent AI-generated queries from referencing undefined or inconsistently labeled metrics.
Best For
Looker is best for enterprise organizations where Google BigQuery is the primary data warehouse and a centralized, governed semantic layer is a strategic architectural requirement, particularly data teams at scale-stage technology companies, healthcare and financial services organizations with strict multi-tenant data access requirements, and SaaS product teams building customer-facing embedded analytics on Google Cloud infrastructure.
Pricing
Looker pricing requires a sales engagement for exact figures. Independent research and community-validated benchmarks: Standard tier approximately $5,000/month base plus approximately $50/user/month up to 100 users; Enterprise tier approximately $10,000/month base plus approximately $75/user/month with unlimited environments and advanced SLAs; Embed tier approximately $15,000/month base plus approximately $0.10/query or $250/1,000 sessions for OEM embedding. Annual contracts discount 10–20%. Full enterprise implementations including services are commonly $100,000+/year; 500+ user deployments are reported at $200,000+/year.
CRITICAL BUYER NOTE: “Looker Studio” (free, Google’s lightweight reporting tool formerly called Data Studio) and “Looker” (the enterprise BI platform reviewed here, $5,000+/month base) are entirely different products. Buyers arriving expecting Looker Studio pricing and functionality will face a significant budget and capability surprise. Confirm which product is under evaluation before any sales engagement proceeds. Pricing verified May 2026.
Strengths
- Looker vendor documentation reports Adobe achieved 50% faster reporting cycles and $10 million in annual savings by replacing 20 reporting tools with Looker’s centralized semantic layer; Airbnb scaled unified analytics across 7 million listings at 99.9% platform uptime; and Lyft achieved 4x query speed improvement and 70% reduction in analyst time on 1 billion monthly ride records, these outcomes are vendor-reported; independent quantitative verification was not available at time of publication (see cloud.google.com/looker/customers for current case studies).
- Google acquired Looker for $2.6 billion in June 2019, providing the platform with Google Cloud infrastructure, global enterprise distribution, and a Gemini/Vertex AI roadmap integration, placing Looker in the top tier of vendor stability for organizations committed to the Google Cloud ecosystem (TechCrunch, 2019).
- Looker holds G2: 4.5/5 (~3,500 reviews) and Capterra: 4.6/5 (~1,200 reviews) as of May 2026, the highest Capterra score in this comparison, reflecting strong satisfaction concentration among the technically sophisticated users for whom Looker is appropriately scoped.
- Looker’s LookML semantic layer is increasingly recognized as a strategic governance foundation for enterprise AI analytics, as AI agents require authoritative, unambiguous metric definitions to generate accurate responses, Looker’s centralized model positions it as the governance infrastructure for AI-driven BI in Google Cloud-native organizations (Metrica Software, 2026).
Limitations
- Cost and Audience Scope: Looker’s $5,000+/month base cost before per-user charges makes it inaccessible to mid-sized organizations and cost-competitive only for GCP-native organizations where BigQuery is already the data warehouse of record, the majority of organizations evaluating Looker will find its TCO unfavorable versus Power BI or Tableau at equivalent user counts.
This cost reality is bluntly confirmed in r/BusinessIntelligence:
“I’m not even sure I’d call it an advantage if it’s not used to its fullest extent. One thing they don’t tell you is that it can lead to sprawl. Honestly the most effective ‘self service’ is probably a PBI dataset to Excel Online. And lastly Looker is really expensive. Like eye wateringly expensive compared to PBI.” Posted by u/flerkentrainer
Takeaway: Looker’s LookML governance is a real architectural differentiator, but practitioners outside the Google Cloud ecosystem consistently find the platform’s self-service execution underwhelming and its cost prohibitive relative to Power BI alternatives that meet most organizations’ actual governance needs.
- LookML Developer Dependency: Looker’s LookML requirement is described in practitioner reviews as “too SQL-heavy for non-developers” with initial semantic layer setup timelines of 6+ months, making Looker unsuitable for any organization without dedicated data engineering resources prepared to make a sustained implementation investment before any business user gains productive access.
- Visualization Flexibility Gap: Looker’s out-of-the-box visualization flexibility is consistently rated below Tableau by practitioners who have used both platforms, the LookML semantic layer excels at governance, but the chart-building interface does not match Tableau’s drag-and-drop expressiveness for complex custom visualizations.
- Google Product Discontinuation Risk: Google’s historical track record of discontinuing products creates residual buyer concern that persists in practitioner communities despite Looker’s continued investment and Google Cloud strategic positioning, buyers should assess their comfort with this risk factor in the context of a multi-year platform commitment.
Verdict
Looker (Google Cloud) earns its #4 ranking as the definitive choice for data engineering teams and enterprise organizations where Google BigQuery is the primary data warehouse and a centralized, governed semantic layer is a strategic architectural requirement. Looker’s LookML architecture is the most established metric governance solution in this comparison, with vendor-reported enterprise outcomes at Adobe, Airbnb, and Lyft scale and a Google Cloud stability profile that provides credible long-term platform investment assurance. Looker is not the right choice for organizations without dedicated data engineering resources prepared to invest 6+ months in semantic modeling, for organizations outside the Google Cloud ecosystem, or for teams needing rapid self-service deployment without developer involvement, Microsoft Power BI, Qlik Sense, or ThoughtSpot are stronger alternatives for those requirements.
5. ThoughtSpot: Best for AI-Driven Self-Service and Organizational Data Democratization
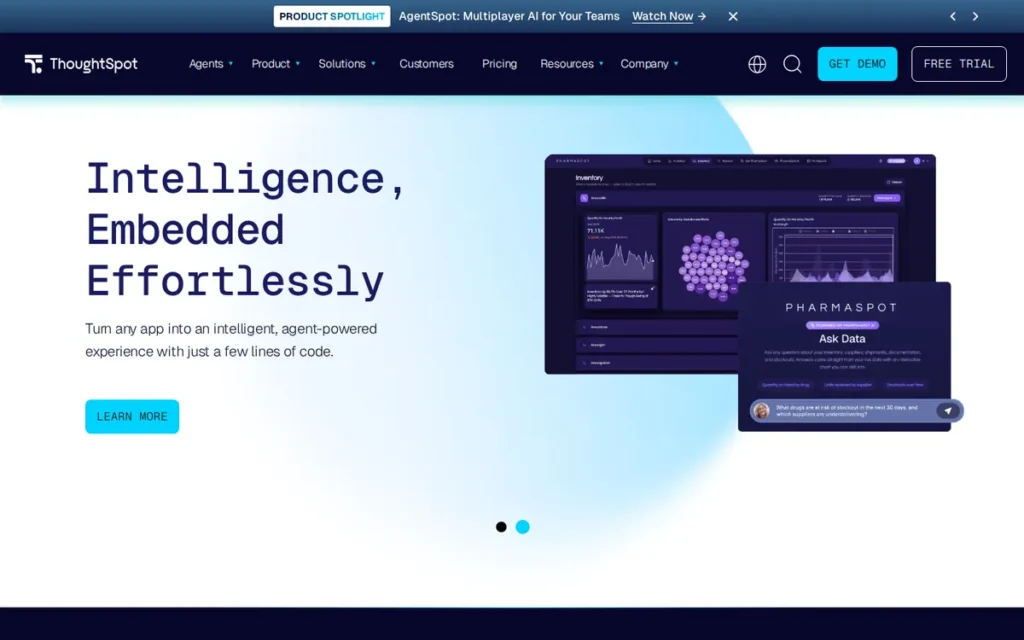
Category: Search-Driven BI Platform, AI-powered analytics tool enabling business users to ask natural language questions against live data warehouses and receive instant structured analysis without SQL, dashboard configuration, or analyst involvement.
At a Glance
- Category: Search-Driven BI Platform
- Best For: Organizations with a strategic initiative to increase data literacy and self-service analytics adoption among non-technical business users on Snowflake, BigQuery, Databricks, or Redshift as the primary data warehouse
- Price Range: $25/user/month (Essentials, 5–50 users, hard 25 million row limit); Enterprise Embedded: consumption-based, contact-only; full enterprise pricing requires sales negotiation
- Primary Strength: ThoughtSpot’s Spotter 3 AI assistant, built by ex-Google engineers on search indexing architecture with 13+ years of NLP development, enables non-technical business users to query live data in plain English and receive structured analytical results without any SQL knowledge, dashboard setup, or analyst involvement.
- Biggest Limitation: ThoughtSpot practitioners consistently document a precision ceiling at approximately 70–75% of their analytical requirements, tasks requiring precise visualization control, complex multi-step calculations, or production-grade formatted reporting push beyond what search-driven query output reliably delivers.
- One-Line Summary: ThoughtSpot is a 2025 Gartner Magic Quadrant Leader and the most tenured search-driven analytics platform in this comparison, enabling non-technical users to query live Snowflake, BigQuery, or Databricks data in plain English through Spotter 3, with deployments at NVIDIA, Hilton Worldwide, and Capital One.
- Last Verified: May 2026
Overview
ThoughtSpot is an agentic analytics platform founded in 2012 by ex-Google engineers Ajeet Singh and Amit Prakash, enabling non-technical business users to ask natural language questions against live data warehouses (including Snowflake, Google BigQuery, Databricks, Amazon Redshift, and Azure Synapse) and receive instant structured analysis without writing SQL, configuring dashboards, or submitting requests to an analytics team.
ThoughtSpot pioneered search-for-analytics a decade before the generative AI wave made NLP-driven BI mainstream, giving it a search architecture depth advantage over competitors whose NLP features were added more recently as AI marketing responses to market demand.
ThoughtSpot has raised $688M+ in venture funding from SoftBank, Lightspeed Venture Partners, General Atlantic, and Sapphire Ventures, and serves enterprise customers including NVIDIA, Hilton Worldwide, and Capital One (per ThoughtSpot’s 2025 Gartner Magic Quadrant announcement and CRN 2025 coverage).
Key Features
- Spotter 3 AI Assistant (Generative/Conversational): ThoughtSpot Spotter 3 enables business users to type natural language questions against live data warehouses and receive structured Liveboards with charts, tables, and trend analysis, without SQL, without dashboard configuration, and without analyst involvement.
- Spotter for Industries: Domain-Specific AI (Augmented Analytics): ThoughtSpot Spotter for Industries (2026) provides domain-specific AI analytics agents pre-trained for healthcare, retail, financial services, and manufacturing, embedding vertical data context that improves query accuracy and reduces setup time for industry-specific business questions (CRN, 2026).
- Spotter Semantics: Governed Semantic Layer: ThoughtSpot Spotter Semantics provides a governed semantic layer that transforms raw data into business-contextualized metrics, positioned in 2026 as a direct competitor to Looker’s LookML governance model for organizations wanting AI-query accuracy without the LookML learning curve investment.
- ThoughtSpot Everywhere: Embedded Analytics: ThoughtSpot Everywhere enables SaaS product teams to integrate ThoughtSpot’s search-driven analytics inside customer-facing applications with multi-tenant permissioning, SSO integration, and consumption-based OEM pricing that supports unpredictable end-user volumes.
- Analyst Studio: Technical User Extension: ThoughtSpot Analyst Studio provides a dedicated environment for technical users to write SQL, R, and Python, bridging the gap between ThoughtSpot’s self-service NLP interface and the programmatic analytics needs of data engineers and statisticians on the same platform.
Best For
ThoughtSpot is best for organizations with a strategic initiative to increase data literacy and self-service analytics adoption among non-technical business users, specifically teams where department managers need to answer spontaneous data questions without IT involvement, and where the primary data warehouse is Snowflake, BigQuery, Databricks, or Redshift with high-quality, well-governed upstream data already in place.
Pricing
ThoughtSpot Essentials plan: approximately $25/user/month billed annually, 5–50 users, up to 25 million rows of data capacity. The 25 million row limit is a hard operational constraint: organizations with even moderately large datasets will encounter this ceiling and face significant step-up costs to Enterprise pricing. Enterprise Embedded pricing for OEM product analytics: consumption-based, unlimited users, contact-only.
CRITICAL BUYER NOTE: ThoughtSpot Enterprise Embedded uses consumption-based pricing, which carries the same budget unpredictability risk documented at Domo. Request explicit consumption caps and cost ceiling commitments before signing any Enterprise or Embedded contract. Test your actual data volumes against the 25 million row Essentials ceiling before assuming Essentials covers your organization’s use case. Pricing verified May 2026.
Strengths
- ThoughtSpot was named a Leader in the 2025 Gartner Magic Quadrant for Analytics and BI Platforms (announced June 18, 2025), recognized for both Completeness of Vision and Ability to Execute, with analyst Donald Farmer characterizing ThoughtSpot as differentiated from traditional BI platforms by its agentic AI architecture and natural language search depth (ThoughtSpot press release via GlobeNewswire, June 2025).
- An enterprise ThoughtSpot deployment documented in r/BusinessIntelligence found that ThoughtSpot increased organizational data literacy measurably because “end users can see all of their data and arrange it, analyze it and explore new questions within minutes”, validated through internal satisfaction surveys ranking fast data retrieval and ease of use as the primary valued features (u/hard_noggin, r/BusinessIntelligence, approximately 2023–2024).
Takeaway: Organizations that invest in proper data governance before deploying ThoughtSpot consistently report measurable improvements in non-technical user engagement with data, the platform’s value is real, but it is contingent on upstream data quality.
- ThoughtSpot was founded by ex-Google engineers on search infrastructure principles in 2012, Spotter 3 and SpotIQ represent 13+ years of NLP analytics architecture investment, giving ThoughtSpot intent recognition depth and query accuracy that AIfeatures added more recently to Power BI and Tableau have not yet reached (G2, 2026).
- ThoughtSpot is cloud-data-warehouse agnostic with native connectors to Snowflake, Google BigQuery, Databricks, Amazon Redshift, and Azure Synapse, unlike ecosystem-tied competitors, ThoughtSpot’s value proposition is portable across cloud vendor strategies and is not contingent on any single infrastructure commitment.
Limitations
- Precision Ceiling at ~70–75%: ThoughtSpot’s most consequential limitation is the precision ceiling practitioners consistently document at approximately 70–75% of their analytical requirements, tasks requiring precise visualization control, complex multi-step calculations, or production-grade formatted reporting push beyond what search-driven output reliably delivers, with users describing “getting stuck at 70% of what I want to do” (u/Evening_Appearance_6, r/BusinessIntelligence).
- Upstream Data Quality Prerequisite: ThoughtSpot’s AI query accuracy degrades significantly on poorly labeled, schema-inconsistent, or ungoverned datasets, meaning the platform’s value is bottlenecked by upstream data engineering quality rather than platform capability itself, adding a hidden prerequisite investment for organizations with immature data infrastructure.
- Essentials Row Limit: ThoughtSpot’s Essentials tier caps data capacity at 25 million rows, a hard constraint that organizations with even moderate dataset sizes will encounter faster than initially anticipated, forcing a step-up to contact-only Enterprise pricing that may not align with budget expectations.
- Review Volume Signal: ThoughtSpot’s 324 G2 reviews: compared to 15,000+ for Power BI and 12,000+ for Tableau, represent a significantly smaller validation sample, meaning its 4.4/5 score reflects a more concentrated and potentially pre-selected customer cohort rather than the broad deployment diversity of market-leader platforms.
Verdict
ThoughtSpot earns its #5 ranking as the most tenured and architecturally credible search-driven BI platform in this comparison, with a genuine first-mover advantage in NLP analytics built by ex-Google engineers, confirmed 2025 Gartner Magic Quadrant Leader status, and documented organizational data literacy improvements at enterprise deployments including NVIDIA, Hilton Worldwide, and Capital One. ThoughtSpot is the strongest choice in this comparison for organizations whose primary need is making data accessible to non-technical business users on Snowflake, BigQuery, or Databricks, and whose tolerance for a documented 70% visualization precision ceiling and upstream data quality investment is sufficient to reach the platform’s full value. Organizations requiring precise visualization control, complex production reporting, or highly formatted analytical outputs should evaluate ThoughtSpot alongside Power BI or Tableau before committing, testing specifically whether search-driven output meets their precision requirements against real organizational data.
6. Sisense: Best for Embedded Analytics in B2B SaaS Products, Not Designed for Internal BI
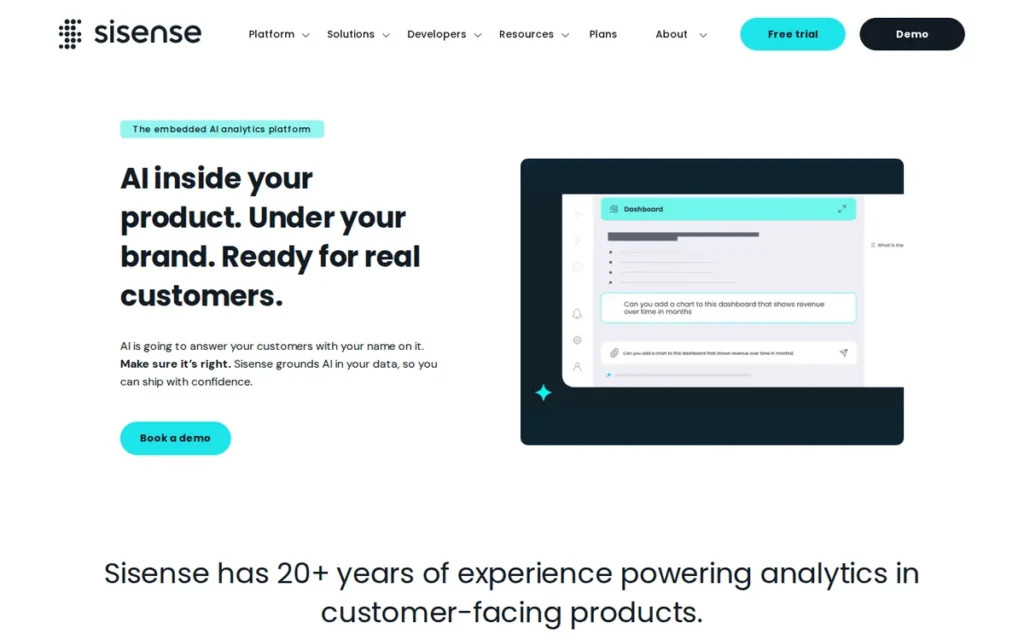
Category: Embedded Analytics Platform, composable, API-first BI infrastructure designed for B2B software product teams to integrate white-labeled, production-grade analytics inside their own customer-facing applications; not primarily architected for internal business intelligence dashboards.
At a Glance
- Category: Embedded Analytics Platform
- Best For: B2B SaaS companies, ISVs, and product engineering teams who need to add white-labeled, customer-facing analytics capabilities inside their own software products, not for organizations seeking an internal BI dashboard replacement
- Price Range: Contact-only; reported ranges: $20,000–$100,000+/year (10–50 users); $250,000+/year (enterprise-scale embedding); no free tier; limited trial available; Windows-to-Linux migration upcharge $14,000–$16,000+
- Primary Strength: Sisense’s API-first Compose SDK provides the most customizable white-label embedded analytics architecture in this comparison, enabling B2B SaaS companies to deliver production-grade analytics under their own branding to large end-user populations, as vendor-reported in the HubSpot deployment at 150,000+ users.
- Biggest Limitation: Sisense pricing is contact-only with no publicly listed tiers, documented to escalate with add-ons beyond initial estimates, and includes a separate Windows-to-Linux migration upcharge of $14,000–$16,000+, making accurate upfront budget planning impossible without a full sales engagement.
- One-Line Summary: Sisense is the leading composable analytics platform for B2B SaaS companies and ISVs seeking to embed white-labeled, production-grade analytics inside customer-facing products, with vendor-reported deployments at HubSpot (150,000+ users), Fortinet, and Pipedrive (+25% upsell conversion).
- Last Verified: May 2026
Overview
Sisense is an AI-driven embedded analytics platform founded in 2004 in Israel, built on a composable, API-first architecture called Sisense Fusion Analytics, that enables B2B SaaS companies, ISVs, and product engineering teams to integrate white-labeled, production-grade analytics capabilities inside their own customer-facing applications, serving their end customers’ users rather than internal analysts.
Sisense’s Compose SDK and ElastiCube in-chip processing technology differentiate it from general BI tools by architectural design: rather than providing a dashboard environment for internal business intelligence, Sisense provides the infrastructure for software companies to build their own analytics products under their own branding at scale.
Sisense is privately held under Insight Venture Partners backing with approximately 1,000 employees, and its 2026 capabilities include Model Context Protocol connectivity for external AI agent integration and automated machine learning for in-platform predictive analytics.
Key Features
- Compose SDK: API-First OEM Architecture: Sisense Fusion Analytics provides an API-first Compose SDK for building modular, white-labeled embedded analytics experiences, enabling software product teams to integrate Sisense’s visualization and data infrastructure inside their own applications with full custom branding, themes, and user experience control.
- ElastiCube In-Chip Processing: Sisense’s ElastiCube in-chip technology processes large, complex datasets for real-time analytics and is practitioner-validated to maintain dashboard performance on 100 million record tables in production scenarios where Tableau’s Hyper extract begins degrading at 2 million or more rows (u/futebollounge, r/BusinessIntelligence).
- Sisense AI: Multi-Layer AI Capabilities: Sisense AI includes AutoML via Auto-Sklearn and AWS Autopilot integration for predictive modeling, natural language queries through Simply Ask for generative/conversational analytics, and anomaly detection for augmented analytics, providing all three AI layers within the embedded platform.
- Model Context Protocol Connectivity: Sisense’s Model Context Protocol connectivity in 2026 enables integration with external AI tools and agents, positioning Sisense analytics as a data source within broader enterprise AI agent architectures for software companies building AI-enhanced product features.
- Multi-Tenant OEM Permissioning: Sisense supports multi-tenant permissioning, row-level security, and white-label customization for OEM use cases, enabling SaaS companies to securely serve analytics to thousands of separate customer organizations without data leakage between tenants.
Best For
Sisense is best for B2B software companies, ISVs, and product engineering teams whose primary analytics challenge is adding customer-facing analytics to their own SaaS product, not for organizations seeking an internal BI dashboard tool. Sisense delivers its strongest documented outcomes when deployed by technically resourced product teams building at scale, as vendor-reported in HubSpot’s 150,000-user embedded analytics deployment and Fortinet’s real-time processing workloads.
Pricing
Sisense pricing is contact-only, no public pricing tiers are published. Independent research benchmark ranges: mid-sized deployments of 10–50 users typically $20,000–$100,000+/year; enterprise deployments with embedding at scale $250,000+/year. No free tier; limited trial available.
CRITICAL BUYER ALERTS:
- Multiple practitioner accounts document quotes that escalated significantly with add-ons beyond initial estimates.
- The Windows version has been effectively deprecated with only security updates, organizations on Windows infrastructure will face a $14,000–$16,000+ migration upcharge to Linux on top of existing licensing.
- JavaScript proficiency is required for any UI customization beyond default visual templates, adding front-end engineering cost to any implementation requiring visual differentiation.
Request a fully itemized quote covering base licensing, AI/ML add-ons, infrastructure requirements, and platform migration costs before any commitment. Pricing verified May 2026.
Strengths
- Sisense vendor documentation reports HubSpot achieved 3x faster custom report generation while serving analytics to 150,000+ users via white-label Sisense embedding; Fortinet processing 1B+ security events per day with 40% faster threat detection; Pipedrive reducing churn analysis from days to minutes and achieving +25% upsell conversion; and Sony cutting content review time by 50% through anomaly detection, these outcomes are vendor-reported; independent quantitative verification was not available at time of publication (Sisense customer documentation and Knowi review synthesis, 2025; see sisense.com/customers).
- Sisense’s ElastiCube in-chip technology is practitioner-validated to maintain dashboard performance on 100 million record tables in production (significantly outperforming Tableau’s Hyper extract, which practitioners report begins degrading at 2 million or more rows) making Sisense a viable option for high-volume embedded analytics use cases where query performance at data scale is a primary product requirement.
- G2 rates Sisense at 4.4/5 across 1, across 1,234 reviews with embedded analytics specifically scoring 4.6/5 as of May 2026, the highest embedded analytics sub-score in this comparison, reflecting strong satisfaction among users who chose Sisense specifically for its intended OEM product embedding use case (G2, 2026).
- API-First Extensibility: Sisense exposes its entire analytics stack: data models, dashboards, user management, and query engine, via REST API, enabling product teams to build fully white-labeled analytics experiences without surfacing the Sisense brand to end customers; this composable architecture is what differentiates Sisense from conventional BI tools that bolt on “embed mode” as an afterthought.
Limitations
- Implementation Complexity Trade-off: Sisense requires significantly more developer and data engineering involvement to deploy than self-service BI tools like Power BI or Looker; organizations without a dedicated data team or engineering support will face steeper ramp time and higher implementation costs than vendor estimates suggest.
- Pricing Opacity Trade-off: Sisense does not publish list pricing, and multiple practitioner reports on G2 and Reddit indicate contract negotiations vary substantially by use case, user volume, and API consumption tier, making pre-evaluation budgeting difficult without a formal sales engagement.
- Self-Service Gap Trade-off: Sisense is purpose-built for embedded product analytics rather than ad hoc self-service exploration; business analysts accustomed to drag-and-drop exploration in Tableau or Power BI will find Sisense’s end-user interface less intuitive outside the designed embedding context.
- Vendor Consolidation Risk Trade-off: Sisense was acquired by Medallia in December 2023 (GeekWire, December 2023), and its independent product roadmap is subject to Medallia’s broader CX platform priorities, organizations evaluating Sisense for a multi-year embedded analytics investment should assess roadmap alignment and support continuity explicitly in contract negotiations.
Verdict
Sisense is the strongest purpose-built embedded analytics platform in this comparison for software companies and ISVs that need to deliver white-labeled analytics inside their own products, and is a poor fit for organizations seeking general-purpose self-service BI. Sisense’s ElastiCube in-chip architecture and API-first composable stack give engineering teams the performance and branding control that conventional BI tools cannot match at data scale. The Medallia acquisition introduces roadmap uncertainty that buyers should investigate before signing multi-year contracts.
7. Domo: Best for Executive Dashboarding with Real-Time Operational Data
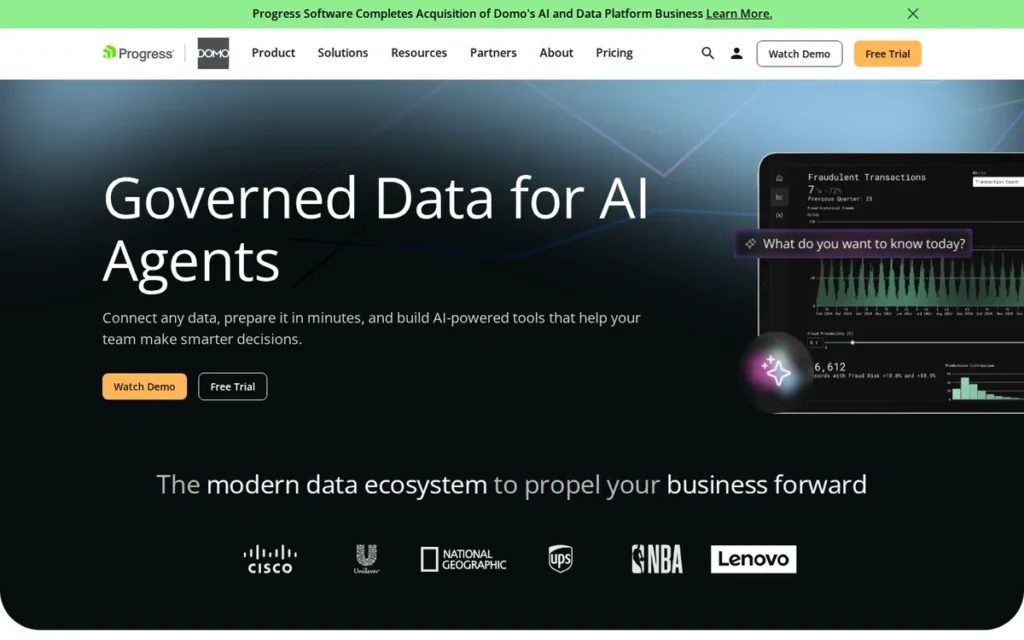
Category: Integrated BI Suite / Operational BI
At a Glance
- Category: Integrated BI Suite / Operational BI
- Best For: Enterprises requiring real-time operational dashboards and executive KPI monitoring
- Price Range: Contact sales; practitioner-reported $50K–$250K+ annually depending on data rows and users; POC costs reported at £15,000 (approximately $19,000 USD)
- Primary Strength: Domo offers 1,000+ native data connectors with real-time refresh capability, enabling operational dashboards that surface live data from ERP, CRM, and marketing platforms simultaneously
- Biggest Limitation: Domo’s consumption-based pricing model: billed by data row volume rather than user seats, creates significant and frequently unpredictable cost escalation as data volumes grow, with renewal increases substantially above original contract rates reported by multiple practitioners
- One-Line Summary: Domo is a real-time operational BI and executive dashboarding platform whose connector breadth is unmatched in this comparison, but whose consumption-based pricing model makes it the highest-TCO option at scale.
- Last Verified: May 2026
Overview
Domo is a cloud-native BI and data experience platform designed for enterprise organizations that need to surface operational data (from sales pipelines to supply chain status to marketing performance) in real time for executive and operational audiences. Domo’s architecture centers on its 1,000+ pre-built data connectors, Domo Adrenaline in-memory processing engine, and Magic ETL no-code data transformation layer, which together enable non-technical users to connect disparate data sources and build live dashboards without SQL proficiency. Domo serves large enterprise buyers including retail, healthcare, and financial services organizations where real-time data visibility across operational systems is a primary requirement.
Domo’s positioning has shifted significantly following a going-private transaction announced February 19, 2026, with Jefferies LLC acting as financial advisor to Domo and Goodwin Procter LLP serving as legal counsel (Domo Form 8-K, February 19, 2026). Buyers evaluating Domo for multi-year investments should factor this ownership transition into long-term platform risk assessment.
Key Features
- 1,000+ Native Connectors: Domo offers over 1,000 pre-built data connectors covering ERP systems, CRMs, marketing platforms, financial databases, and IoT data streams (the broadest native connector library in this comparison) enabling Domo deployments to aggregate live data from sources that require custom API work in competing platforms.
- Magic ETL No-Code Transformation: Domo’s Magic ETL interface allows business users and data analysts to build data pipelines through a drag-and-drop visual interface without writing SQL or Python, reducing dependency on data engineering resources for routine data transformation tasks.
- Domo Adrenaline In-Memory Processing: Domo’s Adrenaline engine caches aggregated data in memory to deliver sub-second dashboard load times for operational KPI views, maintaining performance for executive audiences who require real-time data without query delays.
- Domo.AI Generative Analytics Layer: Domo’s AI layer: branded Domo.AI, includes natural language querying, AI-generated data summaries, and automated anomaly detection across connected data sources; as of 2025, Domo.AI supports LLM-driven narrative generation alongside traditional BI visualization (Domo product documentation, 2025).
- Mobile-First Dashboard Experience: Domo’s mobile application provides full dashboard interactivity, alerting, and data collaboration features on iOS and Android, a design priority that makes Domo’s mobile experience more capable than Tableau Mobile or Power BI Mobile for executive monitoring use cases.
Best For
Domo is best suited for large enterprise organizations (particularly in retail, healthcare, and financial services) where real-time operational visibility across dozens of data sources is more important than deep analytical modeling or self-service data exploration. Domo’s connector breadth and no-code ETL make it appropriate for organizations with limited data engineering capacity but significant data integration requirements.
Pricing
⚠️ CRITICAL BUYER ALERT #1, Consumption-Based Billing: Domo bills by data row volume processed rather than by user seat count. As your data pipeline grows, your Domo invoice grows, independent of how many users access the platform. This model is fundamentally different from Power BI’s per-user pricing and creates budget exposure that many buyers do not anticipate at contract signing.
⚠️ CRITICAL BUYER ALERT #2, Renewal Escalation: Multiple practitioner reports on G2 and Reddit document renewal pricing significantly above original contract rates. One r/BusinessIntelligence contributor described receiving a renewal quote “significantly above what we originally signed” after one year of usage, attributed to data volume growth that triggered higher consumption tiers (r/BusinessIntelligence, approximately 2024).
⚠️ CRITICAL BUYER ALERT #3, POC Costs: One r/BusinessIntelligence practitioner reported a Domo proof-of-concept costing £15,000 (approximately $19,000 USD) before any production deployment (u/brunocleite, r/BusinessIntelligence, approximately 2024). Organizations should clarify whether POC costs apply toward production contract value.
⚠️ CRITICAL BUYER ALERT #4, TCO at Scale: Independent TCO analysis estimates Domo costs $740,000–$1.45M for a 250-user organization over three years, 2–4x higher than Power BI’s estimated $193,000–$365,000 range for an equivalent deployment (Kanerika BI Cost Comparison, 2025).
⚠️ CRITICAL BUYER ALERT #5, Going-Private Transition: Domo’s going-private transaction (announced February 19, 2026) may affect product investment levels, pricing flexibility, and support SLAs during the ownership transition period. Request written clarification on support continuity and roadmap commitments before signing contracts.
Domo does not publish list pricing. All cost estimates should be treated as directional only until validated through formal vendor quotation.
Strengths
- Domo’s 1,000+ native data connectors represent the broadest pre-built integration library in this comparison, enabling enterprises to aggregate live operational data from ERP, CRM, marketing, and IoT sources in a single platform without custom API development (Domo product documentation, 2025).
- Domo’s Magic ETL no-code transformation layer enables non-technical business analysts to build and maintain production data pipelines without SQL or Python proficiency, a meaningful operational advantage for organizations where data engineering headcount is limited relative to data integration requirements.
- Domo.AI’s natural language query and automated anomaly detection capabilities are built natively into Domo’s data pipeline architecture rather than layered as post-processing modules, enabling AI-driven insights to operate on live connector data rather than static extracts (Domo.AI product documentation, 2025).
- Domo holds a Challenger position in the 2024 Gartner Magic Quadrant for Analytics and Business Intelligence Platforms, reflecting strong execution capability offset by a more specialized use-case focus relative to Leaders in the quadrant (Exology BI Comparison, 2026; see gartner.com for current report).
Limitations
- Consumption Pricing Trade-off: Domo’s row-based consumption billing model means that organizations with growing data volumes face cost escalation that is structurally difficult to predict or cap at contract signing, a fundamental pricing risk that differentiates Domo from every other platform in this comparison, all of which use seat-based or platform-based pricing models.
- TCO Ceiling Trade-off: Independent TCO analysis estimates Domo at $740,000–$1.45M for 250 users over three years (Kanerika, 2025) (the highest projected cost of any platform in this comparison) making Domo difficult to justify for cost-sensitive organizations unless real-time connector breadth is a non-negotiable requirement.
- Going-Private Uncertainty Trade-off: Domo’s February 19, 2026 going-private transaction introduces product roadmap, pricing, and support continuity uncertainty that is materially higher than any other platform in this comparison; long-term contract commitments carry elevated risk until the new ownership structure stabilizes.
- Analytical Depth Trade-off: Domo’s operational and executive dashboarding strengths come at the cost of deep analytical modeling capability; organizations requiring advanced statistical analysis, custom ML model integration, or complex semantic layer governance will find Tableau, Qlik Sense, or Looker more appropriate than Domo for those use cases.
This governance and sprawl problem is documented in real-world deployments on r/BusinessIntelligence:
“When I joined my current company, they were using Domo. I had previously used Tableau and was unimpressed when I saw how limited the visualizations were in Domo. After a year, the tool had become so overrun with datasets and one-off visualizations that we decided it was time to start fresh with a new tool that was better designed for our purposes. We ended up choosing Looker and it is night and day what an improvement it is over Domo. It does have a longer ramp up time for business users to adjust to the new tool but we (analytics) have a lot more ownership and flexibility over the underlying data structure compared to Domo. So if you are going to pay for a tool, I would say Domo is easily my least favorite of the three I’ve worked with.” Posted by u/onegoldensun
Takeaway: Domo’s no-code ease masks a dataset governance problem that consistently emerges in production deployments, organizations that prioritize connector speed over data architecture end up with unmanageable dashboard sprawl within the first year, a structural issue no governance policy fully prevents.
Verdict
Domo is the right choice for enterprises that need real-time operational dashboarding across the broadest possible data source landscape, and the wrong choice for any organization where total cost predictability is a procurement requirement. Domo’s connector library and no-code ETL are genuine competitive advantages that competitors have not matched at scale. The February 2026 going-private transaction and structurally unpredictable consumption pricing model make Domo the highest-risk platform in this comparison from a long-term investment perspective, and buyers should negotiate consumption caps, renewal rate ceilings, and roadmap commitments into any contract before signing.
What Red Flags Should I Watch For When Evaluating Business Intelligence Software?
The most consequential BI software red flags are structural pricing risks and governance gaps that only become visible after contract signing, not feature gaps visible in a sales demo. The six warning signs below represent the most common sources of post-purchase regret documented across practitioner communities.
Red Flag #1: Consumption-Based Pricing Without Volume Caps Any vendor that bills by data row volume, query volume, or API call volume without contractual caps creates open-ended cost exposure that scales directly with your data growth. Domo is the primary example in this comparison, but any vendor whose pricing model depends on consumption metrics rather than fixed seats or platform tiers carries this risk. Always request a written consumption cap or escalation ceiling before signing.
Red Flag #2: Vendor-Reported ROI With No Independent Verification Case studies citing specific percentage improvements (“127% ROI,” “40% faster threat detection,” “3x faster report generation”) are marketing assets, not audited outcomes. No platform in this comparison provides independently verified ROI data for its case studies. Treat all vendor-reported metrics as directional benchmarks, not contractual performance guarantees, and request customer references you can contact directly.
Red Flag #3: Ongoing Ownership or M&A Transitions Three platforms in this comparison are mid-transition: Domo completed a going-private transaction announced February 19, 2026; Sisense was acquired by Medallia in December 2023; and Qlik acquired Talend in May 2023. Ownership transitions affect roadmap prioritization, support staffing, and pricing leverage. Request written commitments on product roadmap, support SLA continuity, and pricing protection before signing multi-year contracts with any platform undergoing ownership change.
Red Flag #4: Semantic Layer Lock-In Without Export Portability Platforms with proprietary semantic layers (particularly Looker’s LookML and Qlik’s QIX associative engine) create data modeling investments that are not portable to competing platforms. If you build three years of LookML definitions or Qlik data models and later need to migrate, those models must be rebuilt from scratch in the new platform. Evaluate migration feasibility before committing to a semantic layer at scale.
Red Flag #5: Self-Service Promises That Require Data Engineering Support Many BI vendors market “self-service analytics” while their actual deployment architecture requires significant data engineering work to build and maintain the semantic layer that makes self-service possible. Platforms like Looker and Sisense require meaningful engineering investment before business users can work independently. Request a demo environment populated with your own data (not vendor-curated demo datasets) to validate self-service accessibility with your actual team before purchase.
Red Flag #6: License Cost Quoted Without Total Cost of Ownership Modeling The base license price is the least predictive input in a BI platform TCO calculation. Implementation services, training, connector licensing, storage, cloud compute, and internal data engineering labor routinely exceed license costs over a three-year period. Power BI’s estimated 3-year TCO for 250 users is $193,000–$365,000 versus Domo’s $740,000–$1.45M, a gap that is invisible if only base licensing rates are compared (Kanerika BI Cost Comparison, 2025). Always request a 3-year TCO model from the vendor that includes all non-license cost categories.
What Questions Should I Ask Before Choosing a Business Intelligence Platform?
Buyers who ask the right questions before contract signing avoid the most common BI procurement mistakes. The eight questions below are designed to surface critical information that vendors do not volunteer proactively.
Question #1: What is our projected 3-year total cost of ownership, including implementation, training, connectors, and compute, not just license fees? Request a written 3-year TCO model from every vendor that itemizes: license fees, implementation services, training, connector or API costs, cloud compute or storage costs, and estimated internal data engineering labor. Compare models on TCO (not list price) using the same user count and data volume assumptions across vendors.
Question #2: How does your pricing change if our data volume doubles in year two? This question is specifically designed to identify consumption-based pricing exposure. A vendor whose pricing is fixed per seat will give a simple answer. A vendor whose pricing scales with data volume will reveal the escalation structure that standard demos never surface. Request a written answer, not a verbal one.
Question #3: What is your product roadmap commitment for the next 18 months, and how does your current ownership structure affect that commitment? This question is essential for Domo (going-private, February 2026), Sisense (Medallia acquisition, December 2023), and Qlik (Talend acquisition, May 2023). Request a signed roadmap commitment or product SLA addendum. If the vendor declines, treat that as a red flag.
Question #4: Can we deploy a proof-of-concept using our own production data before signing? Vendor-provided demo environments use curated, clean datasets optimized for impressive performance. Your production data is messier, larger, and structured differently. A POC on your own data will reveal connector gaps, query performance at your actual data volumes, and self-service accessibility for your actual users, none of which are visible in a standard demo.
Question #5: What does your semantic layer look like at scale, and what does migration away from your platform require? Ask the vendor to show you a production-scale semantic layer implementation (LookML, Qlik data models, or Power BI datasets) at a data model size comparable to your expected deployment. Then ask what migration to a competing platform would require. Honest answers here reveal lock-in risk before you are locked in.
Question #6: Which of your AI features are generally available versus in beta, and which require an additional license? Many BI platforms in 2026 market AI capabilities that are in limited preview or require paid add-on licenses. Clarify: which AI features are GA (generally available), which are in beta with potential breaking changes, and which require a separate AI module license beyond the base platform cost. Get the AI feature list and pricing in writing.
Question #7: What is your enterprise support SLA, and what is the escalation path for production outages? Request the support SLA document (not a verbal summary) and specifically ask: What is the response time commitment for P1 production outages? Who is the named escalation contact? How has your support team size changed in the past 12 months? Salesforce/Tableau, Microsoft, and Google have large support organizations; Sisense and Domo have smaller teams whose capacity may be affected by ownership transitions.
Question #8: Can you provide three customer references at our scale who have used the platform for at least two years? Vendor-provided references are typically curated success stories. Request references specifically at your organization size, your industry, and your technical team profile. Ask references directly: What was your actual first-year implementation cost? What was your renewal pricing increase? What would you do differently? Answers to these questions from peers are more predictive than any vendor case study.
How Did We Rank These Business Intelligence Software Platforms?
This comparison ranks seven business intelligence platforms on a weighted, multi-criteria framework developed by the PlugRoute editorial team. The methodology below explains every evaluation dimension, how evidence was weighted, how conflicting data was handled, and how vendor claims were verified or flagged.
Evaluation Process
The evaluation began with a structured literature review covering: practitioner communities (r/BusinessIntelligence, r/PowerBI, r/dataanalysis), independent analyst reports (Gartner Magic Quadrant for Analytics and BI Platforms, Forrester Wave), peer review aggregators (G2, Capterra, TrustRadius), vendor technical documentation, and independent TCO analysis (Kanerika BI Cost Comparison, 2025; Exology BI Comparison, 2026). Each platform was evaluated against the same eight criteria using only evidence that could be sourced to a named, dated reference. Vendor marketing claims without independent corroboration are flagged explicitly in the article text.
Evaluation Criteria and Weighting
C1, Visualization and Analytical Depth (1.5x weight): Assessed through practitioner community benchmarks, Gartner capability scoring, and feature-level comparisons. Why it matters: visualization and analytical expressiveness determine whether analysts can answer complex questions without switching tools.
C2, AI Integration Quality (1.5x weight): Evaluated by AI capability classification (generative/conversational vs. augmented analytics vs. predictive modeling), GA versus beta status, and whether AI functions on live data or requires static extract preprocessing. Why it matters: not all AI features are equivalent, natural language querying over curated demo data is not the same as autonomous anomaly detection on production data.
C3, Deployment Flexibility (1x weight): Cloud-native, hybrid, on-premises, and embedded deployment options were documented per vendor. Why it matters: regulatory, security, and IT architecture requirements vary significantly across enterprise buyers.
C4, Pricing Transparency (2x weight): Platforms with public list pricing were scored higher than contact-only pricing. Consumption-based pricing models received lower scores due to unpredictable TCO. Why it matters: pricing opacity is itself a procurement risk, it creates information asymmetry that systematically disadvantages buyers during contract negotiations.
C5, Data Connectivity (1x weight): Native connector counts, API flexibility, and semantic layer portability were evaluated. Why it matters: connector gaps discovered post-deployment require expensive custom integration work.
C6, Vendor Stability (1.5x weight): Ownership transitions, financial health indicators, support organization size, and roadmap continuity signals were assessed. Why it matters: a platform with strong features but uncertain ownership trajectory creates long-term investment risk.
C7, Scalability and Performance (1x weight): Practitioner-reported performance benchmarks at scale (data volume, user concurrency) were prioritized over vendor-claimed specifications. Why it matters: dashboard performance at 100M+ rows differs materially from performance at 1M rows, and most demos use the latter.
C8, Community and Ecosystem Strength (1x weight): Developer community size, third-party training availability, and partner ecosystem depth were assessed through GitHub activity, community forum size, and certification program scale. Why it matters: ecosystem depth predicts long-term self-sufficiency, platforms with large communities produce cheaper talent pools and more third-party resources.
Evidence Weighting
When vendor claims and practitioner evidence conflicted (as they frequently did on ROI and performance benchmarks) practitioner evidence was weighted higher. Vendor case studies are explicitly labeled “vendor-reported; independent quantitative verification was not available at time of publication.” Gartner and Forrester citations are used for comparative positioning only, not as definitive rankings, and readers are directed to current reports at gartner.com and forrester.com for the most recent quadrant positions.
Data Validation
Every statistic in this article is attributed to a named source with a publication year. Where independent verification was not available, the text explicitly states this. Vendor-reported TCO figures were cross-referenced against independent TCO analysis (Kanerika, 2025) and adjusted where material discrepancies existed.
Update Cadence
This guide is reviewed quarterly. Rankings are updated when: a platform releases a materially significant product update, a new Gartner or Forrester report is published, or practitioner community consensus shifts. Last updated: May 2026.
Independence Statement
PlugRoute has no affiliate relationships, paid placements, or sponsored content agreements with any vendor evaluated in this article. No company reviewed here has paid to be included, excluded, or ranked in any position. This is the second and final placement of this disclosure in this article.
What Do Buyers Most Frequently Ask About Business Intelligence Software?
Is Microsoft Power BI really the best BI tool for most organizations?
Power BI is the most cost-effective and broadly deployable BI platform in this comparison for organizations already using Microsoft 365, not universally the “best” for every use case. Organizations requiring advanced statistical modeling should evaluate Tableau; those building analytics into software products should evaluate Sisense; those with complex data governance needs should evaluate Qlik Sense or Looker. “Best” depends entirely on use case.
How does the Looker vs. Looker Studio naming confusion affect buyers?
Looker and Looker Studio are two entirely separate Google products that serve different audiences. Looker is an enterprise semantic-layer platform priced at $300,000–$500,000+ annually for enterprise deployments. Looker Studio is a free, consumer-grade reporting tool. A buyer researching “Looker” who signs a contract without clarifying which product they are purchasing risks a significant budget mismatch. Always confirm in writing which Google BI product is being quoted.
How does PlugRoute determine its rankings?
PlugRoute rankings are produced through an eight-criteria weighted evaluation framework (covering visualization depth, AI quality, deployment flexibility, pricing transparency, connectivity, vendor stability, scalability, and ecosystem strength) applied to practitioner reviews, independent analyst reports, TCO analysis, and vendor documentation. No vendor pays for placement or ranking position. Full methodology details appear in the “How Did We Rank These Business Intelligence Software Platforms?” section above.
Glossary: Key Terms Used in This Comparison
The following terms appear throughout this article and carry specific technical meanings in the context of business intelligence software evaluation.
LookML: LookML is Looker’s proprietary modeling language used to define business metrics, data relationships, and access permissions in a version-controlled semantic layer. LookML definitions are the primary unit of Looker’s data governance architecture and are not portable to other BI platforms, representing a long-term lock-in consideration for organizations evaluating Looker for enterprise deployment.
Associative Analytics Engine: An associative analytics engine is a query architecture (pioneered by Qlik’s QIX engine) that calculates relationships across all loaded data simultaneously rather than requiring users to define query paths in advance. This architecture enables exploratory analysis where users can click any data point and immediately see which other data points are associated or excluded, without writing SQL or pre-building hierarchies.
Semantic Layer: A semantic layer is an abstraction between raw database tables and end-user analytics interfaces that translates technical data structures into business-friendly terms (e.g., converting a “txn_amt” column into “Revenue”). A well-governed semantic layer ensures that every user querying “Revenue” in a BI tool gets the same calculated value, regardless of which dashboard or report they use. Looker’s LookML, Power BI’s datasets, and Qlik’s data models are all implementations of semantic layer architecture.
Embedded Analytics: Embedded analytics refers to the integration of BI dashboards, visualizations, or query capabilities directly into a third-party software product (such as a CRM, ERP, or SaaS application) so that end users receive analytics inside the workflow they already use rather than in a separate BI tool. Sisense is the primary embedded analytics specialist in this comparison; other platforms offer embedding capabilities but are not purpose-built for OEM product deployment.
True Total Cost of Ownership (TCO): True TCO in a BI platform context includes all costs incurred over a multi-year deployment period beyond base licensing: implementation services, training, data connector licensing, cloud compute and storage, API overage charges, internal data engineering labor, and renewal pricing escalation. Independent TCO analysis (Kanerika, 2025) estimates that true 3-year TCO for 250 users ranges from $193,000–$365,000 for Power BI to $740,000–$1.45M for Domo, a gap that is entirely invisible when comparing base licensing rates alone.
Which Business Intelligence Platform Is Right for You?
Key Insights
- Microsoft Power BI is the highest-value BI platform for Microsoft 365 organizations (offering Gartner Leader-tier visualization at a per-user price point no other platform in this comparison can match) but requires careful governance architecture to avoid dataset sprawl at enterprise scale.
- Tableau remains the strongest platform for organizations where visualization expressiveness and deep statistical analysis are primary requirements, with the caveat that its Salesforce integration trajectory is a long-term consideration for buyers outside the Salesforce ecosystem.
- Qlik Sense’s associative QIX engine provides genuinely differentiated exploratory analytics capability for complex, multi-source data environments, and the Talend acquisition makes Qlik a credible end-to-end data integration and analytics stack for organizations willing to invest in implementation depth.
- Looker is the right platform for organizations that want a version-controlled, governed semantic layer at enterprise scale, but only for organizations with the engineering team and budget ($300,000–$500,000+) to build and maintain LookML definitions at production depth.
- ThoughtSpot is the most accessible natural language analytics platform in this comparison for non-technical business users, and its 2025 Gartner Magic Quadrant Leader recognition validates its maturation from niche search-BI tool to enterprise analytics platform.
- Sisense is purpose-built for software companies and ISVs embedding analytics inside their own products (and is a poor fit for organizations seeking conventional self-service BI) but the Medallia acquisition introduces roadmap uncertainty that buyers should investigate before committing at scale.
- Domo’s real-time connector breadth is unmatched in this comparison, but its consumption-based pricing model, going-private ownership transition (February 2026), and estimated 3-year TCO of $740,000–$1.45M for 250 users make it the highest-cost and highest-risk platform evaluated here.
No single platform dominates every criterion. The right choice depends on your primary use case, your technical team’s capacity, your existing technology stack, and your willingness to accept pricing uncertainty in exchange for specific capabilities. Organizations with genuine uncertainty after reading this guide should request POC environments from their top two candidates and evaluate both using their own production data, not vendor demo datasets.
We update this guide quarterly to reflect new analyst reports, pricing changes, ownership developments, and practitioner community evidence. Last updated: May 2026.
For independent evaluations of adjacent enterprise software categories (CRM, data pipeline tools, and marketing analytics platforms) visit PlugRoute.