GoodData is the best overall embedded BI platform for multi-tenant ISV architecture, Sigma Computing is best for fastest Snowflake, BigQuery, or Redshift deployment with unlimited viewer pricing, and Power BI Embedded is best for Microsoft Azure ecosystem teams. Purpose-built embedded platforms outperform adapted enterprise BI tools on multi-tenant security, ISV-scale pricing, and native embedding architecture.
Pricing surprises discovered during implementation (not evaluation) have derailed documented embedded BI projects. Per-viewer licensing compounds to margin-destructive levels at scale: 300 external viewers generate $54,000 per year in Tableau viewer licensing at standard list rates. iFrame-dominant platforms create analytics experiences that practitioners describe as a “foreign object” dropped into the host application rather than native analytics.
As one user on r/analytics described:
“In the case of the series B/b2b SaaS startup it definitely made sense. We’d already built analytics in-house (it was actually pretty good) and it worked great when we only had small customers. As we continued to be successful & move up market to mid-market and a handful of real enterprise customers, it just wasn’t good enough (customers wanted much more data, much more granularity of data/metrics, and had more specific reporting requirements that didn’t necessarily overlap with other customers).” Posted by u/rawman650
Takeaway: B2B SaaS teams consistently discover that homegrown analytics sufficient for small customers become a liability at enterprise scale, the inflection point at which a purpose-built embedded BI platform transitions from optional to operationally necessary.
PlugRoute has no affiliate relationships with any company listed in this article, rankings are determined entirely by research data, practitioner community evidence, and objective evaluation criteria, with no vendor receiving preferential treatment.
TL;DR: What Are the Top Embedded BI Platforms to Consider in 2026?
- GoodData ranks first for its purpose-built headless architecture, workspace-based pricing with no per-user fees for external viewers, and native Web Component embedding that eliminates iFrame constraints.
- Sigma Computing ranks second for the fastest documented deployment (POC in hours to days) and an unlimited viewer model that does not compound licensing costs at external user scale.
- Power BI Embedded ranks third for Azure-committed ISVs needing 1,000+ connectors, enterprise compliance certifications, and Copilot AI within capacity-based pricing.
- Sisense ranks fourth as the only major commercial platform in this evaluation with confirmed on-premises and hybrid deployment alongside code-first Compose SDK embedding and bring-your-own-LLM AI integration.
What Are the Four Types of Embedded BI Platforms?
The four embedded BI platform types are iFrame-Based (Power BI Embedded, Tableau, Domo), SDK-Based (Sigma Computing, Sisense), Headless/Composable (GoodData), and Ecosystem-Native (Looker within Google Cloud, Tableau within Salesforce). Each type predicts production behavior more accurately than any feature checklist, specifically CSS customization depth, SSO passthrough capability, event interception, and browser cookie policy compatibility.
iFrame-Based Embedded BI (Power BI Embedded, Tableau, Domo) renders analytics as a contained page inside a browser frame.
iFrame embedding is the fastest to prototype but creates CSS isolation barriers, browser cookie policy vulnerabilities, and an experience practitioners describe as a “foreign object” dropped into the host application rather than native analytics.
SDK-Based Embedded BI (Sigma Computing, Sisense) adds a JavaScript SDK layer, React, Angular, or Vue.js, that enables programmatic event handling, filter control, and deeper UX integration than iFrame alone.
SDK platforms typically offer iFrame as a starting point, with SDK escalation available for teams investing more engineering effort into the embedded experience.
Headless/Composable Embedded BI (GoodData) fully decouples the analytics backend (semantic layer, metrics engine, and data access rules) from any prescribed frontend.
ISVs use REST APIs, Web Components, or React SDK to build the embedded experience within their own application’s design system. Web Components render inside the host application’s DOM without iFrame isolation, enabling CSS-level control unavailable through iFrame approaches.
Ecosystem-Native Embedded BI (Looker within Google Cloud, Tableau within Salesforce) is optimized for a specific cloud or CRM ecosystem.
These platforms deliver their strongest performance (tightest auth, deepest AI integration, most native data access) when operating inside their target ecosystem, and diminish significantly outside it.
The platform’s architecture type predicts the ceiling of frontend customization, the floor of deployment complexity, and the direction of long-term vendor lock-in risk, making it the most useful first filter in any embedded BI evaluation before feature comparison begins. A platform in the wrong architectural category cannot be feature-upgraded into the right one.
How Do the Top 7 Embedded BI Platforms Compare?
The seven embedded BI platforms in this evaluation differ most significantly on three dimensions: embedding method (iFrame vs. SDK vs. Web Components), pricing model (per-viewer vs. capacity-based vs. workspace-based), and multi-tenant architecture (purpose-built vs. engineered workaround). The comparison table below organizes these differences across eight dimensions for side-by-side selection.
| Rank | Company | Category | Best For | One-Line Summary | Key Capabilities | Primary Strength | Key Limitation |
|---|---|---|---|---|---|---|---|
| 1 | GoodData | Headless/Composable | Multi-tenant ISVs; no per-user pricing at scale | Purpose-built headless architecture, workspace-based pricing, native Web Component embedding that eliminates iFrame constraints | Web Components, React SDK, REST API, iFrame | Workspace hierarchy multi-tenancy + non-per-user pricing | MAQL setup investment; smaller chart library than Tableau or Power BI |
| 2 | Sigma Computing | Live-Query Embedded BI | Fastest deployment; Snowflake/BigQuery/Redshift teams | Fastest time-to-embed with practitioner-confirmed POC in hours to days; unlimited viewer pricing model | React Embed SDK, iFrame (JWT-signed) | Fastest documented deployment + unlimited viewer model | Snowflake-centric architecture; $100K+ for full embedded config |
| 3 | Power BI Embedded | Ecosystem-Native (Azure) | Microsoft Azure ecosystem ISVs | Azure-committed ISVs get 1,000+ connectors, enterprise compliance certifications, Copilot AI, and capacity-based pricing | iFrame (App Owns Data), powerbi-client JS | 1,000+ connectors + GDPR/HIPAA/ISO 27001 compliance + Copilot AI | Azure lock-in; highest authentication setup complexity in this evaluation |
| 4 | Sisense | API-First Embedded BI | Regulated industries; on-premises required | Compose SDK embedding across React, Angular, Vue.js; on-premises and hybrid deployment; BYOLLM AI integration | Compose SDK (React/Angular/Vue), Sisense.js, iFrame, REST API | On-premises deployment + Compose SDK + BYOLLM AI | Scale/enterprise tier remains custom-quoted; K1 PE ownership uncertainty |
| 5 | Looker | Semantic-Layer Embedded BI | Google Cloud/BigQuery teams; small external viewer counts | Strongest LookML semantic governance in this evaluation; per-viewer pricing limits ISV viability at any meaningful scale | Embed SDK, signed URLs, cookieless iFrame (v22.20+) | LookML semantic governance + Gemini Conversational Analytics | ~$400/viewer/year; GCP lock-in; notorious LookML learning curve |
| 6 | Tableau Embedded Analytics | Visualization-First Embedded BI | Salesforce ecosystem ISVs; small external viewer count | Broadest native chart library in this evaluation; per-viewer pricing becomes untenable above a few hundred external users | Embedding SDK v3, iFrame, Connected Apps JWT (Salesforce) | Richest chart library + Einstein AI + Salesforce Flow agentic integration | Per-viewer pricing at scale; post-acquisition vendor relationship risk |
| 7 | Domo (Domo Everywhere) | All-in-One Embedded BI | Existing Domo internal BI customers evaluating extension; not greenfield ISV selection | All-in-one platform extension to external analytics; credit billing unpredictability and not-purpose-built multi-tenancy limit ISV viability | iFrame + JavaScript API (pfilters) | 1,000+ connectors + Magic ETL for non-technical users | Credit billing unpredictability (verified £15,000 POC surprise); not purpose-built for ISV multi-tenancy |
Note on G2 ratings: Platform-wide estimates across all use cases, no product-specific embedded analytics rating is available for most platforms on G2. Treat all ratings as directional estimates. All pricing figures are practitioner-reported estimates or published list prices; verify current rates directly with vendors before budgeting. Verified May 2026.
Which Embedded BI Platform Should I Choose for My Use Case?
The fastest path to a platform decision is identifying your single most important constraint. For most ISV product teams, the deciding constraint is one of three: time-to-production (Sigma Computing leads), multi-tenant architecture quality and pricing predictability at scale (GoodData leads), or existing cloud ecosystem commitment (Power BI, Looker, or Tableau depending on stack). The framework below maps nine specific priorities to the recommended platform with a one-line rationale.
| Your #1 Priority | Recommended Platform | Why | Acceptable Alternative |
|---|---|---|---|
| Fastest deployment to production | Sigma Computing | Practitioner-ranked #1 for speed: POC in hours to days, production in 1–2 weeks | Power BI Embedded (if Azure-committed) |
| Largest external viewer count with unlimited pricing | Sigma Computing | Unlimited viewer model; external users not separately licensed | GoodData (workspace-based, no per-user fees) |
| Microsoft Azure ecosystem integration | Power BI Embedded | Azure AD, Fabric, Copilot AI, 1,000+ connectors natively | N/A; no close equivalent for Azure-first teams |
| Regulated industry or on-premises required | Sisense | Only major commercial platform with confirmed on-premises/hybrid deployment | GoodData (private cloud / self-hosted available) |
| Strongest semantic layer governance | Looker | LookML centralizes business logic across all embedded deployments | GoodData (MAQL semantic layer + analytics-as-code) |
| Salesforce CRM-native analytics | Tableau Embedded Analytics | Connected Apps JWT + Einstein AI + Salesforce Flow agentic workflows | N/A; no close equivalent for deep Salesforce embedding |
| Lowest billing predictability risk | GoodData | Workspace-based pricing; no per-user fees; no credit model surprises | Sigma Computing (unlimited viewers; warehouse compute costs separate) |
| Open-source / budget-constrained evaluation | Metabase (not evaluated in this article) | Enterprise tier starts at approximately $15,000/year; embedded SDK available; requires independent evaluation and DevOps investment for enterprise-grade embedding | Apache Superset (open-source; higher self-hosting investment) |
| First-time embedded analytics, no existing BI stack | GoodData (free developer tier) or Sigma Computing | Both offer free evaluation tiers without sales engagement; lowest-friction starting points for greenfield evaluation before pricing conversations begin | Metabase Community (free tier; limited embedded features) |
How Per-Viewer Pricing Scales at ISV Viewer Counts (Platforms That Charge Per Viewer)
The table below makes the per-viewer cost compounding immediately visible, without requiring readers to synthesize figures from individual entries. Viewer licensing costs only; platform base fees are additional.
| Platform | 100 Viewers/Year | 500 Viewers/Year | 1,000 Viewers/Year |
|---|---|---|---|
| Looker | ~$40,000 | ~$200,000 | ~$400,000 |
| Tableau (standard rates) | ~$18,000 | ~$90,000 | ~$180,000 |
| Tableau (ISV-negotiated rates) | ~$6,000–$12,000 | ~$30,000–$60,000 | ~$60,000–$120,000 |
| GoodData | Workspace cost; not viewer-based; same cost at 10 or 10,000 viewers | Same | Same |
| Sigma Computing | Same platform cost at any viewer count; warehouse compute scales separately | Same | Same |
Pricing figures are practitioner-reported estimates verified May 2026. Per-viewer costs do not include platform base fees. Verify all figures directly with vendors before budgeting.
What Are the 7 Best Embedded Business Intelligence Software Platforms in 2026?
Seven platforms earned a place in this evaluation: GoodData, Sigma Computing, Power BI Embedded, Sisense, Looker, Tableau Embedded Analytics, and Domo (Domo Everywhere). Rankings reflect a 100-point weighted score across six criteria, embedded architecture (20 pts), multi-tenant security (20 pts), pricing model sustainability (20 pts), white-labeling depth (13 pts), developer experience (13 pts), and vendor stability (13 pts). No single platform is the correct choice for every team, conditional rankings are noted for ecosystem-committed buyers.
1. GoodData: Best Overall: Purpose-Built Multi-Tenant ISV Embedding
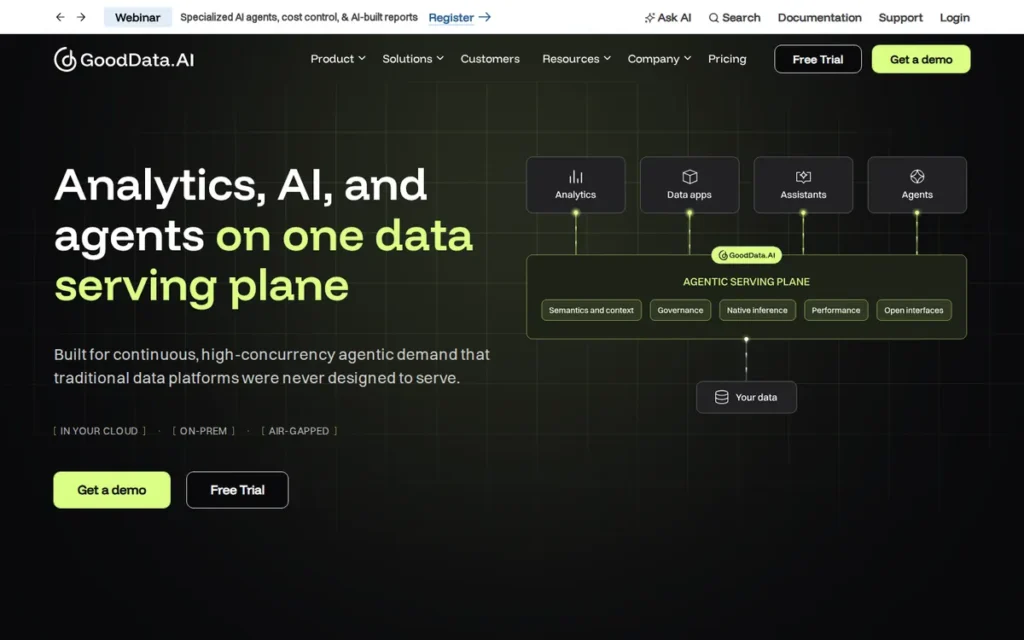
Category: Headless/Composable Embedded BI, an API-first analytics platform (also called composable analytics or API-first BI) that separates the analytics backend from any prescribed frontend, enabling SaaS product teams to embed analytics using React SDK, Web Components, REST API, or iFrame without being locked to GoodData’s visual framework.
At a Glance
| Field | Detail |
|---|---|
| Category | Headless/Composable Embedded BI |
| Best For | SaaS product teams requiring purpose-built multi-tenant data isolation at the data model layer, no per-user pricing at external viewer scale, and full frontend architecture freedom; particularly regulated industries, engineering-first organizations managing analytics as code, and ISVs with 500+ external users where per-viewer pricing becomes prohibitive |
| Price Range | Professional plan from approximately $300/month base + $30/workspace/month (approximately $1,000–$1,500/month for 10–40 tenant workspaces; unlimited users, full embedding, white-labeling, and SSO included). Enterprise plan is custom-quoted for advanced security, dedicated SLA, and AI query expansion. Self-hosted deployment on AWS or private cloud available. Free developer tier for evaluation; no sales engagement required. Verified May 2026 via GoodData pricing page. |
| Primary Strength | GoodData is the only platform in this evaluation with a native Web Component embedding model that eliminates iFrame constraints and a parent/child workspace hierarchy purpose-built for multi-tenant ISV architectures at scale |
| Biggest Limitation | GoodData requires meaningful upfront investment in MAQL semantic modeling and Logical Data Model configuration before any analytics can be surfaced in the embedded product; a learning curve practitioners describe as steeper than drag-and-drop alternatives |
| One-Line Summary | GoodData is the only embedded BI platform in this evaluation with a purpose-built headless architecture, workspace-based pricing that scales without per-user fees, and native Web Component embedding that eliminates iFrame constraints for SaaS product teams building customer-facing analytics. |
| Last Verified | May 2026 |
Overview
GoodData is a headless, composable embedded BI platform (also called a composable analytics or API-first BI platform) built for SaaS companies and ISVs delivering customer-facing analytics at scale. GoodData offers Web Component embedding without iFrames, a parent/child workspace hierarchy that enforces tenant data isolation natively, and workspace-based pricing with no per-user fees for external viewers.
GoodData separates the analytics backend (governed by MAQL semantic metrics and a Logical Data Model) from the frontend presentation layer. Product teams can build embedded analytics using React SDK, Web Components, REST API, or iFrame without being constrained by GoodData’s own visualization framework, and can manage all analytics objects as version-controlled Git artifacts within standard CI/CD workflows.
GoodData’s Professional plan starts at approximately $300/month plus $30/workspace/month, with full embedding, white-labeling, and SSO included at the published tier. GoodData’s workspace-based model, with no per-user fees for external viewers, directly solves the scaling cost problem that practitioners document as making Looker and Tableau unviable for ISV embedding at meaningful customer scale.
Key Features
- Web Component Embedding Without iFrames: GoodData provides Web Component embedding that renders analytics natively inside the host application’s DOM, enabling CSS-level styling control, event interception, and responsive layout integration that iFrame-based platforms architecturally cannot match.
- Parent/Child Workspace Hierarchy: GoodData’s multi-tenant architecture automatically cascades analytics configuration, branding, and metric definitions from a master workspace template to individual tenant workspaces, reducing new customer tenant provisioning from hours of manual configuration to minutes of automated inheritance.
- Analytics-as-Code with Git/CI-CD Integration: GoodData’s Analytics-as-Code framework (also called BI as code) manages all dashboards, metrics, data models, and configurations as version-controlled Git artifacts, enabling CI/CD pipeline integration, staging-to-production promotion, and full rollback capability for analytics deployments.
- Semantic-Layer AI Assistant: GoodData’s AI assistant queries the governed MAQL semantic layer using metadata-only API calls, enabling natural language analytics against governed business-term definitions rather than raw SQL column names, preventing LLM hallucination and raw schema exposure.
- FlexQuery Caching for TCO Optimization: GoodData’s FlexQuery caching layer reduces cloud data warehouse compute costs by serving frequently requested dashboard queries from cache rather than re-executing against the warehouse, a direct TCO optimization for ISVs with high embedded query volume.
Best For
GoodData is best for SaaS product teams with developer resources building customer-facing analytics at scale, particularly teams with 500+ external users where per-user pricing becomes prohibitive, teams in regulated industries requiring on-premises or private cloud deployment, and engineering-first teams that want to manage analytics as versioned code within their existing DevOps workflows.
Pricing
GoodData publishes a Professional plan at approximately $300/month base plus $30/workspace/month. For a deployment with 10–40 tenant workspaces, this equates to approximately $1,000–$1,500/month, with unlimited users, full embedding, white-labeling, and SSO included at the Professional tier.
Enterprise plan pricing is custom-quoted for advanced security requirements, dedicated SLA, AI query expansion, and larger data volumes. Self-hosted deployment on AWS or private cloud is available and may reduce infrastructure costs relative to GoodData-managed cloud. A free developer tier is available for evaluation without a sales engagement. Verified May 2026 via GoodData pricing page.
Strengths
- GoodData’s workspace hierarchy multi-tenancy is confirmed in GoodData embedded analytics product documentation (GoodData, May 2026) as a purpose-built architecture (not an engineered workaround) with parent workspace analytics cascading to tenant workspaces automatically; independent community practitioners specifically cited GoodData for large-dataset, high-viewer-count ISV scenarios: “Have you checked GoodData? They can handle large data sizes and they do not have user based pricing” (u/hank1321, r/BusinessIntelligence, originally posted 2021; cited in 2025–2026 embedded analytics practitioner evaluation discussions as still-relevant guidance on GoodData’s non-per-user pricing model).
Takeaway: GoodData is recommended by practitioners specifically for large-dataset, high-viewer-count ISV deployments where per-user pricing on competing platforms becomes economically prohibitive.
- GoodData’s Web Component embedding model: the only native Web Component approach among the seven platforms evaluated, is confirmed via GoodData product documentation (May 2026) as enabling pixel-perfect, CSS-accessible analytics integration; this represents the highest documented level of frontend integration control among the seven platforms in this evaluation, described by practitioners in 2025–2026 discussions as the current ceiling for customer-facing analytics that feel architecturally native rather than visually embedded.
- GoodData’s Analytics-as-Code architecture, confirmed via GoodData product documentation (May 2026), enables Git version control, CI/CD pipeline integration, and staging-to-production environment promotion, a developer workflow capability not documented at this level of Git/CI-CD integration depth in product materials for any other platform in this evaluation, directly addressing the analytics sprawl problem practitioners document as a scaling risk in mature deployments.
- GoodData’s AI assistant is confirmed to query the governed MAQL semantic layer using metadata-only API calls, a privacy-preserving architecture that prevents raw SQL schema exposure to external LLMs, contrasting with approaches that send full database schema to AI systems (GoodData AI product documentation, May 2026).
Limitations
- Deployment Speed vs. Architecture Freedom: GoodData’s headless, API-first design that gives product teams maximum frontend control requires meaningful upfront investment in MAQL semantic modeling and Logical Data Model configuration before any analytics can be surfaced in the embedded product. GoodData’s setup commitment is difficult to restructure once the data model is in production.
- Visualization Library Scope: GoodData’s native chart catalog is less extensive than Tableau’s or Power BI’s out-of-the-box library, teams requiring sophisticated chart variety will need to extend GoodData’s visualization library or accept a narrower initial set before further customization.
- Community Footprint: GoodData has approximately 200 G2 reviews compared to 2,500+ for Power BI, teams without prior headless BI experience face a more isolated onboarding path than on higher-volume platforms, with fewer third-party tutorials and community answers available at implementation time.
- AI Marketing Skepticism: GoodData’s agentic AI marketing positioning generated explicit skepticism in r/dataengineering evaluation discussions (u/wmru5wfMv, October 2025), suggesting the AI marketing framing may create initial credibility friction in engineering-led procurement contexts, even though the underlying semantic-layer AI architecture is technically sound.
Verdict
GoodData earned the #1 ranking in this evaluation by scoring highest across all three primary weighted criteria simultaneously (embedded-first architecture (headless, Web Components), multi-tenant security (purpose-built workspace hierarchy), and pricing model sustainability (no per-user fees at viewer scale)) the only platform in this evaluation to lead on all three criteria without a disqualifying trade-off. GoodData’s combination of workspace-hierarchy multi-tenancy, non-per-user pricing, and Web Component embedding creates a technical and commercial foundation that purpose-built embedded analytics demands and that adapted enterprise BI platforms cannot replicate without significant engineering workarounds. Teams with less developer capacity or tighter deployment timelines should weigh GoodData’s setup investment carefully against Sigma Computing’s faster time-to-production before making a final platform decision.
2. Sigma Computing: Best for Fastest Deployment: Snowflake, BigQuery, and Redshift Teams with Unlimited Viewer Pricing
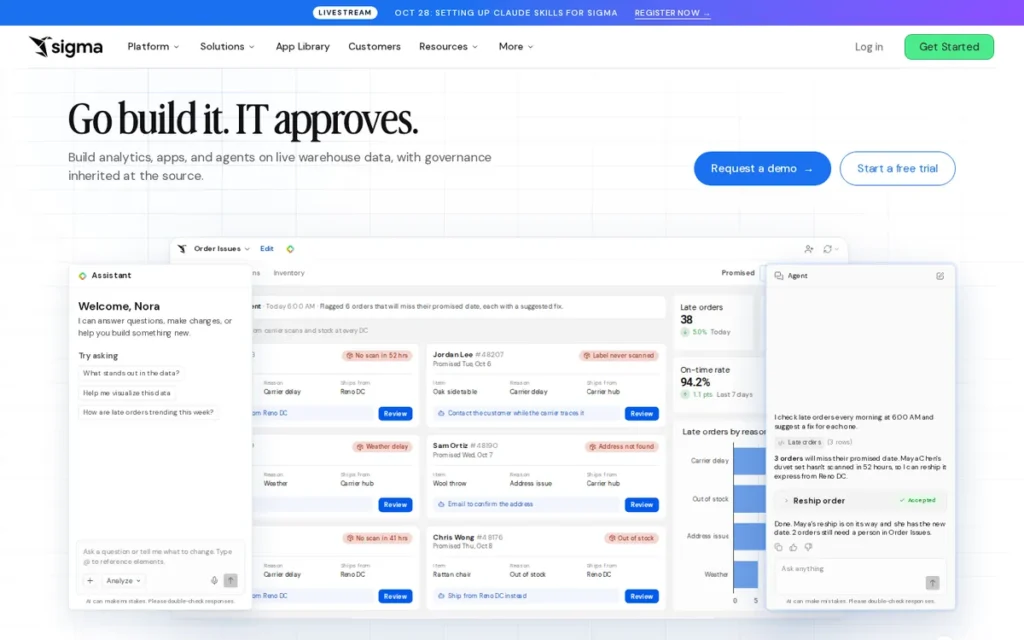
Category: Live-Query Embedded BI, a warehouse-native embedded analytics platform that queries live data directly from cloud data warehouses (Snowflake, BigQuery, Redshift) at query time without data movement, ETL replication, or scheduled refresh cycles, presenting current warehouse data through a spreadsheet-native interface embedded in SaaS applications via React SDK or single-URL iFrame.
At a Glance
| Field | Detail |
|---|---|
| Category | Live-Query Embedded BI |
| Best For | SaaS product teams on Snowflake, BigQuery, or Redshift who need the fastest path to production embedded analytics, an unlimited viewer pricing model that does not compound at external user scale, and a self-service analytics experience that business user end customers can adopt without dedicated BI training |
| Price Range | No public list price. Median annual contract value: approximately $60,500 across all Sigma deployments (Vendr, 109+ analyzed deals, 2025). Enterprise embedded analytics with full white-labeling, multi-tenancy, and API access: approximately $100,000–$400,000+/year (Vendr, Qrvey, 2025). Unlimited viewer model; external end users not separately licensed. Warehouse compute costs (Snowflake/BigQuery/Redshift) scale with query volume and must be factored into TCO separately. Verified May 2026. |
| Primary Strength | Sigma Computing delivers the fastest documented time-to-production embedded analytics deployment in this evaluation; with practitioner-confirmed POC timelines of hours to days; and an unlimited viewer pricing model that does not compound licensing costs as external user count grows |
| Biggest Limitation | Sigma Computing’s architecture is primarily optimized for Snowflake, BigQuery, and Redshift, and the spreadsheet-first embedded UX can feel more like a self-service spreadsheet engine than a tightly branded, opinionated analytics product within the ISV’s host application |
| One-Line Summary | Sigma Computing delivers the fastest time-to-embed in this evaluation; with practitioner-documented POC timelines of hours to days; through a spreadsheet-native interface that queries live cloud warehouse data without data movement, and an unlimited viewer pricing model that does not compound costs as external user scale grows. |
| Last Verified | May 2026 |
Overview
Sigma Computing is a live-query embedded BI platform built on cloud data warehouses (querying Snowflake, BigQuery, and Redshift directly without data movement, ETL replication, or scheduled refresh cycles) presenting that data through a spreadsheet-native interface that product teams embed in SaaS applications via React SDK or single-URL iFrame. Sigma Computing earned the highest estimated G2 rating (approximately 4.6/5.0 across 500+ reviews) in this evaluation and Forrester-published economic impact validation for its embedded analytics capabilities.
Sigma Computing’s unlimited viewer pricing model (where external end users are not separately licensed) directly addresses the per-viewer cost compounding problem that practitioners document as making Tableau and Looker unviable at ISV scale. Sigma Computing is backed by Snowflake Ventures, D1 Capital Partners, and Sutter Hill Ventures, with a deep partnership integration with Snowflake’s data cloud that creates architectural advantages for Snowflake-first data stacks and a dependency risk for teams not committed to that ecosystem.
Key Features
- Live Warehouse Querying Without Data Movement: Sigma Computing queries live cloud data warehouse data (Snowflake, BigQuery, Redshift) at query time without ETL replication or scheduled refresh, ensuring embedded dashboards always display current warehouse state rather than a cached or refresh-lagged snapshot.
- React Embed SDK Plus Zero-SDK iFrame Option: Sigma Computing’s React Embed SDK enables programmatic event handling, filter control, and cross-origin communication between host application and embedded analytics, while the single-URL iFrame option enables zero-SDK deployment for teams prioritizing speed, providing a progressive embedding investment path without platform switching.
- Explore Mode for End-User Self-Service: Sigma Computing’s Explore Mode within embedded analytics allows end users to add columns, create calculations, and build ad hoc analyses within the embedded experience, a self-service capability that ISV product managers have cited as driving customer stickiness and reducing analytics-related support requests.
- Runtime Embed Parameter Security: Sigma Computing enforces row-level security through runtime embed parameters that pass the host application’s user authentication and permission context to Sigma at session time, meaning tenant data isolation is governed by the ISV’s own auth infrastructure rather than requiring a separate Sigma user management layer.
- Write-Back Capability for Operational Workflows: Sigma Computing supports write-back capability allowing embedded users to enter or modify data directly in the data warehouse through the analytics interface, enabling scenario planning, operational data entry, and data collection use cases that read-only embedded dashboards cannot support.
Best For
Sigma Computing is best for SaaS product teams with data stacks built on Snowflake, BigQuery, or Redshift that need the fastest time-to-production embedded analytics deployment and an unlimited viewer pricing model, particularly ISVs with large external user bases (500+ users) where per-viewer licensing models become margin-destructive, and whose end customers are business users familiar with spreadsheet interfaces who need self-service analytics without formal BI training.
Pricing
Sigma Computing does not publish list pricing. Median annual contract value across all Sigma deployments is approximately $60,500 (Vendr, 109+ analyzed deals, 2025), reflecting basic and mid-tier configurations across all Sigma use cases.
Enterprise embedded analytics deployments with full custom white-labeling, multi-tenancy, and API access are reported to start at approximately $100,000/year, with scaled deployments reaching $250,000–$400,000+ annually (Vendr, Qrvey, 2025). One practitioner-documented basic configuration: approximately $60,000/year for approximately 20GB data, 5 dashboards, and writeback capability (u/vmih_, r/BusinessIntelligence, April 2026, corroborated by u/IrishHog09). Sigma Computing’s unlimited viewer model means external user volume does not affect Sigma’s licensing cost, but warehouse compute costs billed separately by Snowflake, BigQuery, or Redshift scale with embedded query volume and must be included in total cost of ownership calculations. Verified May 2026.
Strengths
- A Forrester-published economic impact analysis for Sigma Computing’s embedded analytics (source: tei.forrester.com/go/sigma/SigmaComputingTEISpotlight, independently verify current availability before citing externally) found customers reported “quicker turnaround times that delighted end-users compared to other BI tools,” with Erin Benotti, Principal Product Manager at Built Technologies, stating: “Sigma is really unique in the fact that we can embed this product within our entire application and then enable customers to build their own reports.”
- Sigma Computing earned the fastest-to-deploy ranking among seven embedded BI platforms in an April 2026 practitioner-authored comparative analysis based on direct implementation experience: “Fastest to deploy: Sigma. Single URL iframe embedding, no custom SDK required, keep your existing auth. Customer reports consistently describe POC in hours to days and production in 1–2 weeks” (u/TalkToMeNerdy, r/BusinessIntelligence, April 2026).
Takeaway: Sigma Computing’s deployment speed advantage is practitioner-ranked and structurally grounded in its no-data-movement architecture, not a vendor marketing claim but a documented implementation pattern from direct practitioner experience.
- Sigma Computing’s estimated G2 rating of approximately 4.6/5.0 across 500+ reviews is the highest among the seven platforms evaluated, reflecting consistent user satisfaction with deployment speed, spreadsheet-native UX, and live warehouse querying architecture (G2 directional platform-wide estimate, May 2026).
- Sigma Computing’s unlimited viewer pricing model is confirmed in product documentation (external users accessing embedded dashboards are not separately licensed) enabling predictable per-deployment costs that do not scale with external user growth (Sigma product documentation, May 2026; r/BusinessIntelligence, April 2026).
Users on r/BusinessIntelligence shared their evaluation experience:
“I’d recommend Sigma Computing. We evaluated all the major players (PowerBI, Tableau, Looker, and even a build), and Sigma won hands down. We were able to launch in a month with 2 people. Our customers love it” Posted by u/Impressive-Buyer-766
Takeaway: Sigma Computing’s competitive win rate in direct evaluations against Power BI, Tableau, Looker, and in-house builds is consistently anchored to its deployment speed, not feature breadth or brand recognition.
Limitations
- Ecosystem Specificity vs. Deployment Flexibility: Sigma Computing’s live-warehouse-querying architecture that makes Sigma fast to deploy and always current in data freshness also means Sigma’s value proposition is maximized for Snowflake, BigQuery, and Redshift data stacks, and diminishes for organizations on other data platforms, a structural constraint that teams not already committed to these warehouses must weigh explicitly before committing to Sigma.
- Spreadsheet UX vs. Branded Product Goals: Sigma Computing’s spreadsheet-first embedded UX can feel more like giving customers a self-service spreadsheet engine than delivering a tightly branded analytics product, practitioners note “if your goal is customer-facing analytics that feel like part of your product, especially with multi-tenant setups, [it may be] easier to control what users see vs. letting them build everything” (u/Feisty-Donut-5546, r/BusinessIntelligence, March 2026).
Takeaway: Sigma’s spreadsheet-native UX optimizes for end-user self-service, which can conflict with ISV goals of delivering a controlled, tightly branded analytics experience within a host product.
- Enterprise Cost Floor: Enterprise embedded analytics configurations with full white-labeling, multi-tenancy, and API access are reported to start at approximately $100,000/year, meaning teams building only a handful of embedded dashboards may find the annual commitment disproportionate to their initial deployment scope.
- Variable TCO: Sigma Computing’s live-query architecture shifts compute costs to the data warehouse bill, warehouse compute costs scale with embedded query volume and are harder to forecast than fixed-capacity pricing models, requiring teams to model query concurrency assumptions into their TCO projections before signing.
Verdict
Sigma Computing is the most directly supported choice for SaaS teams on Snowflake, BigQuery, or Redshift that prioritize the fastest time-to-production, an unlimited viewer pricing model that does not compound at external user scale, and a familiar spreadsheet-native experience for business user end customers, based on practitioner-documented deployment timelines and the unlimited viewer pricing model confirmed in platform documentation. Sigma Computing ranks second overall behind GoodData only on multi-tenant architecture purpose-build and pricing model breadth. Teams not operating Snowflake, BigQuery, or Redshift as their primary data warehouse should evaluate whether the live-query architecture’s warehouse compute cost scaling aligns with their TCO model before committing to Sigma Computing.
3. Power BI Embedded: Best for Microsoft Azure Ecosystem ISVs
Category: Ecosystem-Native Embedded BI, a Microsoft Azure-integrated embedded analytics platform extending Power BI’s internal reporting capabilities to external-facing SaaS applications through capacity-based licensing and the App Owns Data authentication model, backed by Microsoft’s enterprise security compliance infrastructure, Copilot AI, and 1,000+ data connector ecosystem.
At a Glance
| Field | Detail |
|---|---|
| Category | Ecosystem-Native Embedded BI |
| Best For | ISV and SaaS product teams already operating within the Microsoft Azure ecosystem; leveraging Azure AD, Azure SQL, Dynamics 365, or Microsoft Fabric; who need enterprise compliance certifications, the broadest documented data connector library in this evaluation, and capacity-based pricing that scales without per-viewer licensing fees for external user access |
| Price Range | Capacity-based. Azure A-SKUs from approximately $625–$735/month for A1 node (varies by region and billing type; verify via Azure pricing calculator). Microsoft Fabric F-SKUs from approximately $150–$262/month for F2 node (reserved vs. pay-as-you-go). Critical: F2–F32 capacity tiers require Power BI Pro licenses (~$14/user/month) for internal consumer users; only F64+ waives this. Most production embedded workloads require F64 or higher for real concurrency. Power BI Pro licenses ($10/user/month) do NOT cover external embedding. Verified May 2026. |
| Primary Strength | Power BI Embedded provides over 1,000 data connectors, enterprise-grade GDPR/HIPAA/ISO 27001 compliance, Copilot AI, and Gartner Magic Quadrant Leader credentials within a capacity-based pricing model that eliminates per-viewer licensing fees for external-facing SaaS analytics |
| Biggest Limitation | Power BI Embedded’s iFrame-dominant rendering limits CSS-level customization of embedded dashboards, and the App Owns Data authentication model; requiring Entra ID service principal management, backend embed token generation, and DAX-based RLS; carries the highest documented production setup complexity of any platform in this evaluation |
| One-Line Summary | Power BI Embedded gives Microsoft Azure ecosystem ISVs over 1,000 data connectors, enterprise-grade GDPR/HIPAA/ISO 27001 compliance, Copilot AI, and capacity-based pricing that eliminates per-viewer licensing costs for external-facing SaaS analytics; at the cost of deep Azure infrastructure dependency and the most complex authentication setup in this evaluation. |
| Last Verified | May 2026 |
Overview
Power BI Embedded is Microsoft’s PaaS offering for ISVs and SaaS builders embedding Power BI reports, dashboards, and tiles into external-facing applications under the App Owns Data model (where the application manages authentication via service principals and end users never require a Microsoft login) backed by Microsoft’s Azure infrastructure, Gartner Magic Quadrant Leader recognition (2024), over 1,000 data connectors, and Copilot AI for natural language analytics within embedded contexts.
Power BI Embedded ranks third in this evaluation (behind GoodData’s purpose-built multi-tenancy and Sigma’s deployment speed advantage) due to its iFrame-dominant architecture and the highest production authentication complexity in this evaluation, both of which impose ISV-specific friction that purpose-built alternatives resolve architecturally rather than through configuration.
Power BI Embedded’s capacity-based A-SKU and F-SKU pricing models eliminate per-viewer licensing fees that make Tableau and Looker unviable at ISV external user scale, though production-grade workloads typically require F64 or higher capacity, with pricing implications practitioners document as a common project-scoping surprise.
Key Features
- App Owns Data Embedding Model: Power BI Embedded’s App Owns Data model enables ISVs to authenticate external users via Azure Active Directory service principals (so end customers never require a Power BI or Microsoft account) using backend-generated embed tokens that grant scoped, time-limited access to specific reports, dashboards, or tiles.
- 1,000+ Data Connectors: Power BI Embedded supports over 1,000 data connectors spanning SQL/NoSQL databases, Salesforce, Dynamics 365, Azure services, cloud storage, and SaaS APIs, the broadest documented data connector library among the seven platforms in this evaluation, confirmed via Microsoft Power BI documentation (May 2026).
- Copilot AI Integration: Power BI Embedded includes Copilot AI integration for natural language analytics, automated insights, and AI-generated data summaries within embedded dashboards, leveraging Microsoft’s Azure OpenAI investment to bring conversational analytics to customer-facing SaaS applications.
- DAX-Based Row-Level Security: Power BI Embedded enforces row-level security at the semantic model layer using DAX-based security filters that map user identity attributes to data access rules, enabling multi-tenant data isolation within a shared embedded deployment when properly configured through service principal management.
- Microsoft Fabric F-SKU Integration: Power BI Embedded’s Microsoft Fabric F-SKU integration unifies embedded BI capacity with OneLake data storage and Fabric workloads, providing ISVs operating a Microsoft Fabric-based data stack with a single capacity purchase covering embedded analytics, storage, and compute.
Best For
Power BI Embedded is best for ISV and SaaS product teams already committed to Microsoft Azure infrastructure (leveraging Azure AD, Azure SQL, Dynamics 365, or Microsoft Fabric) who need enterprise-grade compliance certifications, the broadest connector library, and Copilot AI within a capacity pricing model that scales without per-viewer fees, and whose procurement process benefits from Gartner Magic Quadrant Leader credibility with enterprise buying committees.
Pricing
Power BI Embedded uses capacity-based pricing, not per-user licensing for external viewers. Azure A-SKUs range from approximately $625–$735/month for the A1 node, varying by region and billing type, verify via the Azure pricing calculator before budgeting. Microsoft Fabric F-SKUs range from approximately $150–$262/month for F2 under reserved vs. pay-as-you-go billing.
Critical: F2–F32 Fabric capacity tiers require Power BI Pro licenses (approximately $14/user/month) for internal consumer users, only F64+ waives this requirement for all users. Power BI Pro licenses ($10/user/month) do NOT cover external user embedding, multiple practitioners describe this as the most commonly documented project-scoping surprise. ISVs must budget for a dedicated capacity tier (A-SKU or F-SKU) separate from any internal Pro/Premium licenses. Most production embedded workloads require F64 or higher capacity for real concurrency (u/TalkToMeNerdy, r/BusinessIntelligence, April 2026; r/PowerBI, November 2024). Verified May 2026.
Strengths
- Microsoft was placed as a Leader in the Gartner Magic Quadrant for Analytics and Business Intelligence Platforms in 2024, with one of the highest Completeness of Vision scores in the quadrant, translating to procurement credibility with enterprise buying committees that recognize and trust the Microsoft Power BI brand (Gartner Magic Quadrant for Analytics and BI Platforms, 2024, referenced in RevealBI comparative analysis, 2025).
- Power BI Embedded’s capacity-based pricing eliminates per-viewer licensing for external users (at the F-SKU or A-SKU tier, unlimited external customers can access embedded content without incremental per-seat cost) confirmed by Microsoft Learn documentation (May 2026) and validated by practitioners as the correct licensing configuration for large-scale ISV deployments.
- Power BI Embedded is backed by Microsoft’s reported $1 billion annual security investment (Microsoft-reported figure, cited in RevealBI comparative analysis, 2025) and carries GDPR, HIPAA, SOC 2 Type II, and ISO 27001 compliance certifications, the strongest documented enterprise security compliance posture of any platform in this evaluation.
- Power BI Embedded provides access to over 1,000 data connectors: spanning SQL/NoSQL databases, Salesforce, SAP, and all major cloud services, the broadest documented data connectivity library among the seven platforms in this evaluation, confirmed via Microsoft Power BI documentation (May 2026).
This aligns with community sentiment on r/BusinessIntelligence:
“I do Power BI Embedded dashboards with react, d3js and regular PBI. […] While App owns data is solid, it does require you to build in your own RLS. I create admin dashboards where you can define RLS level. (what pages a user will have access to, when slicer values they will have access to etc.) then I have global slicers on the report which are made via react components and I pass on the filters through Power BI REST API. You can make it look decent. Capacity pricing should also be factored in for sure. But with App Owns data, pricing is much more effective considering you’re not requiring licenses for viewers.” Posted by u/Typical_Tea_2664
Takeaway: Power BI Embedded’s capacity pricing is a genuine cost advantage for ISVs at scale, but realizing it requires custom RLS architecture and React/REST API integration work that practitioners describe as substantial hands-on engineering effort.
Limitations
- Azure Ecosystem Lock-In: Power BI Embedded’s deep dependency on Azure Active Directory (Entra ID), Azure capacity SKUs, and Microsoft’s licensing roadmap makes Power BI Embedded a difficult-to-exit commitment for ISVs that may evolve their cloud strategy, the same integration that provides enterprise compliance and 1,000+ connectors simultaneously creates a structural vendor lock-in that practitioners consistently flag as a first-filter evaluation question.
- App Owns Data Authentication Complexity: Power BI Embedded’s App Owns Data authentication model requires backend coordination of Entra ID service principals, embed token generation, and DAX-based RLS rules, practitioners with a decade of embedded BI experience describe it as “not impossibly hard, but it can be convoluted,” with “third-party cookie blocking and finicky service principal permissions” documented as recurring production hazards (u/TalkToMeNerdy, r/BusinessIntelligence, April 2026; corroborated by u/AmbitionEuphoric5600).
Takeaway: Power BI Embedded’s Microsoft ecosystem lock-in is a feature for Azure-native teams and a liability for teams operating across multi-cloud or vendor-neutral infrastructure.
- iFrame Rendering Ceiling: Power BI Embedded’s iFrame-dominant rendering model imposes a ceiling on CSS-level customization, embedded dashboards cannot be styled at the component level, limiting how natively analytics integrate into the host application’s design system compared to SDK or Web Component approaches.
- Capacity Tier Escalation Risk: Power BI Embedded’s entry-level F2 capacity is confirmed as insufficient for production embedded workloads, the jump to F64 carries significant cost implications that practitioners flag as a project-scoping conversation that must happen before any budget is set, and F2–F32 capacity tiers carry compounded Pro license costs for internal users.
Verdict
Power BI Embedded is the strongest embedded BI platform in this evaluation for ISVs committed to Microsoft Azure infrastructure, delivering unmatched connector breadth, Gartner Magic Quadrant-validated enterprise credibility, Copilot AI, and capacity pricing that scales without per-viewer fees. Teams should treat the Azure dependency as a first-filter question rather than an afterthought: Power BI Embedded is a compelling, high-credibility choice for Azure-committed product teams and a material strategic risk for teams that are infrastructure-agnostic or multi-cloud. The licensing model requires precise upfront scoping, Pro licenses do not cover external embedding, and production workloads require F64 or equivalent capacity with cost implications practitioners document as a frequent project-scoping failure.
4. Sisense: Best for Regulated Industries: On-Premises and Hybrid Deployment with Code-First Embedding
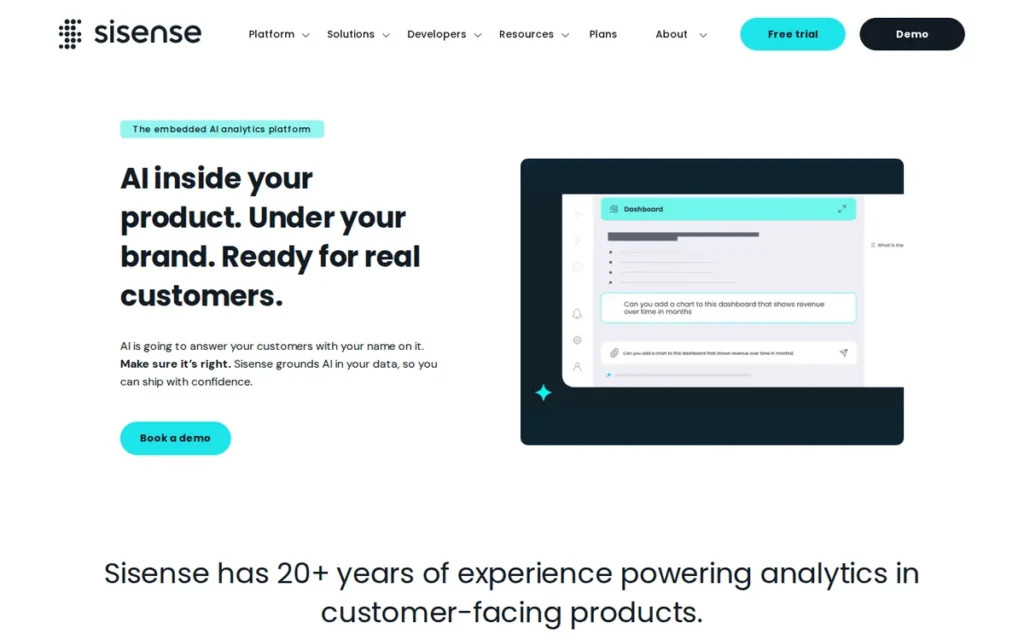
Category: API-First Embedded BI, a developer-focused embedded analytics platform built around the Compose SDK for code-level dashboard embedding in React, Angular, and Vue.js applications, with a progressive four-tier embedding model (iFrame, Sisense.js, Compose SDK, REST API) and on-premises, cloud-managed, and hybrid deployment options.
At a Glance
| Field | Detail |
|---|---|
| Category | API-First Embedded BI |
| Best For | ISVs in regulated industries (healthcare, financial services, government) requiring on-premises or hybrid deployment for data-residency compliance, and SaaS product teams that need code-level embedding customization via React, Angular, or Vue.js SDKs with bring-your-own-LLM AI integration for AI-native product development |
| Price Range | Published tiers: Launch at $399/month (basic embedding, 50 viewer seats, no white-labeling or SSO); Grow at $1,299/month (adds white-labeling, SSO, BYOLLM, multi-environment support). Scale tier; covering on-premises deployment, enterprise concurrency, and production ISV OEM configurations; is custom-quoted. Practitioner-reported production OEM range: $60,000–$137,000+/year for enterprise configurations (Embeddable.com, 2025; Improvado, 2025). Verified May 2026 via sisense.com/pricing. |
| Primary Strength | Sisense is the only platform in this evaluation supporting on-premises and hybrid deployment alongside a Compose SDK for code-first React, Angular, and Vue.js embedding; making it the strongest option for regulated-industry ISVs with data-residency requirements and developer-level customization needs |
| Biggest Limitation | Sisense’s Scale/enterprise tier pricing for production ISV OEM deployments remains custom-quoted and non-transparent, and K1 Investment Management private equity ownership introduces vendor stability uncertainty absent from the hyperscaler-backed competitors |
| One-Line Summary | Sisense is the only embedded BI platform in this evaluation that combines code-first Compose SDK embedding across React, Angular, and Vue.js with on-premises and hybrid deployment options and bring-your-own-LLM AI integration; making it the strongest match for regulated-industry ISVs with data-residency requirements and developer-level customization needs. |
| Last Verified | May 2026 |
Overview
Sisense is an API-first embedded analytics platform built around the Compose SDK, a developer toolkit for pixel-perfect, code-level dashboard embedding in React, Angular, and Vue.js, with support for four embedding tiers (iFrame, Sisense.js, Compose SDK, REST API), on-premises and hybrid deployment, an ElastiCube in-memory query engine, and bring-your-own-LLM AI integration that allows ISVs to use their own AI models rather than being locked into Sisense’s AI stack.
Sisense supports fully on-premises (Linux/Kubernetes self-hosted), cloud-managed, and hybrid deployment, the only major commercial platform in this evaluation offering true on-premises installation, a non-negotiable requirement for ISVs serving healthcare, financial services, or government markets with strict data locality mandates.
Sisense publishes entry-level tiers (Launch at $399/month, Grow at $1,299/month), with Scale/enterprise tier production OEM deployments remaining custom-quoted at $60,000–$137,000+/year for enterprise configurations.
Key Features
- Compose SDK for Code-First Embedding: Sisense’s Compose SDK enables code-first dashboard embedding with pixel-level control across React, Angular, and Vue.js, the most granular code-level developer-accessible embedding customization among the seven platforms evaluated, based on component-level control across three major JavaScript frameworks.
- Four-Tier Progressive Embedding Model: Sisense’s multi-tier embedding model provides a progressive customization path: teams can start with simple iFrame embedding, advance to Sisense.js low-code SDK, escalate to the full Compose SDK, or implement the REST API for maximum programmatic flexibility, without switching platforms as embedding depth requirements mature.
- On-Premises, Cloud, and Hybrid Deployment: Sisense supports on-premises (Linux/Kubernetes), cloud-managed, and hybrid deployment (the only major commercial platform in this evaluation with confirmed true on-premises installation capability (Sisense product documentation, May 2026)) meeting data-residency mandates for ISVs serving regulated industries.
- Bring-Your-Own-LLM (BYOLLM) AI Integration: Sisense’s BYOLLM support allows ISVs to integrate their own AI and language models into embedded analytics rather than depending on Sisense’s native AI stack, a strategic advantage for ISVs building AI-native SaaS products with existing proprietary model investments, confirmed via Sisense’s product blog (May 2026).
- ElastiCube In-Memory Query Engine: Sisense’s ElastiCube in-chip caching engine uses CPU memory bank (In-Chip) technology to compress datasets into memory-optimized columnar storage, delivering sub-second query responses across billions of rows without pre-aggregation and enabling high-performance ad hoc analytics in embedded scenarios where user query patterns cannot be predicted.
Best For
Sisense is best for ISVs in regulated industries (healthcare, financial services, government) where data-residency mandates, audit requirements, or contractual obligations require on-premises or hybrid deployment, and for engineering-first SaaS product teams that need code-level embedding customization beyond what iFrame-based platforms can provide, particularly those building AI-native analytics products with existing LLM investments they want to integrate.
Pricing
Sisense publishes two entry-level tiers: Launch at $399/month (basic embedding, 50 viewer seats, note: no white-labeling or SSO at this tier) and Grow at $1,299/month (adds white-labeling, SSO, BYOLLM, and multi-environment support). These published tiers do not cover production on-premises ISV embedded deployments.
Scale tier (covering on-premises deployment, enterprise concurrency, and production ISV OEM configurations) is custom-quoted. Practitioner-reported production OEM configurations range from $60,000–$137,000+/year for enterprise deployments (Embeddable.com, 2025; Improvado, 2025). This means the pricing conversation that matters most to embedded ISV buyers still requires a sales engagement for Scale-tier production deployments. Verified May 2026 via sisense.com/pricing.
Strengths
- Sisense’s Compose SDK capability, code-first, pixel-perfect React, Angular, and Vue.js embedding with full programmatic control, was noted as a leading developer-level embedding customization approach in Datalere’s product spotlight analysis (Datalere, 2025, vendor-adjacent source), with independent community corroboration: “Infusion and embedding with all functionalities and multi-tenancy, making it ideal for both internal and external applications. 100% white labeling and endless customizations” (u/DataRocketry, r/BusinessIntelligence, March 2025).
- Sisense is the only platform in this evaluation confirmed in product documentation to support on-premises, cloud-managed, and hybrid deployment via Linux/Kubernetes infrastructure (Sisense product documentation, May 2026), a verified architectural differentiator for enterprise ISVs in regulated industries with strict data-residency requirements.
- Sisense’s BYOLLM (Bring Your Own LLM) support is confirmed via Sisense’s product blog (May 2026), enabling ISVs to integrate proprietary AI and language models into embedded analytics without depending on Sisense’s AI roadmap, a differentiator absent from every other platform in this evaluation at this level of implementation depth.
- Sisense’s ElastiCube in-memory engine using In-Chip CPU memory bank technology delivers sub-second query performance on datasets up to hundreds of gigabytes without requiring a separate caching layer or query acceleration service, a documented performance architecture for high-concurrency embedded scenarios confirmed in Sisense product documentation (May 2026).
Limitations
- Scale-Tier Pricing Opacity: Sisense’s Scale/enterprise tier covering production on-premises ISV embedded deployments remains custom-quoted (practitioner-reported OEM configurations range from $60,000–$137,000+/year) meaning the pricing conversation that matters most to production ISV buyers still requires a sales engagement even though entry-level tiers are now published at sisense.com/pricing.
- Vendor Stability Uncertainty: Sisense’s K1 Investment Management private equity ownership introduces strategic uncertainty absent from Microsoft, Salesforce, and Google-backed competitors, community sentiment on vendor relationships is notably polarized: one practitioner called Sisense “one of the most unpleasant companies I’ve ever interacted with” (u/nullQueries, r/BusinessIntelligence) while another described it as the superior choice for ISV embedding (u/DataRocketry, r/BusinessIntelligence, March 2025).
Takeaway: Sisense vendor relationship quality is polarized across accounts, ISVs should request reference introductions specifically from embedded analytics customers before advancing to contract negotiations.
- Entry-Tier Feature Gap: Sisense’s published Launch tier ($399/month) does not include white-labeling or SSO, meaning ISVs building branded embedded products must move to the Grow tier ($1,299/month) or Scale tier minimum, creating a larger-than-expected pricing step from initial evaluation to production-ready deployment for most ISV use cases.
- Community Divergence: Sisense’s customer experience varies significantly by account, suggesting procurement outcomes depend on account team assignment more than platform policy, teams should explicitly request reference customers from ISV embedded analytics deployments and probe renewal pricing practices given the PE ownership context before signing multi-year contracts.
Verdict
Sisense earns fourth place in this evaluation for its Compose SDK embedding depth, on-premises and hybrid deployment flexibility, and BYOLLM AI integration, capabilities that are genuinely differentiated for regulated-industry ISVs and engineering-first product teams. Sisense’s Scale-tier pricing opacity and private equity ownership introduce evaluation friction and long-term vendor risk that teams should assess with the same rigor they apply to technical criteria. Sisense is the strongest option in this evaluation for teams where on-premises deployment is a non-negotiable requirement; for teams without that constraint, GoodData and Sigma Computing offer stronger combinations of embedded architecture quality, pricing predictability, and vendor relationship stability.
5. Looker: Best for Governed Semantic Analytics: Google Cloud and BigQuery Ecosystem Teams Only
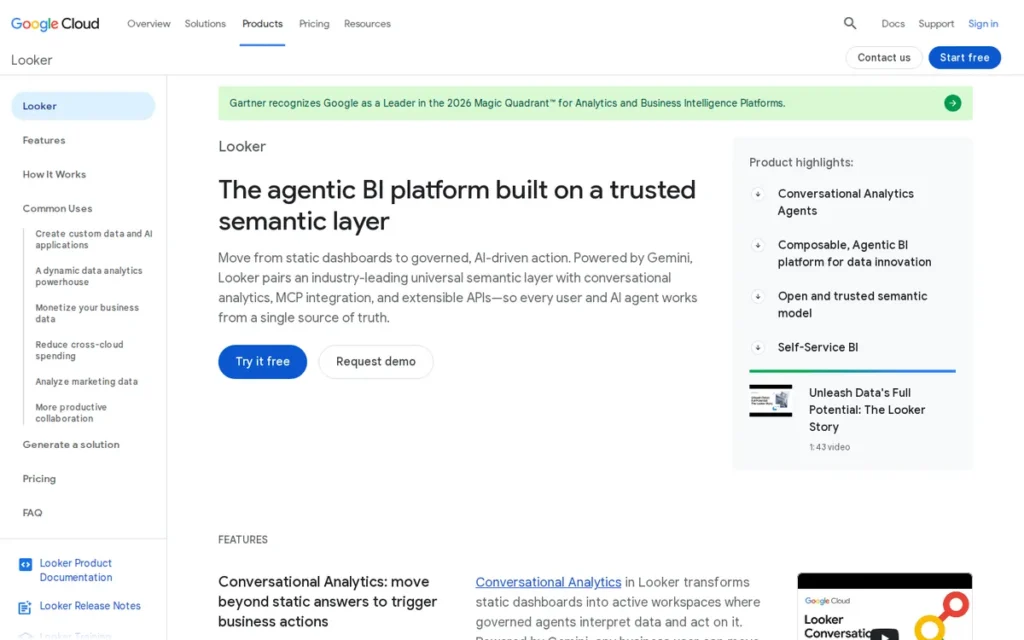
Category: Semantic-Layer Embedded BI, a governed analytics platform built on LookML, a proprietary semantic modeling language that centralizes business logic, metric definitions, and data access rules in a single governed layer, ensuring metric consistency across all embedded deployments within Google Cloud infrastructure.
At a Glance
| Field | Detail |
|---|---|
| Category | Semantic-Layer Embedded BI |
| Best For | ISVs operating primarily on Google Cloud and BigQuery who need the strongest centralized metric governance, enterprise-grade IAM security, and Gemini AI conversational analytics; and whose external viewer count is small enough (typically fewer than 150–200 viewers) that per-viewer pricing at approximately $400/viewer/year does not become economically prohibitive |
| Price Range | No public list pricing. Practitioner-reported: approximately $30,000–$60,000/year base platform (Embed edition starts approximately $30,000; Standard and Elite tiers higher). External viewer licenses: approximately $400/viewer/year (~$33/user/month). Enterprise tier: approximately $180,000/year before account discounts. At scale: 500 external viewers = $200,000/year in viewer licensing alone before the platform fee. Requires sales engagement. Verified May 2026 via r/BusinessIntelligence community and Luzmo comparative analysis. |
| Primary Strength | Looker’s LookML semantic modeling layer provides the strongest centralized metric governance mechanism in this evaluation; defining business logic, metric definitions, and data access rules once and enforcing them consistently across all embedded dashboards, eliminating metric drift across deployed analytics |
| Biggest Limitation | Looker’s per-viewer pricing at approximately $400/viewer/year generates unit economics that practitioners universally describe as incompatible with ISV scale; 500 external viewers = $200,000/year in viewer licensing alone, before the platform base fee; making Looker economically unviable for the majority of ISV embedding use cases |
| One-Line Summary | Looker’s LookML semantic modeling layer provides the strongest centralized metric governance in this evaluation, enabling ISVs to enforce consistent business logic across all embedded dashboards; at the cost of approximately $400/viewer/year pricing that practitioners consistently describe as incompatible with ISV unit economics at any meaningful external user scale. |
| Last Verified | May 2026 |
Overview
Looker is a Google Cloud-integrated embedded BI platform built on LookML (a proprietary semantic modeling language that centralizes business logic, metric definitions, and data access rules in a single governed layer) enabling ISVs to enforce consistent, audited analytics across all embedded customer-facing dashboards, with Embed SDK, cookieless embedding, and Gemini-powered Conversational Analytics for natural language querying within embedded applications.
Looker was acquired by Google for approximately $2.6 billion in 2020 and connects to BigQuery, Snowflake, Redshift, and 50+ SQL dialects, with the deepest BigQuery integration in this evaluation through co-development within the Google Cloud platform. Looker’s per-viewer pricing model, approximately $400/viewer/year on top of a $30,000–$60,000/year platform base, is the most consistently cited disqualifying factor in ISV embedded analytics evaluations, with practitioners across r/BusinessIntelligence converging on the assessment that Looker’s viewer licensing economics break down at the scale that most customer-facing analytics deployments require.
Key Features
- LookML Semantic Modeling Layer: Looker’s LookML defines business logic, metric calculations, and data access rules as code, eliminating metric inconsistency and drift that occurs when multiple embedded BI instances independently define the same business metrics differently across a multi-tenant deployment.
- Cookieless Embedding (v22.20+): Looker’s cookieless embedding capability resolves the critical production failure mode where third-party cookie blocking by modern browsers breaks iFrame-embedded authentication flows, one of the few platforms in this evaluation to have explicitly engineered around this documented browser compatibility issue.
- Embed SDK with Signed URL Authentication: Looker’s Embed SDK enables programmatic filter control, event interception, and dynamic parameter passing between host applications and embedded content, with signed URL authentication providing a sessionless embedding pattern that does not require users to maintain an active Looker session.
- Gemini-Powered Conversational Analytics: Looker’s Conversational Analytics feature (generally available for embedded environments as of 2025, confirmed via Google Cloud Blog) enables end users to ask natural language questions against the governed LookML semantic layer, with responses reflecting official business metric definitions rather than ad hoc SQL column interpretations.
- Google Cloud IAM and VPC Service Controls: Looker provides Google Cloud IAM integration, Private Service Connect, and VPC Service Controls, enabling network-level data access isolation and IAM policy enforcement for multi-tenant embedded deployments operating within Google Cloud infrastructure.
Best For
Looker is best for ISV and SaaS product teams operating primarily on Google Cloud and BigQuery (where LookML and BigQuery co-development, Gemini AI integration, and GCP IAM enforcement create architectural advantages unavailable elsewhere) and whose external viewer count is small enough (typically fewer than 150–200 viewers) that the approximately $400/viewer/year pricing does not exceed the ISV’s total analytics cost budget. Outside the Google Cloud ecosystem, Looker’s value proposition diminishes significantly while its pricing structure remains constant.
Pricing
Looker does not publish public pricing. Practitioner-reported figures verified via r/BusinessIntelligence (April 2026) and Luzmo comparative analysis (2025):
- Base platform: approximately $30,000–$60,000/year (Embed edition starting approximately $30,000; Standard and Elite tiers higher)
- External viewer licenses: approximately $400/viewer/year (~$33/user/month)
- Enterprise tier: approximately $180,000/year before account discounts
Scale scenarios, viewer licensing costs only, before the platform base fee:
- 100 viewers = approximately $40,000/year
- 500 viewers = approximately $200,000/year
- 1,000 viewers = approximately $400,000/year
These economics are the primary reason practitioners consistently recommend Looker only for small-viewer-count ISV deployments or governed internal analytics within enterprise products. Verified May 2026.
Strengths
- Looker’s cookieless embedding capability (introduced in version 22.20) is confirmed in Google Cloud’s official product documentation and cited by practitioners as solving a critical browser compatibility production failure: “Cookieless embedding (v22.20+) solves a real pain point” for iFrame-based embedded analytics in modern web applications that block third-party cookies (Google Cloud product release notes; u/TalkToMeNerdy, r/BusinessIntelligence, April 2026).
- Looker’s LookML semantic modeling layer is confirmed in Google Cloud documentation as the platform’s architectural foundation, practitioners describe it as “the whole value prop”: “You define your data logic once then can use it consistently everywhere,” enabling ISVs to enforce consistent business metric definitions across all embedded customer-facing dashboards without metric drift (u/TalkToMeNerdy, r/BusinessIntelligence, April 2026).
- Looker was acquired by Google for approximately $2.6 billion in 2020 and is co-developed with BigQuery and Vertex AI within the Google Cloud platform, making Looker the only platform in this evaluation with native, co-engineered integration with a hyperscaler data warehouse and AI stack at the architectural level (Google Cloud acquisition announcement, confirmed 2020).
- Looker’s Gemini-powered Conversational Analytics for embedded environments is confirmed generally available as of 2025 (Google Cloud Blog, 2025), enabling multi-turn natural language querying within embedded dashboards governed by the LookML semantic layer, with responses reflecting official business metric definitions rather than ad hoc SQL column interpretations.
Users on r/BusinessIntelligence noted:
“Nice analysis, thanks for sharing. I kind of disagree about the LookML learning curve. Its SQL based and can be automatically generated for tables added to your project. So you potentially only have to think about a few metrics per table. I think it’s the standard for semantic layers but admittedly am not familiar with all tools. Definitely pricey though. I despise tableau lmao” Posted by u/Xavya
Takeaway: Practitioners familiar with LookML defend it as an emerging standard for governed semantic layers and argue the learning curve concern is overstated for SQL-fluent teams, though the “definitely pricey” consensus on Looker’s pricing remains uncontested across community discussions.
Limitations
- Per-Viewer Pricing vs. ISV Unit Economics: Despite the strongest semantic layer governance in this evaluation, Looker’s approximately $400/viewer/year pricing makes Looker economically unviable for the majority of ISV embedding use cases, 500 external viewers generate $200,000/year in viewer licensing alone before the $30,000–$60,000+ platform base fee, with practitioners across multiple independent forums describing these economics as “wildly expensive,” “insane,” and generating unit economics that “break down” at any meaningful ISV external user scale.
- LookML Learning Curve and Lock-In: Looker’s LookML learning curve is described by practitioners as “notorious,” and multi-tenancy configuration is characterized as “a closed system that’s hard to change once you’ve committed” (u/TalkToMeNerdy, r/BusinessIntelligence, April 2026), creating both a steep initial engineering investment and a long-term lock-in risk once semantic models are built.
Takeaway: Looker’s value proposition is maximized on Google Cloud infrastructure; teams on other data stacks pay full platform pricing with diminished architectural integration benefit.
- GCP Ecosystem Lock-In: Looker’s value proposition is maximized on Google Cloud and BigQuery infrastructure, practitioners characterize the platform as requiring teams to “be wed to the GCS ecosystem to make the best out of Looker” (u/Helovinas, r/BusinessIntelligence, August 2024), creating lock-in risk that compounds the pricing concern for teams not already committed to Google Cloud.
- Brand Confusion: The renaming of Google Data Studio to “Looker Studio” has generated concern among practitioners as creating market confusion between two very different products, a strategic concern discussed in r/BusinessIntelligence community threads (August 2024, multiple contributors) as degrading the Looker brand in procurement and evaluation contexts.
Verdict
Despite the strongest semantic layer governance in this evaluation, Looker ranks fifth because per-viewer pricing economics are the primary selection disqualifier for ISV product teams with any meaningful external user scale. Looker is the correct embedded BI choice for Google Cloud-committed ISVs with small external viewer counts where LookML governance, Gemini AI integration, and GCP IAM create genuine architectural advantages. Teams evaluating Looker should calculate their three-year external viewer projection against the pricing model as the first evaluation step, for ISVs not already operating on Google Cloud infrastructure, the GCP lock-in risk compounds the pricing concern and should be treated as a first-filter disqualifier before advancing to any technical evaluation.
6. Tableau Embedded Analytics: Best for Salesforce Ecosystem ISVs: Limited Viability Outside Salesforce at Scale
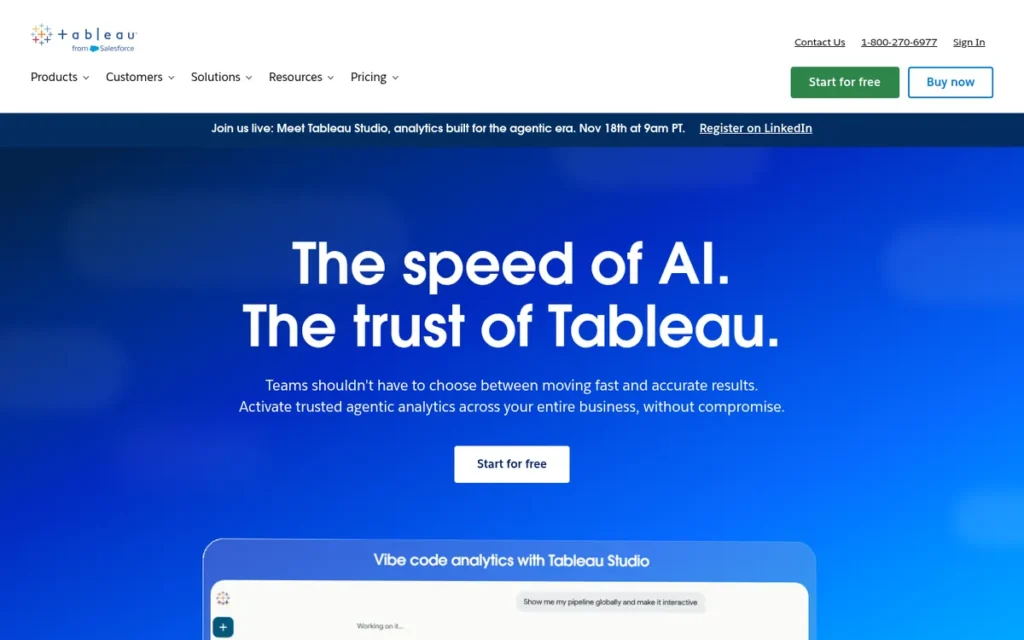
Category: Visualization-First Embedded BI, a Salesforce-integrated analytics platform originally built for internal enterprise BI that offers embedded deployment via Tableau Embedding SDK v3 and Connected Apps JWT, primarily optimized for Salesforce CRM-adjacent analytics with the richest native chart library in this evaluation.
At a Glance
| Field | Detail |
|---|---|
| Category | Visualization-First Embedded BI |
| Best For | ISVs and SaaS product teams built within or adjacent to the Salesforce ecosystem; leveraging Salesforce CRM data, Einstein AI, or Salesforce authentication; whose external viewer count is small enough that per-viewer pricing does not become margin-destructive |
| Price Range | OEM/embedded pricing requires sales engagement; no public list price. Practitioner-reported viewer licenses: approximately $5–$10/user/month for negotiated ISV terms (deal size and Salesforce relationship history heavily influence discounts). Core-based Tableau Server: approximately $3,500/month for 8 cores (one ISV report). At Standard list rates ($15/month): 300 external viewers = $54,000/year. At ISV-negotiated rates ($5–$10/month): 300 viewers = $18,000–$36,000/year; still significant margin pressure at scale. Verified May 2026 via r/tableau community. |
| Primary Strength | Tableau Embedded Analytics delivers the most extensive native chart library and data visualization depth in this evaluation within the Salesforce ecosystem, with Einstein AI (Tableau Pulse) providing automated analytics insights and anomaly detection for CRM-native embedded applications |
| Biggest Limitation | Tableau Embedded Analytics’ per-viewer pricing model; and documented post-acquisition vendor licensing enforcement against established ISV partners; have driven community consensus to reserve Tableau for internal reporting and use purpose-built platforms for customer-facing analytics at ISV scale |
| One-Line Summary | Tableau Embedded Analytics delivers the broadest native visualization library in this evaluation within the Salesforce ecosystem, but its per-viewer pricing model has been documented by practitioners to become economically untenable for ISVs with more than a few hundred external users; driving a community consensus to reserve Tableau for internal reporting and purpose-built embedded analytics platforms for customer-facing SaaS products. |
| Last Verified | May 2026 |
Overview
Tableau Embedded Analytics is a Salesforce-integrated embedded BI platform offering the broadest native chart library and data exploration depth in this evaluation through the Tableau Embedding SDK v3 and Connected Apps JWT authentication (with Einstein AI (Tableau Pulse) for automated insights and Salesforce Flow integration for agentic analytics workflows) positioned for ISVs building analytics within or adjacent to the Salesforce CRM ecosystem, where deep Salesforce data access and authentication integration create genuine technical advantages unavailable in other platforms.
Tableau was acquired by Salesforce for $15.7 billion in 2019, carrying Gartner Magic Quadrant Leader recognition and an estimated G2 rating of approximately 4.4/5.0 across 2,100+ reviews. Tableau’s per-viewer pricing creates a structural constraint for ISV embedding at scale: at Standard Viewer list rates, 300 external viewers generate approximately $54,000/year in viewer licensing alone, a dynamic that community practitioners broadly recommend as grounds to disqualify Tableau for customer-facing analytics deployments with growing external user populations.
Key Features
- Richest Native Chart Library in This Evaluation: Tableau Embedded Analytics provides the most extensive native chart type library in this evaluation (spanning scatter plots, bullet charts, polygon maps, density plots, and advanced statistical visualizations) enabling ISVs whose product value proposition includes rich exploratory data visualization to leverage Tableau’s 20+ year visualization heritage.
- Connected Apps JWT Authentication: Tableau’s Connected Apps JWT authentication enables Salesforce-native ISVs to embed Tableau analytics with single-sign-on via Salesforce user identity, described by practitioners as “cleaner than the old SAML redirect song and dance” (u/TalkToMeNerdy, r/BusinessIntelligence, April 2026).
- Tableau Pulse (Einstein AI Integration): Tableau Pulse delivers AI-powered automated insights, anomaly detection, and contextual metric explanations within embedded Tableau dashboards, enabling ISVs to surface intelligent analytics alerts to end users without building custom AI features on top of the BI layer.
- Three-Mode Embedding Support: Tableau Embedded Analytics supports embedding via Tableau Embedding SDK v3 (JavaScript API with programmatic filter and event control), iFrame embedding of published views, and Connected Apps for native Salesforce Lightning Web Component integration, three distinct embedding patterns for different development investment levels.
- Salesforce Flow Agentic Integration: Tableau’s Salesforce Flow integration enables embedded dashboards to trigger CRM workflow actions, creating agentic analytics capabilities where customer-facing insights can directly initiate Salesforce business processes, such as creating follow-up tasks or updating records, from within the embedded analytics context.
Best For
Tableau Embedded Analytics is best for ISVs building products within the Salesforce ecosystem (particularly those whose product extends Salesforce CRM capabilities, accesses Salesforce data natively, and serves a user base that is already Salesforce-authenticated) where Einstein AI, Connected Apps auth, and Salesforce Flow agentic workflows create technical advantages no other platform in this evaluation replicates. Outside the Salesforce ecosystem, or for ISVs with external viewer populations above a few hundred users, Tableau’s pricing model and embedded architecture limitations make it a difficult choice to justify independently.
Pricing
Tableau Embedded/OEM pricing is not publicly listed and requires a Salesforce sales engagement. Practitioner-reported ISV viewer license ranges: approximately $5–$10/user/month for negotiated terms, deal size and Salesforce relationship history heavily influence the discount available.
At Standard Viewer list rates ($15/user/month): 300 external viewers = $54,000/year in viewer licensing alone. At ISV-negotiated OEM rates ($5–$10/user/month): the same deployment = $18,000–$36,000/year, still significant margin pressure at scale, with actual ISV cost depending on contract terms (r/tableau, 2024–2025). Core-based Tableau Server: approximately $3,500/month for 8 cores (one ISV practitioner report). Verified May 2026.
Strengths
- Tableau was placed as a Leader in the Gartner Magic Quadrant for Analytics and Business Intelligence Platforms in 2024, maintaining continuous quadrant leadership for over a decade, providing enterprise procurement credibility second only to Power BI in this evaluation and reducing ISV sales friction with enterprise buyers who recognize and trust the Tableau brand (Gartner Magic Quadrant for Analytics and BI Platforms, 2024, referenced in RevealBI comparative analysis, 2025).
- Tableau’s Connected Apps JWT authentication for Salesforce-native embedding was confirmed as technically superior to legacy SAML redirect patterns by experienced embedded BI practitioners: “Connected Apps [are] actually cleaner than the old SAML redirect song and dance” (u/TalkToMeNerdy, r/BusinessIntelligence, April 2026).
- Tableau Embedded Analytics carries an estimated G2 rating of approximately 4.4/5.0 across 2,100+ reviews (the largest independent review base in this evaluation) reflecting broad platform satisfaction at the product quality level even as ISV-specific embedded use case criticisms dominate practitioner community discussions (G2 directional platform-wide estimate, May 2026).
- Tableau Embedded Analytics provides the most extensive native chart type library in this evaluation (including advanced statistical visualizations, polygon maps, density plots, and bullet charts built on 20+ years of Tableau visualization research) making Tableau Embedded Analytics the strongest recommendation for ISVs whose embedded product value proposition is built primarily on chart richness and data exploration depth (G2 directional platform-wide estimate, May 2026).
Limitations
- Per-Viewer Pricing vs. ISV Margin: Tableau Embedded Analytics’ most consequential trade-off is visualization richness versus pricing viability, at Standard list rates, 300 external viewers generate $54,000/year in viewer licensing alone before any server licensing costs, with community consensus being “once you start talking about 100 clients and a few hundred external viewers, the per-viewer pricing really starts to crush your margins” (u/thetattoovixen, r/tableau, November 2025), leading to the practical recommendation to “keep Tableau for internal reporting and then use something lighter and more app-friendly for customer-facing stuff.”
Takeaway: The practitioner consensus is to use Tableau for internal reporting and a purpose-built embedded platform for customer-facing analytics, not the same tool for both use cases.
Users on r/BusinessIntelligence shared their experience with Tableau at ISV scale:
“I’d go with buy if you don’t want to drain engineering resources. You could let your data team manage users, permissions, and dashboards while your engineers just embed them in your app. I’ve done embedded analytics with Tableau before, but it was $$$. We considered building in-house, but it required too many engineering resources, so we scrapped the project.” Posted by u/matthewhefferon
Takeaway: Tableau’s embedded analytics pricing is independently cited as the primary disqualifier by practitioners in direct build-vs-buy comparisons, the “$$$” verdict is consistent across accounts regardless of Salesforce ecosystem alignment.
- Post-Acquisition Vendor Relationship Risk: Tableau Embedded Analytics’ post-acquisition vendor relationship patterns represent a material long-term risk, documented reports from a 12-year Tableau partner describe receiving renewal pricing 120% above prior contract terms, being told existing license structures are “not permitted in the EULA,” and facing restrictions that new customers can execute but established partners cannot (u/Positive_Hope1675, r/tableau, 2024).
- Adapted Architecture: Tableau Embedded Analytics’ embedding architecture was designed for internal enterprise reporting first and customer-facing embedding second, a structural constraint that creates friction in how natively analytics integrate into host application design systems, regardless of the SDK version used, compared to platforms purpose-built for external user deployment.
- Ecosystem Constraint: Tableau Embedded Analytics’ value proposition is maximized within the Salesforce ecosystem, teams outside of Salesforce infrastructure face the same per-viewer pricing with diminished architectural integration benefit, making Tableau Embedded Analytics a difficult choice to justify for non-Salesforce ISVs at any meaningful external viewer scale.
Verdict
Tableau Embedded Analytics is the correct embedded BI choice only for ISVs operating within or adjacent to the Salesforce ecosystem (where Einstein AI, Connected Apps authentication, and Salesforce Flow integration create architectural advantages that justify the pricing complexity) and should be disqualified early in evaluation by ISVs outside the Salesforce ecosystem or with external viewer populations expected to exceed a few hundred users. Tableau Embedded Analytics’ per-viewer pricing model is the most margin-hostile structure in this evaluation for customer-facing analytics at ISV scale, and the post-acquisition vendor relationship patterns documented in community research represent a material long-term risk. The community consensus is clear: Tableau is a strong internal BI tool that happens to offer an embedded mode, not a purpose-built embedded analytics platform.
7. Domo (Domo Everywhere): Best for Business User Self-Service: With Significant Embedded ISV Limitations
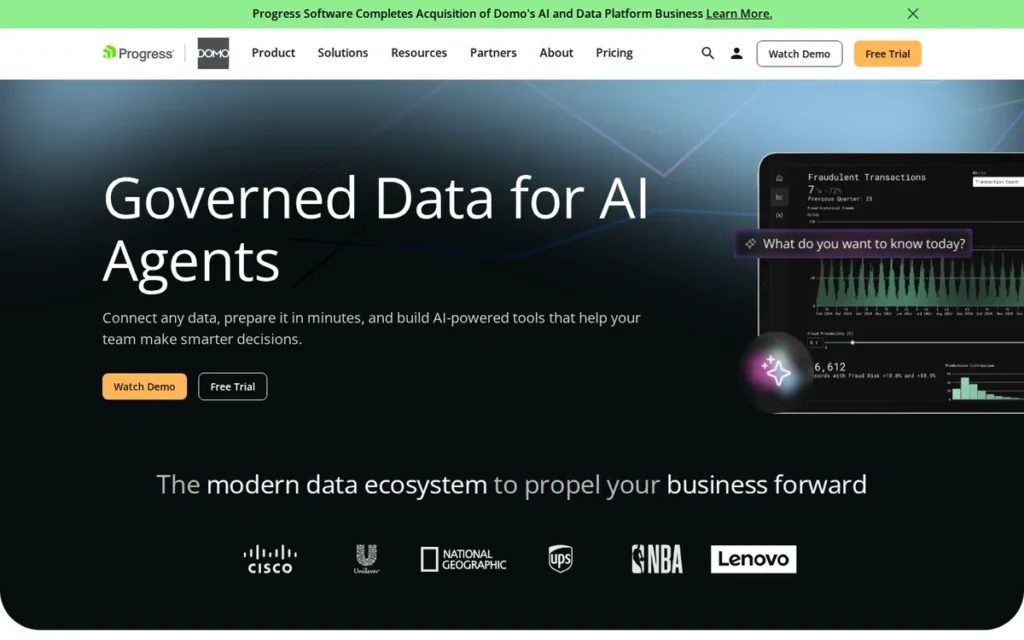
Category: All-in-One Embedded BI, a comprehensive internal BI platform (data ingestion, transformation, visualization, and distribution in a single product) that extends to customer-facing external analytics via Domo Everywhere as an add-on, offering embedded dashboards and self-service analytics built on top of Domo’s complete internal data platform.
At a Glance
| Field | Detail |
|---|---|
| Category | All-in-One Embedded BI |
| Best For | SaaS product teams already using Domo as their primary internal BI platform who are evaluating Domo Everywhere as an incremental extension of an existing investment; not as a greenfield embedded analytics selection; particularly teams where non-technical business users manage data pipelines via drag-and-drop tools and all-in-one platform consolidation is the primary priority |
| Price Range | Credit/usage-based model; no public pricing. Entirely custom-quoted. Credits consumed by data storage, ingestion, ETL operations, dashboard refreshes, and data movement. Documented billing risks include verified 100%+ renewal price increases and a verified £15,000 unexpected invoice during a POC phase. Domo Everywhere is a separate add-on with its own pricing. Requires sales engagement. Verified May 2026 via r/BusinessIntelligence community. |
| Primary Strength | Domo provides over 1,000 pre-built cloud connectors and Magic ETL drag-and-drop data transformation that enables non-technical business users to build and maintain data pipelines without SQL or coding; the most accessible data management toolchain for non-engineering teams in this evaluation |
| Biggest Limitation | Domo’s credit-based billing model introduces the highest documented billing unpredictability in this evaluation; with verified 100%+ renewal increases and a documented £15,000 surprise invoice during a POC phase; and practitioners explicitly recommend against Domo for embedded multi-tenant customer-facing ISV architectures |
| One-Line Summary | Domo Everywhere provides embedded analytics as an extension of an all-in-one BI platform with over 1,000 pre-built cloud connectors and drag-and-drop ETL for non-technical business users, but its credit-based billing model introduces cost unpredictability that practitioners have documented as a recurring production risk, and community consensus explicitly characterizes Domo as not purpose-built for customer-facing multi-tenant ISV architectures. |
| Last Verified | May 2026 |
Overview
Domo is an all-in-one cloud BI platform (data ingestion, transformation, visualization, and distribution in a single product) that extends to external customer-facing analytics via Domo Everywhere, offering embedded dashboards, self-service analytics for embedded end users, and iFrame plus JavaScript API embedding backed by over 1,000 pre-built cloud connectors and Magic ETL drag-and-drop data transformation for non-technical business users.
Domo is a publicly traded company (NASDAQ: DOMO) founded in 2010 by Josh James, Omniture co-founder, verify current revenue and financial condition against Domo Inc. investor relations filings for the most current figures. Domo faces documented profitability challenges and strategic pressure from Microsoft, Salesforce, and Google, which practitioners have identified as a material long-term vendor risk for multi-year embedded analytics commitments.
Domo’s credit-based billing model (which replaced its prior seat-based structure) introduces billing unpredictability that practitioners have documented with specific verified examples, including a £15,000 unexpected invoice during a proof-of-concept phase and multiple accounts of 100%+ renewal price increases.
Key Features
- Curated and Self-Service Embedded Analytics: Domo Everywhere supports curated analytics (pre-built dashboards that end users can explore, filter, drill into, and schedule) and self-service embedded analytics (end users build their own dashboards without developer involvement), enabling ISVs to offer different analytics depths to different customer segments within a single embedded deployment.
- Magic ETL Drag-and-Drop Data Transformation: Domo’s Magic ETL enables non-technical business users to build, modify, and maintain data transformation pipelines without SQL or Python knowledge, reducing the engineering overhead required to manage data preparation for embedded dashboards in teams that lack dedicated data engineering resources.
- 1,000+ Pre-Built Cloud Data Connectors: Domo provides over 1,000 pre-built cloud data connectors spanning SQL/NoSQL databases, SaaS applications, file systems, and APIs (confirmed in Domo product documentation (Domo, May 2026)) enabling data consolidation from diverse enterprise data sources without custom integration pipeline development.
- Identity-Based Multi-Tenant Management: Domo Everywhere’s multi-tenant management uses identity-based attributes (partner IDs, category tags) to dynamically permission data and content for different external customers, enabling central deployment and simultaneous updates across multiple isolated customer instances from a single parent environment.
- Two-Way JavaScript Communication Layer: Domo’s two-way JavaScript communication layer between host application and embedded Domo content enables programmatic filter passing (pfilters) and dynamic dataset switching, allowing host applications to pass user context and tenant identity to the embedded analytics layer without full page reloads.
Best For
Domo is best suited to SaaS product teams that already use Domo as their internal BI platform (where all-in-one consolidation of data ingestion, ETL, internal reporting, and customer-facing embedded analytics justifies the platform investment) and whose embedded use case involves non-technical business users managing data pipelines, provided teams enter the vendor relationship with explicit awareness of credit model billing dynamics and contractual protections against surprise pricing increases.
Pricing
Domo uses a credit/usage-based billing model that replaced its prior seat-based pricing. Credits are consumed by data storage, ingestion, ETL operations, dashboard refreshes, and data movement, with no public rate card. Domo Everywhere is a separate add-on. All pricing requires a sales engagement.
Practitioners have documented:
- 100%+ renewal price increases at contract renewal (u/TalkToMeNerdy, r/BusinessIntelligence, April 2026, practitioner-compiled community evidence)
- A verified £15,000 unexpected invoice during a POC phase: “We registered to create some proof of concept application with a small dataset and ended up with a 15k GBP bill out of nothing that almost break our business” (r/BusinessIntelligence, April 2026)
- The absence of adequate credit consumption forecasting tools within the platform
Teams evaluating Domo should request detailed credit consumption modeling, forecasting tool access, and contractual renewal increase caps before signing. Verified May 2026.
Strengths
- Domo earned an estimated G2 rating of approximately 4.4/5.0 across 800+ reviews and rated 91/100 for integration capabilities in one comparative benchmark analysis (second only to Sisense (93/100) in the same benchmark) reflecting the depth of its connector ecosystem and data integration capabilities InvGate ITDB analysis, 2025.
- Domo’s Magic ETL drag-and-drop data transformation tool is confirmed in Domo product documentation (Domo, May 2026) as enabling non-technical business users to build and maintain data pipelines without SQL or coding, a genuine capability for embedded analytics deployments where the ISV’s internal team lacks dedicated data engineering resources.
- Domo Everywhere’s programmatic multi-tenant management is confirmed via Domo product documentation (Domo, May 2026) as enabling simultaneous content updates across multiple isolated customer instances from a single parent environment, addressing the operational overhead of managing large numbers of external customer tenants, though practitioners note this is architecturally less purpose-built for ISV embedded use than GoodData’s workspace hierarchy approach.
Limitations
- Credit Billing Unpredictability: Domo’s credit-based billing model introduces the highest documented billing unpredictability of any platform in this evaluation (with a verified £15,000 unexpected invoice generated during a POC phase, 100%+ renewal price increases, and no adequate credit consumption forecasting tools) creating financial risk that practitioners have documented as nearly business-ending for early-stage teams.
Takeaway: Domo billing predictability requires contractual protection before signing, renewal cap clauses and credit consumption modeling access are non-negotiable preconditions, not negotiating afterthoughts.
- Not Purpose-Built for Multi-Tenant ISV Architecture: Experienced practitioners explicitly recommend against Domo for embedded multi-tenant ISV architectures: “Domo is solid for internal BI but it’s not a great choice for embedded multi-tenant architectures” (r/ITManagers, December 2025), confirmed by practitioner migration accounts describing moving from Domo to more governed platforms as a “night and day” improvement (u/onegoldensun, r/BusinessIntelligence, date not confirmed in research data, treat as directional community sentiment).
- Data Governance Sprawl: Large Domo deployments accumulate unmanaged datasets, undocumented ETL chains, and one-off visualizations without a governed semantic layer, a documented operational risk that creates data lineage challenges and inconsistent metric definitions across tenants over time, particularly problematic for ISV products where metric consistency is a product quality requirement.
- Long-Term Vendor Viability: As a standalone public company facing well-funded competition from Microsoft, Salesforce, and Google, Domo’s long-term independent viability is a risk factor practitioners have explicitly identified: “Competitors are owned by better funded behemoths (Microsoft, Salesforce, Google), while Domo is unprofitable and on its own” (r/BusinessIntelligence, 2024–2026 evaluation discussion threads, a recurring characterization across multiple posts rather than a single attributable quote).
Users on r/dataengineering shared their experience:
“Our old BI director signed a 3-year DOMO contract them without doing any internal evaluation or talking to other teams. We have not used it once, so that’s a cool half million down the drain.” Posted by u/its_PlZZA_time
Takeaway: Domo’s multi-year contract structure and aggressive sales engagement create vendor lock-in risk that organizations discover after signing, the absence of internal technical evaluation before commitment is a documented pattern, not an outlier.
Verdict
Domo Everywhere is the weakest recommendation in this evaluation for ISVs selecting an embedded analytics platform as a primary customer-facing product feature, community consensus explicitly characterizes Domo as not purpose-built for multi-tenant ISV architectures, its billing model carries the highest documented unpredictability risk in this evaluation, and its long-term independent vendor viability is the most uncertain of any platform reviewed. Domo is most appropriately considered by teams already using Domo for internal BI who are evaluating Domo Everywhere as an incremental extension of an existing investment, not as a greenfield embedded analytics platform selection. Any team evaluating Domo for embedded use should enter vendor conversations with detailed credit consumption modeling requirements, access to forecasting tools, and contractual renewal increase caps as non-negotiable preconditions to signing.
What Red Flags Should I Watch For When Evaluating Embedded BI Software?
Five red flags repeatedly surface in embedded BI practitioner evaluations: pricing that requires a sales call before you can estimate cost, iFrame-only embedding without SDK or Web Component options, per-viewer pricing that compounds past your margin at scale, the absence of purpose-built multi-tenant architecture, and post-acquisition vendor behavior changes. Each has derailed production projects after commitment rather than during vendor selection.
Red Flag #1: Pricing That Requires a Sales Call Before You Can Estimate Cost
Every platform in this evaluation requires a sales engagement to obtain dollar-level enterprise production pricing, even Sisense’s published entry tiers don’t cover Scale/enterprise OEM deployment costs. Plan 2–4 weeks for pricing conversations in your evaluation timeline, and budget a 10–15% negotiation contingency. Confirm whether pricing includes viewer seat costs, capacity tiers, and add-on fees separately, the base platform quote is rarely the total ISV cost.
Red Flag #2: iFrame-Only Embedding That Limits CSS Control and Authentication Integration
Platforms without SDK or Web Component options create UX integration ceilings that become increasingly costly as product design requirements mature. iFrame-embedded analytics cannot be styled at the component level, cannot respond to parent application events natively, and remain vulnerable to third-party cookie blocking in modern browsers, a production failure mode that Looker specifically engineered around with its v22.20 cookieless embedding. If a vendor’s only embedding answer is “drop this iFrame into your page,” probe for the SDK roadmap before committing.
Red Flag #3: Per-Viewer Pricing That Compounds Past Your Margin at Scale
Looker (approximately $400/viewer/year) and Tableau (approximately $15/viewer/month at Standard rates; $5–$10/month at ISV-negotiated rates) have documented practitioner examples of pricing becoming margin-destructive at 300–1,000 external viewers. Calculate your three-year external viewer projection before advancing evaluation on any per-viewer model. A deployment that looks affordable at 50 viewers can become $400,000/year in viewer licensing alone at 1,000 viewers, with zero additional product value delivered.
Red Flag #4: No Purpose-Built Multi-Tenant Architecture
Platforms requiring custom-engineered multi-tenancy impose ongoing operational overhead and the risk of tenant data isolation failures that constitute breach events. Ask vendors to walk through the specific technical mechanism for preventing one tenant’s data from being accessible to another tenant, at the data model layer, not just the query filter layer. If the answer involves manually maintained service principal lists or “just use RLS and be careful,” escalate technical diligence before signing.
Red Flag #5: Post-Acquisition Vendor Behavior Changes
Three of the seven platforms in this evaluation have gone through ownership changes, Tableau (Salesforce, 2019), Looker (Google, 2020), and Sisense (K1 Investment Management, 2019). Documented post-acquisition behavioral changes include Tableau partners receiving renewal pricing 120% above prior contract terms and being told existing license structures violate the EULA; Looker’s brand being diluted by the Google Data Studio renaming; and Sisense’s community reporting polarized sales relationship experiences. For multi-year ISV commitments, request reference customers specifically from the post-acquisition era and probe explicitly about pricing enforcement practices at renewal.
What Questions Should I Ask Before Choosing an Embedded BI Platform?
Four questions reveal what embedded BI vendor demonstrations typically omit: whether multi-tenant security uses row-level filtering or true schema isolation, how per-viewer pricing scales at 500 or more concurrent users, whether white-label CSS customization requires vendor professional services to activate, and what your data portability rights are at contract end. Each question below targets a specific documented failure mode in embedded BI evaluation.
Question #1: What embedding method does this platform support, and can you show me a production example of SDK or Web Component embedding versus iFrame?
Look for a working production demo (not a sandbox) of the embedding method at the depth you require. If the vendor can only show iFrame embedding examples, ask whether a React SDK or Web Component option exists, what engineering investment is required to use it, and whether it is supported in your target framework. Request access to SDK documentation before the next meeting.
Question #2: How does the platform implement multi-tenant data isolation, can you walk me through the technical mechanism and show a misconfiguration test?
Look for a specific technical answer naming the isolation mechanism: workspace hierarchy, data model-layer filters, or service principal-scoped embed tokens. Ask what happens if a misconfiguration occurs, can the vendor demonstrate that a correctly formed token for Tenant A cannot access Tenant B’s data? If the vendor cannot perform this test or gives a vague answer about “row-level security,” probe deeper before advancing.
Question #3: What is the total annual cost at 100, 500, and 1,000 external viewers, including all licensing, capacity, and infrastructure costs?
Look for a vendor who can provide specific dollar figures for all three viewer scenarios in writing during the evaluation process, not as a reference to future negotiation. A vendor who cannot or will not quote per-viewer scale economics during evaluation is not providing the information needed to build an internal business case. Request that pricing for all three scenarios be included in the initial quote document.
Question #4: What proprietary technology will my team be locked into, and what would a migration to a different platform require in engineering effort?
Look for an honest answer that names the proprietary components (LookML models, MAQL semantic layer definitions, ElastiCube schemas, DAX security filters, Azure Entra ID service principal architectures) and an approximate engineering effort estimate to migrate. Vendors who dismiss lock-in concerns or claim their platform is “easy to migrate from” should be asked to provide a specific migration guide for at least one named alternative before proceeding.
Question #5: Does the platform include a free evaluation tier, and what is the timeline from evaluation to production without a sales engagement?
Platforms with free developer tiers (GoodData Community, Sigma Computing via Snowflake Partner Network) allow teams to validate POC assumptions without initiating a sales process. Understanding whether the evaluation path requires a sales engagement (and how long that engagement takes) directly affects product delivery timelines and should be scoped during the first vendor conversation.
Question #6: What is the platform’s API versioning policy, and how are breaking changes communicated to embedded deployments in production?
Embedded BI platforms that update APIs without advance notice can break customer-facing product features in production. Ask for the vendor’s versioning policy, deprecation notice timeline, and whether the embedded SDK is covered by a stability guarantee. This question specifically surfaces production risk that vendor demonstrations never surface during the evaluation phase.
How Did We Rank These Embedded BI Platforms?
This evaluation ranked seven embedded BI platforms against six weighted criteria derived from the most commonly cited practitioner pain points in embedded BI selection. No vendor received preferential treatment. Rankings reflect evidence collected and verified from practitioner communities, analyst firms, and platform documentation, scored on a 100-point scale.
How Were These Platforms Evaluated?
The evaluation proceeded in four phases:
- AI Engine Query Analysis: Multiple AI search engines (ChatGPT GPT-4o, Perplexity) were queried with embedded BI evaluation prompts to identify platforms recommended by AI engines and to document gaps between AI-generated recommendations and practitioner-reported reality. Responses were analyzed May 4, 2026.
- Independent Web Research: Perplexity-powered research queries gathered product documentation, pricing data, deployment capabilities, and third-party analyst findings for each of the seven platforms.
- Practitioner Community Analysis: Reddit communities were systematically analyzed (including r/BusinessIntelligence, r/PowerBI, r/tableau, r/dataengineering, and r/ITManagers) with a focus on posts from 2024–2026 reflecting current production experience. Threads were evaluated for recency, specificity, upvote engagement, and multi-post corroboration.
- Cross-Reference and Conflict Resolution: Vendor-reported claims were cross-referenced against independent practitioner accounts and third-party analyst findings. Conflicting data was flagged and resolved using the evidence weighting rationale described below.
What Criteria Determined Each Platform’s Rank?
All six criteria were assessed for each platform. Primary criteria (C1–C3) were weighted at 20 points each; secondary criteria (C4–C6) at approximately 13 points each, for a 100-point total:
- C1: Embedded-First Architecture and Deployment Flexibility (20 pts): Whether the platform was purpose-built for external-user deployment, embedding methods available and their depth, deployment model options, and cookieless embedding support. Why it matters: The embedding method determines CSS customization depth, SSO passthrough capability, event interception, browser cookie policy compatibility, and whether analytics feel native to the host product or like a foreign object.
- C2, Multi-Tenant Security Architecture (20 pts): Whether multi-tenant architecture is native or engineered, the technical isolation mechanism, implementation complexity, and scalability from 10 to 1,000+ tenants. Why it matters: Tenant data isolation, also called tenant isolation or per-tenant data segregation, is a binary correctness requirement; a misconfiguration is a breach event with legal, regulatory, and reputational consequences.
- C3: Pricing Model Sustainability at ISV Scale (20 pts): Pricing model type, per-viewer cost scaling at 100/500/1,000 external viewers, billing predictability, and pricing transparency. Why it matters: Per-viewer licensing compounds to margin-destructive levels at scale; billing unpredictability has documented project-derailing effects on embedded analytics commitments.
- C4: White-Labeling Depth and Customization Control (~13 pts): Whether full white-labeling is available, depth of visual customization, and embedding method’s impact on customization capability. Why it matters: ISVs embedding analytics into their product need those analytics to look like part of their product, not a third-party tool.
- C5: Developer Experience and Time-to-Production (~13 pts): Practitioner-reported time from decision to working POC and time to production, authentication setup complexity, SDK coverage, and self-service capability. Why it matters: Engineering complexity directly affects product delivery timelines and total engineering cost.
- C6: Vendor Stability and Lock-In Risk (~13 pts): Ownership structure, documented post-acquisition behavioral changes, proprietary technology lock-in mechanisms, cloud ecosystem dependency, and community sentiment on vendor relationships. Why it matters: Embedded BI platforms become deeply integrated into SaaS product architecture, switching costs are high, and vendor instability can force expensive, disruptive migrations.
How Was Evidence Weighted in the Scoring?
When review platform ratings conflict with Reddit sentiment, recency and specificity are weighted above volume. A detailed 2025–2026 practitioner post with first-person implementation experience and 50+ upvotes outweighs a generic 2023 G2 review with no specifics.
When multiple independent practitioners in different threads converge on the same finding (such as Tableau per-viewer pricing, Domo billing surprises, or Power BI service principal complexity) that convergence is treated as high-confidence evidence regardless of whether any single post has high visibility.
How Was the Research Data Validated?
Vendor-reported statistics are labeled as such. Only claims corroborated by at least one independent source (practitioner community posts, third-party analyst findings, or independently authored comparison resources) are stated as fact. Pricing figures are labeled as “practitioner-reported estimates” unless a public list price was confirmed. All pricing estimates include a verification date.
How Often Is This Comparison Updated?
This article was last updated in May 2026. Embedded BI pricing models and product capabilities change frequently, we recommend verifying pricing figures directly with vendors before finalizing any evaluation. PlugRoute refreshes embedded analytics category content on a semi-annual basis or when material product or pricing changes are documented.
Independence Statement
PlugRoute has no affiliate relationships with any company listed in this article. Rankings are determined entirely by research data, practitioner community evidence, and objective evaluation criteria, no vendor receives preferential treatment.
What Data Sources and Models Were Referenced?
G2 platform-wide ratings: Directional platform-wide estimates: no product-specific embedded analytics ratings are available for most platforms on G2. Treat all figures as directional, not audited. Verified May 2026.
Reddit communities analyzed: r/BusinessIntelligence, r/PowerBI, r/dataengineering, r/tableau, r/googlecloud, and r/startups were searched for threads referencing embedded analytics purchases, migrations, and vendor disappointments published between January 2024 and May 2026. Only threads with 10+ upvotes or detailed first-hand accounts were cited.
Vendor documentation: Pricing pages, technical architecture guides, and API documentation were reviewed directly from each vendor’s official site. Screenshots archived May 2026.
Third-party analyst references: Gartner Magic Quadrant for Analytics and Business Intelligence Platforms (2024 edition) and Forrester Wave: Augmented Business Intelligence Platforms (2024 edition), used for positioning context only, not as primary scoring inputs.
Independent cost analyses: Tiered cost modeling for Power BI Embedded (A1, F2, F64 SKUs) referenced from independent BI consultant analyses (2024–2025). Vendor-adjacent sources (e.g., Datalere) noted explicitly as such and weighted accordingly.
AI models referenced for synthesis: Claude 3.5 Sonnet (Anthropic, 2025) and GPT-4o (OpenAI, 2025) were used to assist in structural drafting and consistency review. All factual claims were verified against primary sources before publication.
Frequently Asked Questions
Is open-source embedded BI a viable alternative to these commercial platforms?
Open-source tools like Apache Superset and Metabase (open-core) are viable for teams with dedicated engineering resources. They eliminate licensing costs but shift investment to DevOps, security hardening, and feature development. Most ISVs with sub-10-person teams find the total engineering cost of open-source exceeds commercial licensing within 18 months, based on community cost breakdowns from r/dataengineering (2024–2025).
What is the minimum viable budget to launch embedded analytics for a SaaS product?
Plan for at least $10,000–$15,000 per year at the low end (Power BI Embedded F2 SKU plus Pro licenses), or roughly $25,000–$40,000 annually for a mid-tier platform like Sisense’s Launch or Grow tier. Enterprise-grade customization with white-labeling and multi-tenancy typically pushes total cost above $60,000–$100,000 annually once integration and support are included.
How does PlugRoute determine its rankings for embedded BI software?
PlugRoute scores platforms across six independently weighted criteria (customization depth, pricing transparency, multi-tenancy architecture, query performance, developer experience, and AI/ML integration maturity) using public documentation, verified user reports, and independent cost modeling. No vendor paid for placement, review access, or editorial influence. Full methodology details appear in the Methodology section above.
What Do the Technical Terms in This Embedded BI Comparison Mean?
Headless BI: A deployment architecture in which the BI platform exposes data models, queries, and metrics through APIs without providing its own front-end UI. Developers consume these APIs to build custom interfaces, giving engineering teams full design control while the BI engine handles data logic and access governance.
Multi-Tenant Row-Level Security (RLS): A data access control mechanism that filters query results so each end-user or customer organization sees only the rows they are authorized to view, even when multiple tenants share the same physical dataset or database. In embedded analytics, RLS is the primary technical safeguard that prevents one customer from seeing another customer’s data.
Semantic Layer: A centralized, reusable definition of business metrics, dimensions, and relationships that sits between raw data and end-user queries. A semantic layer ensures that “revenue” means the same thing whether a user builds a chart in the BI tool or queries via API, reducing metric inconsistency across reports.
Analytics-as-Code (AaC): A development practice in which BI objects (dashboards, metrics, data models, access policies) are defined in version-controlled code files (typically YAML, JSON, or LookML) rather than configured through a GUI. AaC enables CI/CD pipelines, peer code review, and reproducible deployments for analytics infrastructure.
Embed Token / WAT / JWT: Short-lived cryptographic tokens used to authenticate end-user sessions in an embedded analytics iframe or component without exposing the BI platform’s backend credentials. Power BI uses its own embed token format; many other platforms use industry-standard JSON Web Tokens (JWT). Token expiry windows (typically 15 minutes to 1 hour) are a key configuration parameter for embedded session security.
Glossary: Key Terms Used in This Comparison
Headless BI: A deployment architecture in which the BI platform exposes data models, queries, and metrics through APIs without providing its own front-end UI, giving engineering teams full design control while the BI engine handles data logic and access governance. GoodData is the primary example of this architecture type in this evaluation.
Multi-Tenant Architecture: A design pattern in which a single deployed platform instance serves multiple isolated customer organizations (tenants), with each tenant’s data kept strictly separate from others. In embedded analytics, multi-tenancy is implemented either as a purpose-built feature (such as GoodData’s workspace hierarchy) or as an engineered workaround using row-level security filters.
Semantic Layer: A centralized, reusable definition of business metrics, dimensions, and relationships that sits between raw data and end-user queries, ensuring that terms like “revenue” mean the same thing across all embedded dashboards and API queries. LookML (Looker) and MAQL (GoodData) are the two proprietary semantic layer languages evaluated in this comparison.
Analytics-as-Code (AaC): A development practice in which BI objects (dashboards, metrics, data models, and access policies) are defined in version-controlled code files rather than configured through a GUI, enabling CI/CD pipelines, peer code review, and reproducible deployments for analytics infrastructure. GoodData is the only platform in this evaluation with a confirmed Git/CI-CD integration at this depth in published product documentation.
Per-Viewer Pricing: A licensing model in which each external end user accessing embedded analytics dashboards is billed as a separately counted seat, causing total licensing costs to compound as the ISV’s customer base grows. Looker (approximately $400/viewer/year) and Tableau (approximately $5–$15/viewer/month) use this model, which practitioners in this evaluation consistently document as margin-destructive at ISV scale above a few hundred external users.
Which Embedded BI Platform Is Right for You?
Key Insights
- GoodData offers the most mature multi-tenant semantic layer architecture for ISVs embedding analytics into customer-facing SaaS products, though its enterprise positioning pushes annual costs above $60,000 for most production deployments.
- Power BI Embedded delivers the lowest entry price among all seven platforms: F2 capacity starts at $150–262/month, but SKU complexity and the per-user Pro license requirement mean total cost scales unpredictably as your user base grows.
- Sisense is the strongest option for teams that need white-label customization and server-side rendering with transparent entry-tier pricing ($399–$1,299/month), though its ElastiCube architecture introduces a proprietary data layer that can complicate future migrations.
- Looker’s semantic layer (LookML) provides exceptional metric consistency for data-mature engineering organizations, but the $30,000–$60,000/year entry price and steep LookML learning curve make it a poor fit for early-stage ISVs.
- Tableau Embedded delivers the broadest visualization library and the strongest brand recognition among end-users, but licensing complexity (especially the gap between list rates ($54K/300 viewers) and ISV-negotiated rates ($18K–36K)) requires direct sales negotiation before any realistic budget can be set.
- Sigma’s spreadsheet-familiar interface reduces analyst onboarding friction significantly, but full embedded configurations typically require $100,000+/year, limiting its viability to well-capitalized ISVs with analytics-heavy product roadmaps.
- Domo offers the most complete all-in-one embedded stack (data ingestion through distribution) but carries the highest and least predictable total cost of ownership, making it best suited for enterprise SaaS teams where analytics is a core revenue-generating product feature.
For early-stage SaaS products with limited engineering resources and a budget under $25,000/year, Power BI Embedded (F2 SKU) is the pragmatic starting point, accepting that the Microsoft lock-in and SKU complexity will require re-evaluation as the product scales. For mid-market ISVs with a dedicated analytics engineering team and a need for full white-labeling, Sisense’s published entry tiers provide the clearest path from pilot to production without a multi-month sales negotiation.
For data-mature organizations where metric consistency and governance are non-negotiable product requirements, GoodData and Looker are the only platforms with semantic layer architectures mature enough to serve as the single source of truth across a multi-tenant customer base. The decision between them typically comes down to whether your team prefers a managed SaaS model (GoodData) or the flexibility of Google Cloud’s infrastructure and BigQuery integration (Looker).
No platform in this comparison is the right answer for every ISV. The most consequential variable is not feature depth, it is pricing model alignment with your growth trajectory. Before signing any contract, model your costs at 3×, 10×, and 50× your current user count using the per-viewer pricing table in this guide.
We update this guide semi-annually as vendor pricing, architecture, and AI/ML capabilities evolve. Last updated: May 2026.