Appfire Flow ranks #1 in this 2026 review for its Lightspeed case study outcomes, 35% cycle-time reduction, 14-hour drop in PR merge time. Waydev ranks #2 for Fortune 500-grade breadth with 130+ metrics and a 4.4/5.0 G2 rating. LinearB ranks #3 for active PR workflow automation. The right tool depends on team size, tech stack, and measurement goal.
Engineering leaders face over a dozen credible options, most hiding pricing behind mandatory sales calls. As of June 2026, Appfire Flow and Plandek appear in no AI-generated response analyzed for this review, a systematic gap for Jira-centric and SAFe-program buyers. Vendor-sponsored comparisons have a structural incentive against documenting the failure modes practitioners openly report: metric gaming, platform abandonment, and surveillance perception.
PlugRoute has no affiliate relationships with any company listed. Rankings are determined entirely by research data and objective evaluation criteria.
One practitioner in r/devops summarized the adoption challenge directly:
“We tried LinearB for 6 months. While the metrics were nice to look at, most of our teams ended up ignoring them after the initial excitement wore off… engineers felt like they were being micromanaged. We got better results by just using GitHub’s built-in analytics and having regular retrospectives with the team.”, u/Smashing-baby, r/devops, 2025
Takeaway: Metric fatigue and surveillance perception are the most documented drivers of platform abandonment, rollout strategy and developer communication matter as much as tool selection itself.
Which Software Development Analytics Tools Are Worth Shortlisting?
- Appfire Flow ranks #1 in this review for its named case study evidence: Lightspeed reported a 35% cycle-time reduction and a 14-hour drop in PR merge time, making it the top choice for Jira- and Azure DevOps-centric enterprises needing documented delivery improvement outcomes for executive stakeholders.
- Waydev is the strongest choice for Fortune 500-scale multi-VCS environments, covering 130+ metrics with Y Combinator backing and a 4.4/5.0 G2 rating across deployments at American Express, Dropbox, and Citibank.
- LinearB is the only platform combining DORA analytics with programmable PR workflow automation (GitStream), rated Trial on the Thoughtworks Technology Radar (October 2024), making it the top choice for GitHub-centric teams of 20–200 engineers needing active bottleneck resolution beyond passive dashboards.
- Jellyfish is the top choice for board-level engineering investment justification, holding the G2 Leader position for 11 consecutive quarters (Spring 2025) and tracking AI coding tool ROI across GitHub Copilot, Cursor, Claude Code, and Amazon Q for 700+ enterprise customers.
- Plandek is the top choice for UK and EU organizations or SAFe programs, offering simultaneous flow + DORA + Scrum coverage with AI-powered predictive delivery risk forecasting, recognized as the G2 Top Trending Product with the largest month-over-month category rating increase (+0.007) as of June 1, 2026.
- Typo offers the most accessible starting price in this review at $15/user/month with a free version, making it the lowest-friction entry point for growth-stage teams measuring AI coding tool ROI for Cursor and Claude Code without an enterprise budget.
- Swarmia is the developer-trust-first option with the only working agreements feature in this review, designed for GitHub and Jira teams of 15–150 engineers where an explicit anti-surveillance philosophy is a non-negotiable adoption requirement.
What Are the Four Categories of Software Development Analytics Tools?
Software development analytics tools fall into four distinct categories, each solving a different core engineering leadership problem. Understanding which category matches your primary need is the fastest path to a correct procurement decision, selecting a tool from the wrong category is the most common driver of tool abandonment.
The four categories are:
- Delivery Analytics: measures flow metrics and DORA (Appfire Flow, Plandek)
- Enterprise Engineering Intelligence: tracks 100+ dimensions for Fortune 500 organizations (Waydev, Jellyfish)
- Workflow Automation + Analytics: actively resolves delivery bottlenecks in addition to measuring them (LinearB)
- Developer Experience Analytics: prioritizes team-level trust and accessible pricing (Swarmia, Typo)
Category 1: Delivery Analytics
Platforms in this category, Appfire Flow and Plandek, are built on Mik Kersten’s five flow metrics, the four DORA metrics, or both simultaneously. Delivery Analytics tools are best for engineering leaders who need to measure value stream performance, justify delivery improvement to executive stakeholders, or run SAFe and scaled agile programs requiring program-increment-level visibility.
Category 2: Enterprise Engineering Intelligence
Platforms in this category, Waydev and Jellyfish, track 100+ dimensions of engineering performance and connect engineering activity to business outcomes. Enterprise Engineering Intelligence tools are best for CTOs at organizations with 150 or more engineers who need investment allocation reporting, portfolio-level visibility, and board-level ROI justification for engineering spend, including AI coding tool investment.
Category 3: Workflow Automation + Analytics
LinearB is the only platform in this review combining delivery analytics with programmable PR workflow automation. Workflow Automation platforms actively reduce bottlenecks through GitStream’s review routing rules, auto-merge policies, and CI/CD gating, the right choice for engineering managers who have found that identifying a bottleneck is not enough to resolve it.
Category 4: Developer Experience Analytics
Platforms in this category, Swarmia and Typo, prioritize developer trust, team-level measurement, and accessible pricing. Developer Experience Analytics tools are best for engineering leaders at growth-stage teams where developer buy-in is a non-negotiable adoption constraint, or for organizations evaluating their first dedicated analytics platform without an enterprise-level budget.
How Do the Top Software Development Analytics Tools Compare at a Glance?
| Rank | Company | Category | Best For | One-Line Summary | Key Capabilities | Primary Strength | Key Limitation |
|---|---|---|---|---|---|---|---|
| #1 | Appfire Flow | Delivery Analytics | Jira/Azure DevOps enterprises (50+ engineers) needing documented ROI evidence | Delivery intelligence platform acquired from Pluralsight by Appfire (February 2025) with two publicly named, requestable case studies | Five flow metrics + DORA; Jira + Azure DevOps + GitHub native integration; AWS Marketplace availability | Two publicly requestable named case studies (Lightspeed, BNY Mellon); only tool with native Atlassian and Microsoft dual-ecosystem integration | Highest per-seat starting price ($50/user/month); maximum value requires Jira or Azure DevOps standardization |
| #2 | Waydev | Enterprise Engineering Intelligence | Enterprise orgs (150+ engineers) with multi-VCS environments requiring Fortune 500-grade coverage | Y Combinator-backed platform founded in 2017, 4.4/5.0 G2 rating (40 reviews), deployed by American Express, Dropbox, and Citibank | 130+ metrics: DORA, SPACE, Git, sprint, AI-generated code; full multi-VCS: GitHub, GitLab, Azure DevOps, Bitbucket | Broadest published metric framework (130+); 8-year operating history; Y Combinator backing; 4.4/5.0 G2 rating | Pricing not publicly disclosed; onboarding complexity documented by practitioners; individual-level metrics create surveillance perception risk |
| #3 | LinearB | Workflow Automation + Analytics | GitHub-centric teams (20–200 engineers) needing active PR automation beyond passive dashboards | Thoughtworks Technology Radar Trial-rated platform (October 2024) combining DORA metrics with programmable PR workflow automation (GitStream) | DORA + sub-stage cycle time; GitStream PR automation; WorkerB Slack bot; permanent free DORA tier (unlimited contributors) | Only tool with active PR automation (GitStream); Thoughtworks Radar Trial rating (October 2024); permanent free DORA tier | GitHub-native architecture; paid tier pricing not disclosed; micromanagement perception risk without explicit developer buy-in strategy |
| #4 | Jellyfish | Business-Aligned Engineering Intelligence | CTOs/VPs at 100+ engineer orgs needing board-level engineering investment justification | Boston-based platform (~founded 2018), G2 Leader for 11 consecutive quarters (Spring 2025), serving 700+ enterprises | Work classification algorithms (described as patented); vendor-neutral AI ROI: Copilot, Cursor, Claude Code, Amazon Q; OKR mapping; portfolio reporting | G2 Leader 11 consecutive quarters (Spring 2025); 700+ enterprise customers; broadest multi-vendor AI ROI measurement in this review | Executive-first design; engineering teams frequently report surveillance perception; pricing not disclosed |
| #5 | Plandek | Delivery Forecasting + Analytics | Engineering leaders (50+ engineers) at SAFe programs or UK/EU organizations needing predictive delivery analytics | UK-based platform, G2 Top Trending Product (largest category rating increase, +0.007, June 1, 2026), covering flow + DORA + Scrum simultaneously | Flow + DORA + Scrum simultaneously; AI-powered predictive delivery risk forecasting; multi-level org hierarchy (org, program, project, team); GDPR-native UK HQ | Broadest multi-framework coverage (flow + DORA + Scrum); AI predictive delivery forecasting; G2 Top Trending as of June 2026 | Pricing not disclosed; limited publicly named case study portfolio compared to top-four competitors |
| #6 | Typo | AI-Native Engineering Analytics | Growth-stage teams (20–150 engineers) measuring AI coding tool ROI at an accessible starting price | AI-native engineering analytics platform starting at $15/user/month (entry tier) tracking DORA, cycle time, and Cursor and Claude Code productivity impact | DORA + cycle time + AI tool ROI (Cursor, Claude Code); anonymous developer surveys; AI-powered bottleneck detection; free version | Most accessible starting price ($15/user/month, GetApp June 2026); specialized Cursor and Claude Code ROI tracking; free version available | Emerging platform with limited named third-party case studies; Pro-tier pricing reported at $16–28/user/month on third-party listings |
| #7 | Swarmia | Developer Experience Analytics | GitHub+Jira teams (15–150 engineers) where developer trust is a non-negotiable adoption constraint | Developer-experience-first analytics platform with the only working agreements feature in this review and explicit team-level-only metric design | Working agreements; team-level-only DORA and cycle time; SPACE-aligned developer surveys; anti-surveillance design; 14-day free trial without mandatory demo | Only platform with working agreements feature; strongest anti-surveillance design; SPACE-aligned surveys; 14-day free trial without mandatory demo | Limited to GitHub+Jira; no built-in industry benchmarks; paid plan pricing not publicly confirmed |
Which Software Development Analytics Tool Should I Choose for My Use Case?
| Your #1 Priority | Recommended Tool | Why | Acceptable Alternative |
|---|---|---|---|
| Strongest named case study evidence for executive buy-in | Appfire Flow | Two publicly named case studies; Lightspeed (35% cycle-time reduction, 14-hour PR merge drop) and BNY Mellon (appfire.com resource library, June 2026) | Waydev (4.4/5.0 G2 rating, 40 reviews; Fortune 500 logos; Y Combinator backing) |
| Fortune 500-scale enterprise breadth + multi-VCS | Waydev | 130+ metrics; GitHub, GitLab, Azure DevOps, Bitbucket; 4.4/5.0 G2 (40 reviews); American Express, Dropbox, Citibank deployment | Jellyfish (G2 Leader 11 quarters; 700+ customers; work classification algorithms) |
| Active PR workflow automation beyond passive dashboards | LinearB | Only tool with GitStream automation engine; Thoughtworks Technology Radar Trial (October 2024); free DORA entry tier | Appfire Flow (strongest case study evidence with delivery metrics) |
| Board-level engineering investment justification | Jellyfish | G2 Leader 11 consecutive quarters (Spring 2025); 700+ enterprise customers; multi-vendor AI ROI: Copilot, Cursor, Claude Code, Amazon Q | Waydev (130+ metrics; Fortune 500 validation) |
| Flow + DORA + Scrum + predictive delivery forecasting | Plandek | Broadest multi-framework coverage in review; AI-powered delivery risk forecasting; G2 Top Trending +0.007 monthly increase, June 2026 | Appfire Flow (flow + DORA with two publicly named case studies) |
| AI coding tool ROI at accessible starting price | Typo | Specialized Cursor and Claude Code tracking; starting at $15/user/month; free version | Jellyfish (multi-vendor AI tracking; higher price point) |
| Developer trust as non-negotiable adoption constraint | Swarmia | Team-level-only design; working agreements; SPACE surveys; anti-surveillance philosophy | Typo (anonymous surveys; $15/user/month starting price) |
| UK or EU organization with GDPR requirements | Plandek | UK-native HQ; GDPR-aligned architecture | Swarmia (European-friendly data handling) |
| Free evaluation before committing budget | LinearB | Permanent free DORA metrics tier with unlimited contributors | Swarmia (14-day free trial without mandatory demo call) |
| Budget-accessible entry point | Typo | Starting at $15/user/month publicly listed; free version available | Swarmia (free startup plan; paid tier pricing on request) |
| First analytics investment for growth-stage CTO | LinearB (free DORA tier) or Typo (free version) | Validate that your team will use analytics before committing enterprise pricing | Swarmia (14-day free trial, no mandatory demo) |
| Organization previously using Pluralsight Flow | Appfire Flow | Appfire acquired Flow from Pluralsight on February 5, 2025; same analytics foundation under new ownership and investment | LinearB (if GitHub-centric; DORA + automation) |
1. Appfire Flow: Best for Jira and Azure DevOps Organizations, Strongest Publicly Named Case Study Evidence
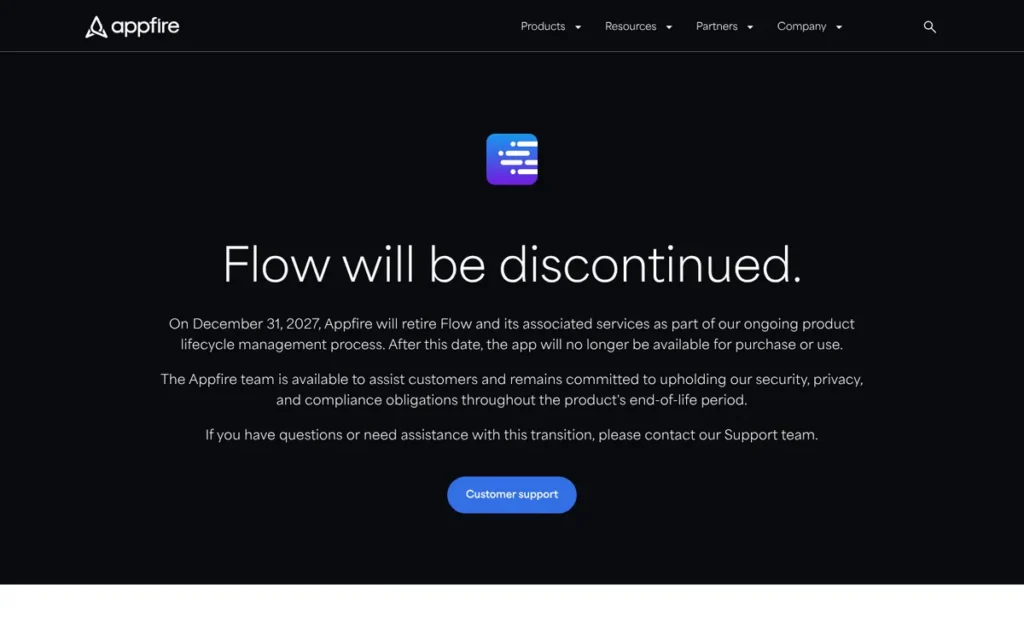
Category: Delivery Analytics, measures how engineering work flows from planning to deployment using Mik Kersten’s five flow metrics and DORA frameworks, with emphasis on value stream visibility and quantified delivery performance improvement.
At a Glance
- Category: Delivery Analytics
- Best For: Engineering leaders at Jira- or Azure DevOps-centric organizations with 50 or more engineers needing enterprise-grade delivery analytics with publicly named, requestable case study evidence for executive stakeholders
- Price Range: $50/user/month; Flow Plus tier at $599 on AWS Marketplace (verified June 2026)
- Primary Strength: Appfire Flow is the only platform in this review with two publicly named, requestable enterprise case studies (Lightspeed (35% cycle-time reduction, 14-hour drop in PR merge time) and BNY Mellon) both available on Appfire’s resource library for direct buyer reference
- Biggest Limitation: Appfire Flow’s $50/user/month pricing is the highest per-seat cost in this review, and its analytics framework delivers maximum value only for organizations standardized on Jira or Azure DevOps workflows
- One-Line Summary: Appfire Flow is a delivery intelligence platform for Jira- and Azure DevOps-centric teams (acquired from Pluralsight by Appfire in February 2025) combining five flow metrics with DORA analytics and backed by two publicly named enterprise case studies
- Last Verified: June 2026
Overview
Appfire Flow is a standalone SaaS engineering intelligence platform, acquired by Appfire from Pluralsight on February 5, 2025 (PRNewswire, February 2025), that connects GitHub, Jira, and Azure DevOps data into flow metrics and DORA dashboards for engineering leaders at Jira- or Azure DevOps-centric organizations with 50 or more engineers.
Appfire Flow carries the enterprise deployment history of its predecessor, Pluralsight Flow, a product with multi-year adoption at engineering organizations before the February 2025 Appfire acquisition. Engineering leaders who previously evaluated Pluralsight Flow are evaluating a familiar analytics foundation under new ownership and investment.
Appfire Flow’s analytics framework is built on Mik Kersten’s five flow metrics (flow velocity, flow time, flow efficiency, flow load, and flow distribution) plus the four DORA metrics, providing a value-stream-aligned view of delivery performance that DORA-only platforms cannot replicate.
Key Features
- Five Flow Metrics Framework: Appfire Flow tracks flow velocity, flow time, flow efficiency, flow load, and flow distribution, providing a value stream view of delivery performance that complements DORA metrics with work-type distribution analysis across features, bugs, technical debt, and risk (Appfire Flow resources blog, June 2026).
- Dual-Ecosystem Native Integration: Appfire Flow integrates natively with GitHub, Jira, and Azure DevOps in a single platform (Appfire Flow product page, June 2026), making it the only tool in this review to serve both Atlassian and Microsoft enterprise toolchain environments without requiring custom connectors or separate integration work.
- Dual-Audience Reporting: Appfire Flow delivers both team-level operational dashboards for engineering managers and consolidated executive-level reporting for VPs of Engineering, enabling front-line delivery management and strategic portfolio oversight from a unified data layer (Appfire documentation, June 2026).
- SAFe Framework Alignment: Appfire Flow’s five flow metrics framework directly addresses SAFe and enterprise agile delivery practices, making it applicable to large engineering organizations running program-level planning and Program Increment cadences.
- AWS Marketplace Availability: Appfire Flow is available on AWS Marketplace at $50/user/month (verified June 2026), enabling organizations with committed AWS spend to purchase through an existing procurement channel without a separate contract negotiation.
Best For
Appfire Flow is best for engineering organizations of 50 or more engineers already standardized on Jira or Azure DevOps, operating within a SAFe or enterprise agile delivery framework, and needing both delivery flow analytics and the ability to present publicly named, requestable case study evidence (specifically quantified delivery improvements) to executive stakeholders and boards.
Strengths
- Two Publicly Named Enterprise Case Studies: Strongest in This Review: Appfire Flow’s resource library includes a Lightspeed case study documenting a 35% cycle-time reduction and a 14-hour drop in PR merge time, and a separate BNY Mellon case study, both publicly named and available at appfire.com (June 2026) for direct buyer follow-up. Note: Appfire’s video case study content states higher figures (93% faster time to merge, 43% cycle-time improvement); buyers should review the written customer-story page and request Lightspeed’s reference contact from Appfire for independent verification before treating either figure set as audited results.
- Only Dual-Ecosystem Native Integration in This Review: Appfire Flow’s native integration with GitHub plus Jira (Atlassian ecosystem) and GitHub plus Azure DevOps (Microsoft ecosystem) fills a documented gap for organizations running hybrid toolchains, a capability that LinearB (GitHub-first) and Swarmia (GitHub plus Jira) do not match for Azure DevOps-heavy organizations (Appfire Flow product page, June 2026).
- Backed by Appfire with a Deliberate Engineering Tooling Acquisition Strategy: Appfire Flow is backed by Appfire, a Silversmith Capital-funded company that previously acquired 7pace (a leading Azure DevOps time tracking tool) in September 2022 (BusinessWire, September 2022), demonstrating the financial resources and strategic intent to invest in post-acquisition product development.
- Flow Metrics Framework Aligned with SAFe Delivery Practices: Appfire Flow’s five flow metrics (from Mik Kersten’s Project to Product) address value stream delivery visibility, a measurement paradigm aligned with how SAFe-certified engineering organizations define delivery performance, and a dimension that DORA-only platforms structurally cannot serve (Appfire resources blog, June 2026).
Limitations
- Pricing Premium vs. the Category: Appfire Flow’s $50/user/month rate is 3.3× more than Typo’s starting price ($15/user/month) and meaningfully above estimated alternatives, which may place Appfire Flow out of budget range for growth-stage engineering teams or organizations without a pre-existing Appfire vendor relationship.
- Jira and Azure DevOps Dependency Limits Fit: Appfire Flow delivers maximum value within Jira- or Azure DevOps-standardized environments, engineering teams on GitHub-native project management (GitHub Issues, Linear, Shortcut) or GitLab-centric workflows will find the integration story significantly less compelling than Jira and ADO-native organizations.
- Case Study Figure Discrepancy Requires Direct Buyer Verification: Appfire Flow’s Lightspeed case study reports different outcomes across Appfire’s video content (93% faster time to merge, 43% cycle-time improvement) and Appfire’s written customer-story page (35% cycle-time reduction, 14-hour PR merge time drop); buyers should review both sources at appfire.com and request Lightspeed’s direct reference contact from Appfire before treating either figure set as independently audited results.
- Limited AI Coding Tool Measurement vs. Competitors: Appfire Flow offers limited documented capability for measuring AI coding tool ROI (GitHub Copilot, Cursor, Claude Code) compared to Jellyfish, Waydev, and Typo, engineering teams whose primary measurement requirement is AI tool productivity should evaluate those platforms before Appfire Flow.
Verdict
Appfire Flow is the software development analytics platform with two publicly named, requestable enterprise case studies in this review (Lightspeed and BNY Mellon, both available on Appfire’s resource library) giving it the most independently verifiable delivery improvement evidence of the seven platforms evaluated. Appfire Flow’s native Jira plus Azure DevOps plus GitHub integration addresses the dual-ecosystem challenge affecting most enterprise engineering organizations, and its Pluralsight Flow heritage provides deeper enterprise deployment history than a 2025 launch date implies. Its $50/user/month pricing is a significant commitment; buyers should request the Lightspeed reference contact directly from Appfire and review the written customer-story page rather than the video for the most citable outcome figures before signing.
2. Waydev: Best for Enterprise Scale, Broadest Metrics Coverage with Fortune 500 Validation
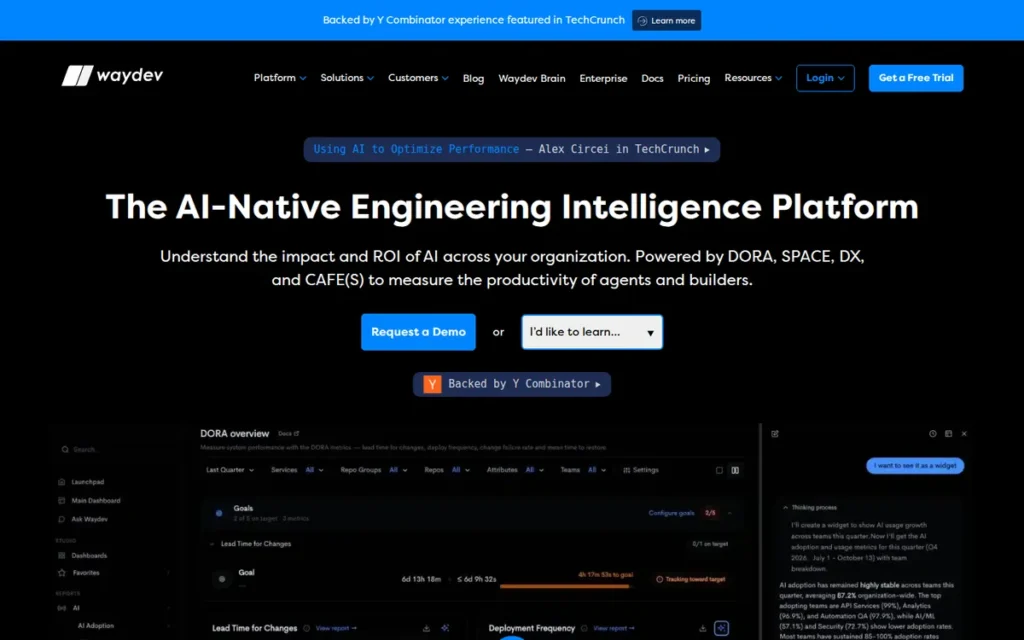
Category: Enterprise Engineering Intelligence, comprehensive analytics platform tracking 130+ metrics across DORA, SPACE, Git, and AI-generated code dimensions for Fortune 500-scale engineering organizations requiring the broadest available measurement framework.
At a Glance
- Category: Enterprise Engineering Intelligence
- Best For: Enterprise engineering organizations with 150 or more engineers operating multi-VCS environments and needing the broadest available metrics framework with Fortune 500-grade security and Y Combinator-backed product stability
- Price Range: Pricing on request: not publicly disclosed; third-party sources describe as premium enterprise pricing (verified June 2026)
- Primary Strength: Waydev is a Y Combinator-backed engineering intelligence platform, founded in 2017, with a 4.4/5.0 G2 rating across 40 verified reviews and listed deployments at Fortune 500 companies including American Express, Dropbox, and Citibank, offering 130+ metrics spanning DORA, SPACE, Git analytics, and AI-generated code tracking
- Biggest Limitation: Waydev’s 130+ metrics create significant onboarding complexity and data overload risk (a practitioner in r/SoftwareEngineering described Waydev’s onboarding as “a nightmare”) and premium pricing without public disclosure makes budget planning impossible without a sales engagement
- One-Line Summary: Waydev is a Y Combinator-backed enterprise engineering intelligence platform, founded in 2017, covering 130+ metrics with a 4.4/5.0 G2 rating and listed deployments at Fortune 500 companies including American Express, Dropbox, and Citibank
- Last Verified: June 2026
Overview
Waydev is a Y Combinator-backed software engineering intelligence platform, founded in 2017, that provides 130+ metrics across DORA, SPACE, Git analytics, sprint reporting, code review, and AI-generated code tracking for enterprise engineering organizations requiring the broadest available measurement framework on a single platform.
Waydev holds a 4.4/5.0 rating across 40 verified G2 reviews in the Software Development Analytics Tools category (G2 listing, June 2026). Waydev lists American Express, Dropbox, Citibank, Caterpillar, and PwC as customers on its G2 product listing and company website (June 2026), customer relationships are self-reported and have not been independently confirmed through separate customer press releases.
Waydev’s 2026 platform evolution adds AI-native capabilities including conversational analytics interfaces and automatic mapping of engineering activity to business outcomes, positioning Waydev as an AI-augmented business intelligence layer for enterprise engineering (Waydev AI intelligence platform page, June 2026).
Key Features
- 130+ Metric Framework Spanning DORA, SPACE, and Git Analytics: Waydev tracks DORA (deployment frequency, lead time, change failure rate, MTTR), SPACE (satisfaction, performance, activity, collaboration, efficiency), cycle time, merge time, PR analytics, code churn, individual and team contribution breakdowns, and AI coding pattern tracking, the broadest single-platform measurement framework in this review (Waydev features, June 2026).
- Full Multi-VCS Integration Across All Four Major Platforms: Waydev integrates with GitHub, GitLab, Azure DevOps, and Bitbucket (Waydev features documentation, June 2026), making it the only tool in this review with full multi-VCS coverage for organizations managing legacy GitLab installations alongside newer GitHub or Azure DevOps environments.
- AI-Native Engineering Intelligence Roadmap: Waydev’s 2026 roadmap includes conversational analytics interfaces (natural language queries against engineering data), automatic mapping of engineering activity to business outcomes, and AI code generation pattern tracking to measure AI coding tool adoption and impact (Waydev AI page, June 2026).
- Individual and Team-Level Contribution Analytics: Waydev provides both individual-level and team-level contribution analytics, enabling engineering leaders to drill from portfolio-level delivery trends down to engineer-level activity, a granularity serving enterprise accountability requirements while requiring explicit change management to prevent surveillance-perception adoption failures.
- Enterprise Security for Regulated Industries: Waydev’s active listing at financial services firms including American Express and Citibank (G2 listing, June 2026) signals the enterprise SOC 2 and data governance infrastructure required for regulated industry deployments.
Best For
Waydev is best for engineering organizations with 150 or more engineers, heterogeneous multi-VCS environments (GitHub plus GitLab, or Azure DevOps plus Bitbucket), and dedicated analytics or platform engineering staff who can manage the configuration required to extract value from 130+ available data points without entering metric overload.
Strengths
- Y Combinator Backing and Longest Operating History in This Review: Waydev is backed by Y Combinator and was founded in 2017 (the longest operating history among the seven tools in this review) with a 4.4/5.0 G2 rating across 40 verified reviews and listed deployments at American Express, Dropbox, and Citibank (G2 listing and Ballast Lane company profile, June 2026), providing the strongest combined enterprise validation and financial stability signal in the category.
- 130+ Metric Framework: Broadest in This Review: Waydev’s 130+ metric coverage spans DORA, SPACE, Git analytics, sprint reporting, code review, individual and team contribution breakdowns, and AI-generated code pattern tracking (Waydev features page, June 2026), enabling organizations with complex, multi-dimensional analytics requirements to consolidate measurement on a single platform.
- Full Multi-VCS Coverage Across All Four Major Platforms: Waydev’s integration across GitHub, GitLab, Azure DevOps, and Bitbucket (Waydev features documentation, June 2026) is a decisive advantage for enterprise organizations with heterogeneous source control environments, a requirement that GitHub-first tools LinearB and Swarmia cannot fulfill.
- AI-Native Roadmap Addressing the 2025–2026 AI ROI Mandate: Waydev’s AI-native roadmap, including AI conversational analytics and AI code generation pattern tracking (Waydev AI intelligence platform page, June 2026), directly addresses the enterprise mandate to measure AI coding tool ROI, positioning Waydev for the ongoing shift toward AI-augmented software development workflows.
Limitations
- Onboarding Complexity Creates Adoption Risk: Waydev’s most consequential trade-off is the gap between metric breadth and analytical clarity, a practitioner in r/SoftwareEngineering specifically described Waydev’s onboarding as “a nightmare” (u/TCmotivation, r/SoftwareEngineering, 2023), and the same 130+ metrics that attract enterprise architects create configuration complexity that less analytically mature teams cannot absorb productively.
- Pricing Opacity Blocks Budget Planning: Waydev’s absence of public pricing means budget planning requires a full sales engagement before any independent product evaluation can begin, a friction point that Typo (starting $15/user/month) and Appfire Flow ($50/user/month) do not impose on prospective buyers.
- Surveillance Perception Risk from Individual-Level Analytics: Waydev’s individual-level contribution analytics create documented adoption risk, the r/SoftwareEngineering community has specifically described individual performance tracking as “dangerous” when applied without proper governance (r/SoftwareEngineering, 2023), and teams deploying Waydev without explicit developer communication strategies should expect metric-gaming behavior as a documented risk regardless of product quality.
- Data Overload Without Dedicated Analytics Staff: Waydev’s breadth advantage becomes a limitation without clear internal prioritization, third-party analysis notes Waydev creates data overload risk for teams wanting simpler, more opinionated dashboards (getdx.com analysis, June 2026), and onboarding without dedicated analytics engineers frequently results in teams using a fraction of available capabilities.
Verdict
Waydev is the engineering intelligence platform with the broadest published metric framework in this review (130+ metrics across DORA, SPACE, and Git analytics) backed by Y Combinator, an 8-year operating history, and a 4.4/5.0 G2 rating across deployments at Fortune 500 enterprises including American Express and Dropbox, making it the strongest choice for large engineering organizations needing measurement breadth and enterprise validation from a proven, long-tenured vendor. Waydev’s value is most accessible to organizations with 150 or more engineers, dedicated analytics staff to manage configuration complexity, and explicit change management plans to prevent developer resistance to its granular individual-level tracking. Engineering leaders at growth-stage companies or teams without analytics infrastructure should evaluate LinearB, Swarmia, or Typo before committing to Waydev’s premium price point and onboarding investment requirements.
3. LinearB: Best for Workflow Automation, Metrics Plus Active Bottleneck Resolution
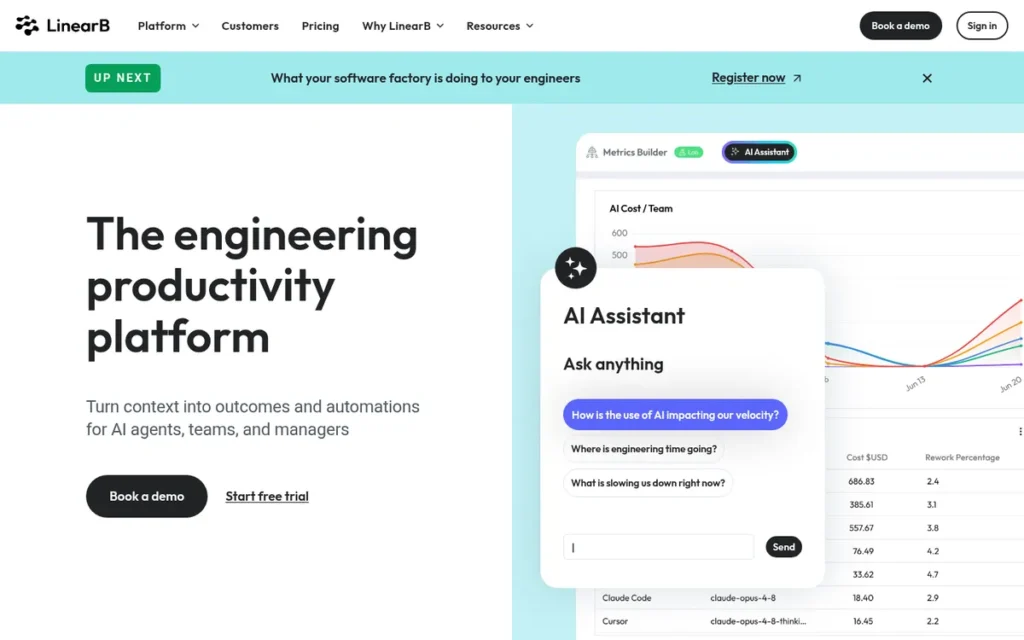
Category: Workflow Automation + Analytics, combines DORA metrics and cycle time analytics with programmable PR workflow automation to both identify delivery bottlenecks and actively resolve them without requiring manual developer intervention.
At a Glance
- Category: Workflow Automation + Analytics
- Best For: Engineering managers at GitHub-centric teams of 20 to 200 engineers who want a platform that actively reduces PR workflow bottlenecks (not just surfaces them) alongside delivery dashboards
- Price Range: Free DORA metrics tier (unlimited contributors); paid workflow automation tier pricing not publicly disclosed (verified June 2026)
- Primary Strength: LinearB is rated Trial on the Thoughtworks Technology Radar (October 2024, having progressed from Assess in April 2024) and is the only platform in this review with a programmable PR workflow automation engine (GitStream) that actively reduces cycle time without requiring developers to manually monitor dashboards
- Biggest Limitation: LinearB’s workflow automation model adds significant implementation and configuration complexity, and community practitioners in r/devops flag LinearB as a potential micromanagement instrument when deployed without an explicit developer buy-in strategy
- One-Line Summary: LinearB is a Thoughtworks Technology Radar Trial-rated engineering intelligence platform (October 2024) that uniquely combines DORA metrics and cycle time analytics with programmable PR workflow automation (GitStream), the only tool in this review that both measures delivery bottlenecks and actively resolves them
- Last Verified: June 2026
Overview
LinearB is an engineering intelligence platform, rated Trial on the Thoughtworks Technology Radar as of October 2024 (having progressed from Assess in April 2024) that combines DORA metrics, sub-stage cycle time decomposition, and programmable PR workflow automation (GitStream) for engineering managers at GitHub-centric teams of 20 to 200 engineers.
LinearB’s core differentiator is that LinearB does not stop at surfacing delivery bottlenecks. LinearB’s GitStream engine enables automatic PR routing, auto-merge policies, and CI/CD gating that resolve the bottlenecks the analytics layer identifies, making LinearB the only tool in this review positioned as a behavioral change platform rather than a passive observability dashboard.
LinearB also offers a permanent free DORA metrics tier with unlimited contributors (PRNewswire, DevOps Enterprise Summit 2023) and has expanded into AI code review and GenAI governance and ROI tracking as of 2024–2025.
Key Features
- GitStream PR Workflow Automation Engine: LinearB’s GitStream engine enables programmable PR workflow automation (including review routing rules, auto-merge policies, and CI/CD gating) that automatically reduces pickup time and review time without requiring engineers to monitor delivery dashboards manually, addressing the gap between knowing about a bottleneck and having tools to resolve it.
- Sub-Stage Cycle Time Decomposition: LinearB tracks the four DORA metrics plus sub-stage cycle time, coding time, pickup time, and review time (LinearB DORA metrics platform page, June 2026), enabling engineering managers to diagnose exactly where in the PR lifecycle work gets stuck rather than only seeing aggregate cycle time figures.
- WorkerB Slack-Native Developer Bot: LinearB includes WorkerB, a Slack-native developer bot that delivers delivery insights, PR reminders, and workflow guidance directly in the tools developers already use, reducing the behavior change required to adopt analytics and integrating LinearB into existing developer communication workflows.
- Permanent Free DORA Metrics Entry Tier: LinearB offers a free DORA metrics dashboard with unlimited contributors (PRNewswire, DevOps Enterprise Summit 2023), providing a genuine evaluation path without requiring budget commitment or mandatory sales engagement before product access.
- AI Code Review and GenAI Governance: LinearB has expanded into AI code review and GenAI governance and ROI tracking, enabling engineering leaders to measure the productivity and quality impact of AI coding tools within the same platform managing their delivery metrics.
Best For
LinearB is best for engineering managers at GitHub-centric teams of 20 to 200 engineers who have already tried passive analytics dashboards and found that identifying bottlenecks is insufficient, teams who specifically need a platform that actively intervenes in PR workflow to reduce cycle time, and who are willing to invest in GitStream configuration to unlock the automation layer’s full value.
Strengths
- Thoughtworks Technology Radar Trial Rating: Progressed in a Single Radar Cycle: LinearB is rated Trial on the Thoughtworks Technology Radar as of October 2024, having progressed from Assess in April 2024 (Thoughtworks Technology Radar, Vol. 31), Trial indicates Thoughtworks considers LinearB ready for real-world use, one tier below their highest Adopt recommendation, and the progression in a single Radar cycle is a positive signal of accelerating architectural maturity.
- Only Tool That Both Measures and Actively Resolves PR Bottlenecks: LinearB’s programmable PR automation layer (GitStream) addresses the fundamental limitation of all other platforms in this review, knowing that cycle time is too long is only useful if you can act on it, and LinearB is the only tool in this review that both identifies PR workflow bottlenecks through analytics and actively resolves them through programmable automation rules without manual developer intervention.
- Sub-Stage Diagnostic Precision Beyond Aggregate DORA: LinearB’s sub-stage cycle time decomposition, coding time, pickup time, and review time (LinearB platform page, June 2026), provides more diagnostic precision than tools reporting aggregate cycle time, enabling engineering managers to distinguish between too-large PRs, slow reviewers, and review backlogs before prescribing interventions.
- Lowest-Friction Evaluation Pathway in This Review: LinearB’s permanent free DORA metrics tier with unlimited contributors (PRNewswire, 2023) enables teams to verify analytical value before committing to paid automation features, a lower-risk evaluation pathway than competitors requiring full sales engagement before any product access.
Limitations
- Configuration Complexity of the Automation Layer: LinearB’s automation model adds significant implementation and configuration complexity relative to simpler observational tools, engineering teams deploying GitStream must invest in defining and maintaining PR routing rules, auto-merge policies, and CI/CD gating logic, requiring dedicated engineering time that smaller teams may not have available without creating competing priorities.
- Micromanagement Perception Risk Without Developer Buy-In: A practitioner in r/devops noted that LinearB feels like “senior leadership scrutinizing performance without understanding the day-to-day” when deployed without explicit developer communication (u/mcgerin, r/devops, 2025), and LinearB’s automation layer is not immune to the gaming behavior practitioners report when engineers feel individually monitored.
- GitHub-Native Architecture Limits Multi-VCS Applicability: LinearB is primarily GitHub-native, teams on GitLab, Azure DevOps, or Bitbucket will find its integration story significantly weaker than Waydev’s full multi-VCS coverage or Appfire Flow’s native Jira plus Azure DevOps support, making LinearB a poor fit for enterprises with heterogeneous source control environments.
- Paid-Tier Pricing Opacity: LinearB’s paid-tier pricing opacity means total cost of ownership cannot be assessed without a sales engagement, complicating budget planning for organizations with fixed annual tooling budgets that need to compare LinearB’s full cost against transparent alternatives like Appfire Flow ($50/user/month).
Verdict
LinearB is the only software development analytics tool in this review that both measures delivery bottlenecks and actively resolves them through its GitStream PR workflow automation engine, endorsed at the Trial level by the Thoughtworks Technology Radar as of October 2024, having progressed from Assess in April 2024. LinearB’s GitHub-centric architecture limits its appeal for multi-VCS enterprises, and its automation model requires configuration investment that smaller teams should weigh honestly before committing beyond the free tier. Teams seeking developer-trust-first analytics without automation complexity should evaluate Swarmia; teams needing multi-VCS enterprise coverage should evaluate Waydev.
4. Jellyfish: Best for Executive Reporting, Business-to-Engineering Alignment with Work Classification Algorithms
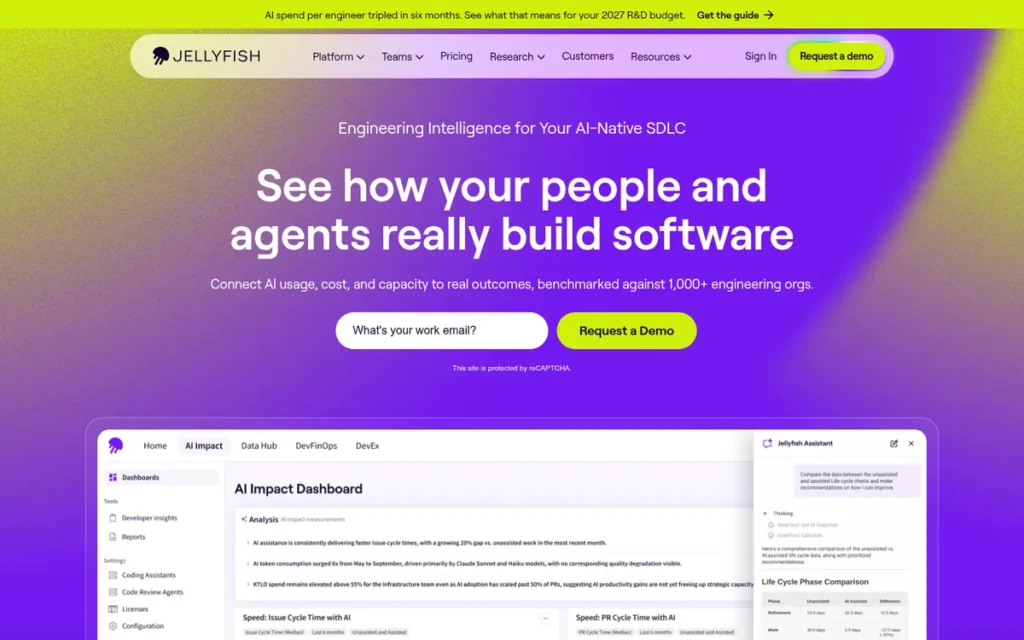
Category: Business-Aligned Engineering Intelligence, connects engineering activity data to business outcomes (investment allocation, OKR progress, AI tool ROI) using algorithms described as patented for work classification, designed primarily for executive-level engineering investment reporting.
At a Glance
- Category: Business-Aligned Engineering Intelligence
- Best For: CTOs and VPs of Engineering at organizations with 100 or more engineers who need to connect engineering investment to business outcomes, justify AI coding tool spend to CFOs and boards, and allocate engineering capacity with measurable algorithmic evidence
- Price Range: Pricing on request: enterprise sales-led model, not publicly disclosed (verified June 2026)
- Primary Strength: Jellyfish held the G2 Leader position in the Software Development Analytics Tools category for 11 consecutive quarters as of Spring 2025, serves 700+ enterprise customers including DraftKings, Keller Williams, and Blue Yonder, and tracks AI coding tool ROI vendor-neutrally across GitHub Copilot, Cursor, Claude Code, and Amazon Q
- Biggest Limitation: Jellyfish’s business-alignment focus makes it primarily valuable for executive stakeholders, community practitioners and third-party reviewers consistently describe Jellyfish as a tool engineering teams experience as surveillance-framed executive reporting rather than a developer improvement instrument
- One-Line Summary: Jellyfish is a Boston-based software engineering intelligence platform (~founded 2018) that held the G2 Leader position for 11 consecutive quarters (Spring 2025) and serves 700+ enterprises with work classification algorithms and vendor-neutral AI coding tool ROI measurement across Copilot, Cursor, Claude Code, and Amazon Q
- Last Verified: June 2026
Overview
Jellyfish is a software engineering intelligence platform, founded approximately 2018 and headquartered in Boston, Massachusetts, that combines Git, Jira, and CI/CD data with developer sentiment to connect engineering activity to business outcomes for CTOs and VPs of Engineering at organizations with 100 or more engineers.
Jellyfish’s core technical differentiator is its work classification algorithm, which Jellyfish describes as a patented unified model, per its own product documentation and a VentureFizz company profile interview (2025). No patent filing number was independently confirmed through this research; buyers for whom patent status is material should request documentation directly from Jellyfish. Jellyfish automatically categorizes engineering effort into innovation, technical debt, bug fixes, and delivery speed without requiring consistent Jira ticket labeling.
Jellyfish held the G2 Leader position in the Software Development Analytics Tools category for 11 consecutive quarters as of Spring 2025 (Jellyfish newsroom, 2025) and has expanded to measure the ROI of AI coding tools including GitHub Copilot, Cursor, Claude Code, and Amazon Q (DevOps Digest, 2025).
Key Features
- Work Classification Algorithms for Investment Allocation: Jellyfish applies algorithms described as a patented unified model to automatically classify engineering work into investment categories (innovation, tech debt, bug fixes, and delivery speed) without requiring engineering teams to maintain consistent Jira ticket labeling conventions, addressing a widespread data quality problem in large engineering organizations at scale.
- Vendor-Neutral Multi-Tool AI Coding ROI Measurement: Jellyfish tracks the productivity and quality impact of AI coding tools vendor-neutrally, measuring GitHub Copilot, Cursor, Claude Code, and Amazon Q within a single platform (DevOps Digest, 2025), enabling engineering leaders to compare AI tool effectiveness across vendors without a separate measurement platform for each assistant.
- Business Outcomes Mapping for Executive Stakeholders: Jellyfish maps engineering team activity to business outcomes including OKR progress, roadmap velocity, and AI tool ROI, enabling executive stakeholders to connect engineering investment to strategic priorities rather than relying on proxy metrics like story points or deployment frequency alone.
- Combined System and Developer Sentiment Data: Jellyfish ingests data from Git, Jira, CI/CD tools, and developer experience surveys, combining system-generated telemetry with human-reported sentiment to produce a view of engineering health that quantitative delivery metrics alone cannot capture.
- Multi-Team Portfolio Executive Reporting: Jellyfish is designed for multi-team, multi-product engineering organizations, with portfolio-level reporting that allows VPs of Engineering to compare delivery performance, investment allocation, and AI tool adoption across multiple product lines in a single consolidated executive view.
Best For
Jellyfish is best for CTOs and VPs of Engineering at companies with 100 or more engineers who regularly need to present engineering investment justification to CFOs and boards, allocate engineering capacity across strategic initiatives with algorithmic precision, and demonstrate ROI from AI coding tool investments across multiple vendors, requirements that Jellyfish’s work classification approach directly addresses.
Strengths
- Eleven-Quarter G2 Leader Tenure: Strongest Sustained Review Platform Signal in This Review: Jellyfish held the G2 Leader position in the Software Development Analytics Tools category for 11 consecutive quarters as of Spring 2025 (Jellyfish newsroom, 2025), the longest sustained G2 category leadership among the tools in this review, indicating consistent peer-evaluated performance excellence over a multi-year period.
- Largest Named Customer Count in This Review, 700+ Enterprises: Jellyfish serves 700+ companies including DraftKings, Keller Williams, and Blue Yonder (Jellyfish newsroom and VentureFizz, June 2026), the largest confirmed named customer count in this review, spanning fintech, real estate tech, and enterprise software verticals.
- Broadest Multi-Vendor AI Coding Tool Measurement in This Review: Jellyfish tracks AI coding tool ROI vendor-neutrally across GitHub Copilot, Cursor, Claude Code, and Amazon Q (DevOps Digest, 2025), the most comprehensive multi-vendor AI measurement in this review, addressing the board-level AI investment justification mandate that emerged as a top priority in 2025–2026.
- Seven-Plus Years of Enterprise Deployment History: Jellyfish has operated for 7+ years (founded approximately 2018, VentureFizz, 2025), giving it the second-longest enterprise deployment track record in this review alongside Waydev, a meaningful stability signal for organizations making multi-year analytics platform commitments.
Limitations
- Executive-First Design Creates Team-Level Gap: Jellyfish’s most consequential trade-off is its audience misalignment risk, OpsLevel’s independent analysis positions Jellyfish as stronger for portfolio-level investment visibility than for engineering-team-level improvement, a real limitation for organizations whose primary need is front-line delivery optimization rather than executive reporting.
- Practitioner Surveillance Perception Is Documented: A practitioner in r/devops explicitly named Jellyfish as a tool that feels like “senior leadership scrutinizing performance and making decisions without understanding the day-to-day” (u/mcgerin, r/devops, 2025), a documented adoption risk for engineering leaders who need developer buy-in alongside executive reporting value.
- Pricing Opacity Blocks Budget Planning: Jellyfish’s pricing opacity combined with its enterprise-only positioning means growth-stage engineering teams should expect pricing above their budget range without explicit confirmation from a sales conversation, adding evaluation friction before budget fit can be assessed.
- Limited Named Case Study Evidence Compared to Appfire Flow: Jellyfish’s published case study evidence consists primarily of testimonials hosted on Jellyfish’s own website without named customers and independently verifiable percentage outcomes, a meaningful evidence gap for regulated-industry procurement teams, particularly compared to Appfire Flow’s publicly named and requestable case studies with specific outcome figures; buyers should request named references directly from Jellyfish.
Users on r/devops shared their evaluation experience with Jellyfish:
“Short answer: usually no. We evaluated Jellyfish and the price was astronomical for what it offered. It was basically just pretty DORA metrics. The reports were so rigid that we couldn’t even customize them for our specific use cases. We felt like we were paying a premium for a dashboard we couldn’t even control.” Posted by u/sharpiescribe
Takeaway: Jellyfish’s executive-first architecture creates a customization gap that makes the platform expensive and inflexible for teams with operational rather than board-level reporting requirements.
Verdict
Jellyfish is the engineering intelligence platform most purpose-built for board-level engineering investment justification, with an 11-quarter G2 Leader tenure (Spring 2025), 700+ enterprise customers, and vendor-neutral AI coding tool ROI measurement across Copilot, Cursor, Claude Code, and Amazon Q. Jellyfish’s value is concentrated at the executive layer; engineering leaders who need equal value for front-line engineering managers and individual developers should weigh this architectural limitation carefully before committing. For teams whose primary analytics requirement is developer experience improvement or active delivery bottleneck resolution, Swarmia and LinearB deliver higher developer trust with lower adoption friction.
5. Plandek: Best for Delivery Forecasting, Broadest Multi-Framework Coverage with Predictive Analytics
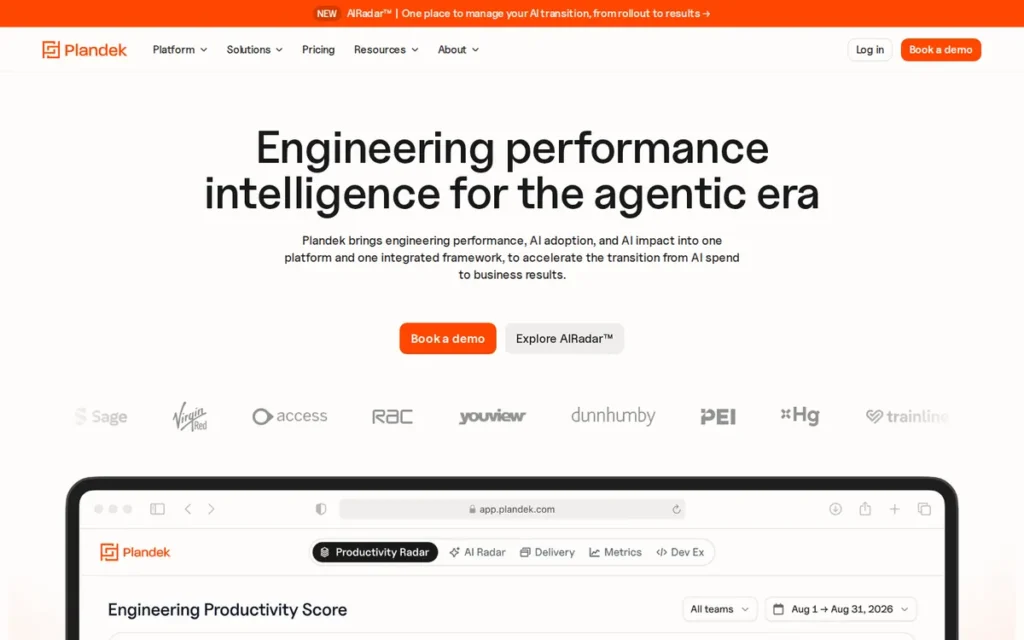
Category: Delivery Forecasting + Analytics, comprehensive delivery intelligence platform covering flow metrics, DORA, and Scrum frameworks simultaneously, with AI-powered predictive risk forecasting and multi-level organizational hierarchy support.
At a Glance
- Category: Delivery Forecasting + Analytics
- Best For: Engineering leaders at organizations with 50 or more engineers who need both retrospective delivery analytics and forward-looking delivery risk forecasting, particularly UK and European enterprises with data sovereignty requirements or organizations running SAFe or scaled agile programs
- Price Range: Pricing on request: custom enterprise pricing, not publicly disclosed (verified June 2026)
- Primary Strength: Plandek is the G2 Top Trending Product in the Software Development Analytics Tools category as of June 1, 2026, recording the largest month-over-month rating increase in the category (+0.007), and the only platform in this review simultaneously covering flow metrics, DORA, and Scrum with AI-powered predictive delivery risk forecasting
- Biggest Limitation: Plandek’s pricing is not publicly disclosed (custom quote only), limiting budget planning without a sales engagement, and its publicly available named case study portfolio is more limited than the top-four competitors in this review
- One-Line Summary: Plandek is a UK-based delivery forecasting and analytics platform, co-founded by Dan Lee and Philip Dimbleby, recognized as the G2 Top Trending Product in June 2026 (largest category rating increase, +0.007), uniquely covering flow metrics, DORA, and Scrum simultaneously with AI-powered predictive delivery risk forecasting
- Last Verified: June 2026
Overview
Plandek is a UK-based engineering analytics platform, co-founded by Dan Lee and Philip Dimbleby, that unifies Jira, Git, CI/CD, and delivery toolchain data into real-time flow metrics, DORA metrics, Scrum analytics, and AI-powered predictive delivery forecasting for engineering leaders managing 50 or more engineers across SAFe or scaled agile programs.
Plandek is recognized as the G2 Top Trending Product in the Software Development Analytics Tools category as of June 1, 2026, recording the largest month-over-month rating increase in the category (+0.007) (G2 category page, June 2026), a signal of accelerating adoption and growing product-market fit.
Plandek’s simultaneous coverage of all three major engineering analytics frameworks (flow metrics, DORA, and Scrum) combined with AI-powered predictive risk forecasting and multi-level organizational hierarchy analytics makes Plandek the most analytically comprehensive delivery intelligence platform in this review for mature engineering organizations.
Key Features
- Triple-Framework Coverage: Flow + DORA + Scrum Simultaneously: Plandek simultaneously tracks all three major engineering analytics frameworks, Mik Kersten’s five flow metrics, the four Google DORA metrics, and Scrum sprint metrics including sprint velocity and sprint health (Capterra listing, June 2026), making it the only platform in this review natively covering all three paradigms without requiring separate tools.
- AI-Powered Predictive Delivery Analytics: Plandek’s predictive analytics engine forecasts delivery risk, reforecasts project completion dates, and surfaces early warning signals before teams miss commitments (QKS Group platform analysis, June 2026), transforming Plandek from a retrospective reporting tool into a forward-looking delivery planning and risk management instrument.
- Multi-Level Organizational Analytics Hierarchy: Plandek provides analytics at four organizational levels (organization, program, project, and team) enabling CTOs to review portfolio-level delivery trends while engineering managers access team-level sprint health and bottleneck data from the same platform without requiring different tools for different management layers.
- Jira and Azure DevOps Integration for Full Value Stream Visibility: Plandek integrates with Jira, Azure DevOps, and Git platforms (Plandek homepage, June 2026), connecting project management and source control data into a unified delivery intelligence view covering the full value stream from backlog to production.
- GDPR-Compliant UK Architecture for EU Organizations: Plandek is headquartered in the UK and designed for GDPR compliance and EU data sovereignty requirements (Plandek homepage, June 2026), providing a compliance advantage for European engineering organizations that must meet data residency obligations that US-headquartered alternatives address only through contractual addendums.
Best For
Plandek is best for engineering organizations with 50 or more engineers that have mature delivery practices, run SAFe or scaled agile programs requiring program-increment-level visibility, and need both retrospective delivery analytics and forward-looking risk forecasting, particularly UK and European enterprises with GDPR-compliant data residency requirements that create compliance advantages over US-headquartered competitors.
Strengths
- G2 Top Trending Product with Quantified Rating Increase: Plandek is recognized as the G2 Top Trending Product in the Software Development Analytics Tools category as of June 1, 2026, recording the largest month-over-month rating increase in the category (+0.007) (G2 category page, June 2026), a leading indicator of accelerating product-market fit that distinguishes Plandek from lower-visibility competitors in the same tier.
- Broadest Multi-Framework Coverage in This Review: Plandek’s simultaneous coverage of flow metrics, DORA, and Scrum analytics within a single platform (Capterra verified reviews, June 2026) eliminates the tool sprawl that organizations face when deploying separate platforms for each delivery framework, a consolidation benefit no other tool in this review matches across all three paradigms.
- AI-Powered Predictive Delivery Forecasting Transforms Retrospective Reporting: Plandek’s AI-powered predictive delivery analytics, including delivery risk forecasting and reforecast completion dates (QKS Group platform analysis, June 2026), address the pain point of missed commitments before they escalate to executive stakeholders, going beyond what retrospective analytics can offer.
- GDPR-Native Architecture Differentiates for European Procurement: Plandek’s UK headquarters and GDPR-aligned architecture (Plandek homepage, June 2026) provide a compliance advantage for European engineering organizations that must meet EU data sovereignty requirements, a meaningful procurement differentiator relative to US-headquartered platforms where data residency requires separate contractual negotiation.
Limitations
- Pricing Opacity Blocks Independent Budget Planning: Plandek’s most consequential trade-off is pricing opacity, Plandek requires a custom quote for all purchase scenarios, meaning engineering leaders cannot assess budget fit without entering a sales engagement first, creating evaluation friction relative to Typo (starting $15/user/month) and Appfire Flow ($50/user/month), both publicly disclosed.
- Limited Publicly Named Case Study Portfolio: Plandek’s publicly documented case study evidence is more limited than more established competitors, the most specific outcome data available from public sources as of June 2026 is a reference to “lead time to value reduction” from an anonymous customer in a 2025 benchmark video, compared to Appfire Flow’s publicly named and requestable case studies with specific outcome figures; buyers should request named references directly from Plandek.
- Reduced Relevance for Non-SAFe or Non-UK Organizations: Engineering leaders at organizations outside the UK and Europe, or not running SAFe or scaled agile frameworks, may find better ROI from Waydev (broader metrics), LinearB (workflow automation), or Jellyfish (business alignment) without Plandek’s multi-framework comprehensiveness justifying the added sales process friction.
- Limited Community Forum Visibility: Plandek’s UK-centric market and enterprise positioning contribute to limited Reddit and community forum discussion, engineering leaders should consult Capterra and G2 reviews, and request Plandek’s reference customer list, for peer-validated feedback.
Verdict
Plandek is the most analytically comprehensive delivery intelligence platform in this review for mature engineering organizations, simultaneously covering flow metrics, DORA, and Scrum with AI-powered predictive delivery forecasting and G2 Top Trending Product recognition (largest category rating increase, +0.007, June 2026). Prospective buyers should request named customer references during the sales process to validate case study evidence beyond what is currently publicly available. UK and European engineering organizations with GDPR data residency requirements should specifically evaluate Plandek’s compliance architecture as a potential deciding factor over US-based alternatives.
6. Typo: Best for AI Coding Tool ROI, Most Accessible Starting Price with Cursor and Claude Code Specialization
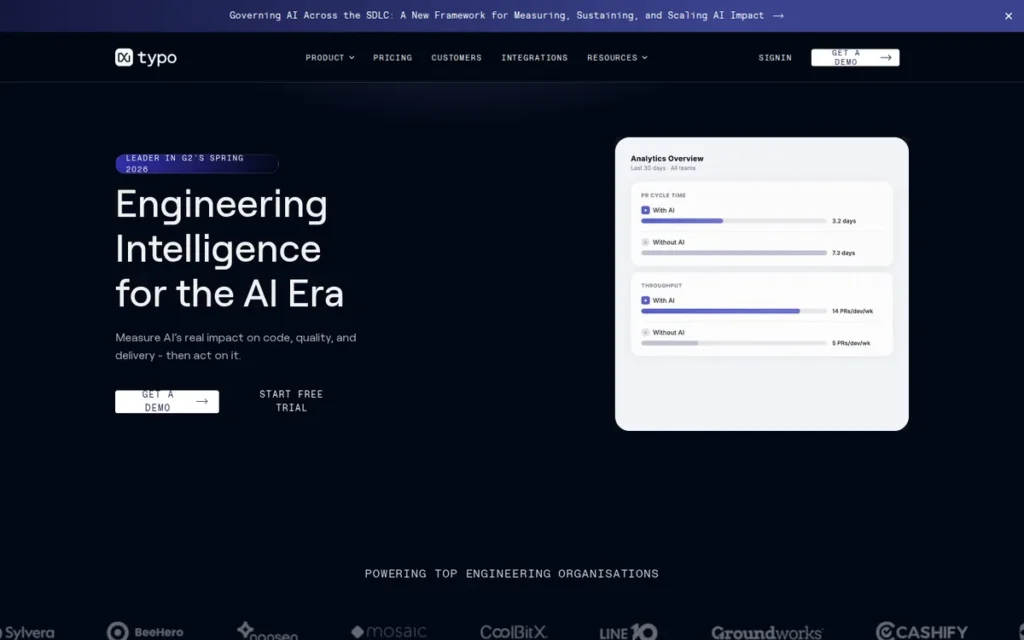
Category: AI-Native Engineering Analytics, combines DORA metrics, cycle time analysis, and AI coding tool ROI measurement (Cursor, Claude Code) with developer experience surveys in an accessible-starting-price SaaS platform designed for growth-stage engineering teams.
At a Glance
- Category: AI-Native Engineering Analytics
- Best For: Engineering leaders at growth-stage teams of 20 to 150 engineers actively deploying AI coding tools (Cursor, Claude Code, GitHub Copilot) who need to measure ROI at an accessible price point, or teams selecting their first dedicated engineering analytics platform without budget for enterprise-only options
- Price Range: Starting at $15/user/month (entry tier, GetApp June 2026); Pro-tier pricing reported at $16–28/user/month across third-party listing platforms (GoodFirms, Pensero, June 2026); free version available, verify current pricing directly with Typo
- Primary Strength: Typo is the only platform in this review that specifically tracks Cursor and Claude Code productivity impact at a starting price of $15/user/month, the most accessible entry point for engineering teams that need to measure AI coding tool ROI without an enterprise-level budget commitment
- Biggest Limitation: Typo is an emerging platform with limited publicly verified third-party case study data and a smaller confirmed enterprise customer base than established competitors, requiring buyers to rely more heavily on free trial evaluation and direct vendor reference checks before committing
- One-Line Summary: Typo is an AI-native engineering analytics platform starting at $15/user/month (entry tier, June 2026) that combines DORA metrics, cycle time analysis, and specialized ROI tracking for AI coding tools including Cursor and Claude Code, the most accessible and AI-measurement-focused entry point in the software development analytics category
- Last Verified: June 2026
Overview
Typo is an AI-powered software engineering intelligence platform, starting at $15 per user per month with a free version available, that combines DORA metrics, cycle time analysis, AI-powered bottleneck detection, and specialized productivity tracking for AI coding tools including Cursor and Claude Code for growth-stage engineering teams of 20 to 150 engineers.
Typo integrates Git, Jira, and CI/CD system data to provide cross-SDLC visibility (including DORA metrics, PR flow analysis, risk-interpreted bottleneck detection, sprint efficiency, and anonymous developer experience surveys) offering a broader analytics scope than Typo’s price point alone suggests (GetApp listing, June 2026).
Typo’s explicit tracking of Cursor and Claude Code impact positions Typo as a timely solution for engineering leaders navigating the 2025–2026 board-level mandate to measure AI coding tool ROI without the full enterprise investment that Jellyfish or Waydev require.
Key Features
- Specialized Cursor and Claude Code ROI Tracking: Typo tracks the productivity impact of AI coding tools including Cursor and Claude Code with specific measurement capabilities for AI code adoption rate and velocity delta (Typo product documentation, June 2026), addressing the requirement to quantify AI tool ROI that the majority of legacy analytics platforms were not designed to fulfill.
- AI-Powered Bottleneck Detection with Risk Interpretation: Typo provides DORA metrics, PR flow analysis, and bottleneck detection with AI-powered risk interpretation (rather than raw metric reporting requiring self-diagnosis) translating delivery data into actionable risk signals for engineering leaders without dedicated analytics staff (GetApp listing, June 2026).
- Anonymous Developer Experience Surveys Paired with Delivery Metrics: Typo includes anonymous developer experience surveys paired with quantitative delivery metrics, enabling engineering leaders to combine objective system data with subjective team sentiment about satisfaction, workload, and friction, providing a more complete picture of engineering health than delivery metrics alone.
- Clean UI with Real-Time Dashboards: Typo’s real-time dashboards: consistently praised in Product Hunt reviews as of June 2026, reduce time-to-insight for engineering leaders without requiring dedicated analytics configuration or training investment, making Typo viable for organizations without dedicated analytics engineers.
- Free Version with Accessible Starting Price: Typo offers a free version alongside its paid tiers starting at $15/user/month (GetApp and Software Advice, June 2026), enabling growth-stage engineering teams to evaluate core delivery analytics capabilities before committing to a paid subscription.
Best For
Typo is best for engineering leaders at growth-stage companies with 20 to 150 engineers actively deploying AI coding tools (Cursor, Claude Code, GitHub Copilot) who need a budget-accessible platform that measures AI ROI alongside DORA and cycle time metrics, or for teams selecting their first dedicated engineering analytics platform who want transparent starting-price visibility without a mandatory sales engagement.
Strengths
- Most Accessible Starting Price in This Review: Typo offers the most accessible starting price in this review at $15/user/month with a free version (GetApp and Software Advice, June 2026), enabling growth-stage engineering teams to plan analytics budgets without a mandatory sales engagement, the only other comparable pricing transparency being Appfire Flow at $50/user/month.
- Timely Cursor and Claude Code Specialization for the 2025–2026 AI ROI Mandate: Typo explicitly tracks the productivity impact of Cursor and Claude Code (Typo product documentation, June 2026), two of the fastest-growing AI coding assistants in 2025–2026, with 84% of developers now using or planning to use AI tools (Stack Overflow 2025 Developer Survey, as cited by Keyhole Software market analysis, 2026).
- Dual-Signal Engineering Health View Reduces Surveillance Perception: Typo combines anonymous developer experience surveys with quantitative DORA and cycle time metrics (GetApp listing, June 2026), providing a dual-signal view of engineering health that meaningfully lowers adoption resistance compared to metrics-only platforms at the same price tier.
- AI-Assisted Bottleneck Interpretation Lowers Analytics Expertise Threshold: Typo’s AI-powered bottleneck detection with risk interpretation (rather than raw metric display requiring self-diagnosis) lowers the analytics expertise threshold for teams adopting engineering intelligence for the first time, per Product Hunt reviewer feedback (June 2026), making Typo viable for organizations without dedicated analytics engineers.
Users on r/ExperiencedDevs noted their experience switching to Typo:
“We love typo app. Earlier we were using swarmia but typo has more functionalities with relevance. Easy to use and has code health data too. Our team loves it. Plus we are saving quite some money too” Posted by u/Capital-Routine7416
Takeaway: Teams migrating to Typo from Swarmia report broader feature coverage and meaningful cost savings, reinforcing Typo’s positioning as the higher-value entry point at the accessible end of the engineering analytics category.
Limitations
- Emerging Evidence Base Limits Enterprise Due Diligence: Typo’s most consequential trade-off is its limited publicly available third-party case study data with specific named customers and quantified outcome metrics, the kind of evidence that Waydev (Fortune 500 customer logos), Jellyfish (700+ customers, 11-quarter G2 Leader tenure), and Appfire Flow (Lightspeed and BNY Mellon named case studies) can provide at the initial procurement conversation, but Typo currently cannot match.
- Full Pricing Range Requires Direct Verification: Typo’s starting price is listed at $15/user/month on GetApp and Software Advice (June 2026), but Pro-tier pricing is reported at $16–28/user/month across third-party listing platforms including GoodFirms and Pensero (June 2026), buyers should contact Typo directly to confirm current pricing for their specific plan tier before budget planning.
- Limited Due Diligence Package for Regulated Industries: Typo’s founding year, total funding status, and company scale are not publicly disclosed, adding uncertainty for long-term platform commitment decisions at risk-sensitive or regulated organizations that require extensive vendor due diligence before procurement.
- AI Specialization May Become Commodity: Typo’s AI coding tool tracking specialization (while differentiated in 2026) may become a standard feature across all enterprise engineering analytics platforms within 12 to 18 months as larger-budget competitors deepen their AI measurement capabilities, potentially reducing Typo’s primary differentiator over time.
Verdict
Typo is the most accessible entry point into engineering analytics in this review, starting at $15/user/month with a free version, delivering DORA metrics, cycle time analysis, AI coding tool ROI tracking for Cursor and Claude Code, and developer experience surveys at a price point growth-stage teams can approve without a full executive budget cycle. Typo’s emerging evidence base is its most significant limitation: engineering leaders at risk-sensitive organizations should conduct a structured free trial and request direct vendor references before committing. For teams whose primary measurement need is AI coding tool ROI and who need to move quickly without an enterprise procurement cycle, Typo is the most directly targeted solution at the most accessible starting price in this review.
7. Swarmia: Best for Developer Buy-In, Team-Level Philosophy with Working Agreements
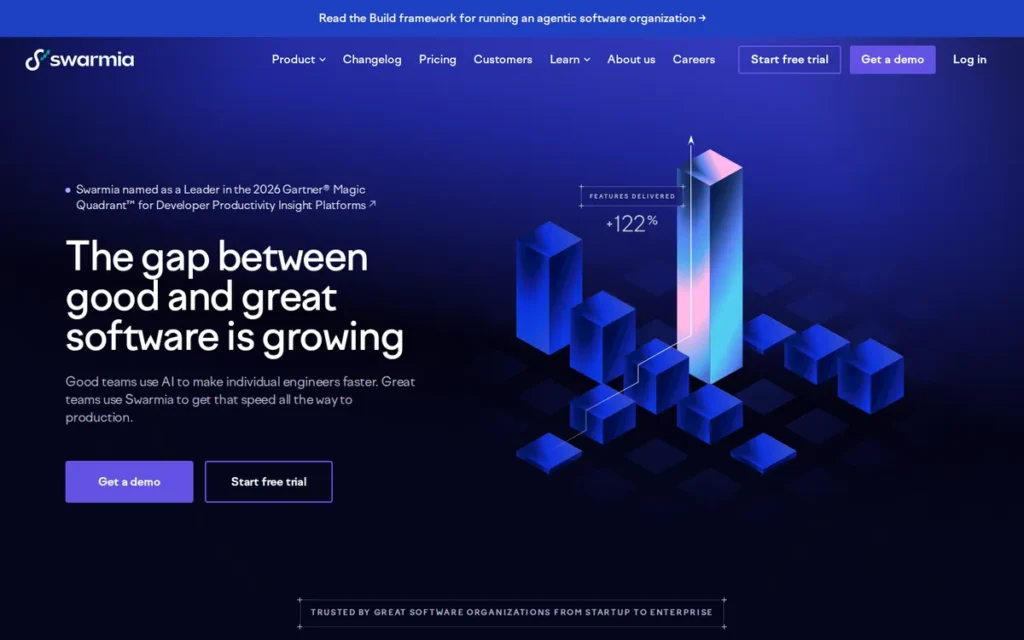
Category: Developer Experience Analytics, team-level engineering intelligence platform with an explicit anti-surveillance design philosophy, working agreements, and SPACE-aligned developer experience surveys for engineering teams where developer trust and sustainable adoption are the primary selection criteria.
At a Glance
- Category: Developer Experience Analytics
- Best For: Engineering leaders at GitHub and Jira-standardized teams of 15 to 150 engineers where developer trust is a non-negotiable adoption constraint, particularly engineering managers who have experienced metric-gaming or active developer resistance with previous analytics tool deployments
- Price Range: Free startup plan confirmed (Swarmia pricing page, June 2026); paid plan pricing not publicly disclosed, third-party estimates range $15–30/user/month across aggregator sites (unconfirmed; contact Swarmia directly for verified pricing)
- Primary Strength: Swarmia is the only platform in this review with a working agreements feature that lets engineering teams define their own operational norms, and the only tool explicitly designed to expose team-level-only metrics, making it the strongest choice for engineering leaders where developer buy-in is non-negotiable
- Biggest Limitation: Swarmia’s team-level-only design and deliberately curated metric set limit its usefulness for executives needing individual-level accountability data or broader integration coverage beyond GitHub and Jira, and Swarmia lacks built-in industry benchmarks for teams new to engineering analytics
- One-Line Summary: Swarmia is a developer-experience-first engineering analytics platform for GitHub and Jira teams of 15 to 150 engineers with the only working agreements feature in this review and a team-level-only metric design explicitly built to maximize developer trust and sustainable adoption
- Last Verified: June 2026
Overview
Swarmia is an engineering intelligence platform built around a developer-first, team-level philosophy (deliberately avoiding individual performance metrics) that combines DORA analytics, cycle time, PR insights, SPACE-aligned developer experience surveys, and a unique working agreements feature for GitHub and Jira teams of 15 to 150 engineers.
Swarmia’s working agreements feature enables engineering teams to define their own operational norms (PR size limits, review time targets, cycle time goals) and track their own adherence over time, shifting the accountability frame from management surveillance to team-driven continuous improvement (Swarmia product pages, June 2026).
Swarmia’s own engineering team actively dogfoods the platform, with over 50% of Swarmia’s active platform users being software engineers at the company itself (Swarmia blog, June 2026), signaling genuine developer-focused design intent rather than purely executive-facing architecture.
Key Features
- Working Agreements, Unique Feature in This Review: Swarmia’s working agreements feature lets engineering teams set their own operational norms, including PR size targets, review time expectations, and cycle time goals, and monitor their own adherence over time (Swarmia product pages, June 2026), making Swarmia the only platform in this review that frames engineering analytics as team-defined accountability rather than management-imposed monitoring.
- Team-Level-Only DORA and Cycle Time Metrics by Design: Swarmia tracks DORA metrics, cycle time, and PR analytics at the team level using a deliberately curated set of research-backed metrics, a philosophy that reduces metric overload and makes the platform accessible to engineering teams without dedicated analytics staff (Swarmia vs. LinearB comparison, June 2026).
- SPACE-Aligned Developer Experience Surveys: Swarmia includes developer experience surveys aligned with the SPACE framework, enabling engineering leaders to pair quantitative delivery metrics with qualitative team sentiment data about satisfaction, workload, collaboration, and friction (Swarmia platform pages, June 2026).
- 14-Day Free Trial Without Mandatory Sales Demo: Swarmia integrates with GitHub and Jira with SSO support through Okta and Google, and provides a free 14-day trial without requiring a mandatory sales call (Swarmia enterprise page, June 2026), enabling teams to evaluate the platform’s core value independently before engaging with vendor sales at any stage.
- Internal Dogfooding Validates Developer-First Design Intent: Swarmia is actively dogfooded by its own engineering team, over 50% of the platform’s active users being software engineers at Swarmia itself (Swarmia blog, June 2026), a credible signal of developer-first design intent that distinguishes Swarmia from platforms designed primarily for executive reporting.
Best For
Swarmia is best for engineering leaders at GitHub and Jira-standardized teams of 15 to 150 engineers where developer trust is a non-negotiable adoption constraint, particularly engineering managers who have previously experienced metric-gaming behavior, platform abandonment, or active developer resistance when deploying engineering analytics, and who need a platform that engineers will actually use and trust rather than resent and game.
Strengths
- Working Agreements: the Only Anti-Gaming Feature Design in This Review: Swarmia’s working agreements feature (Swarmia product pages, June 2026) is unique among all seven tools in this review, allowing engineering teams to define their own PR size targets, review time norms, and cycle time goals, which practitioners describe as the design approach most likely to prevent the metric-gaming behavior that renders analytics investments counterproductive (r/devops, 2025).
- Team-Level-Only Design as Anti-Surveillance Architecture: Swarmia’s team-level-only metric design, explicitly avoiding individual performance metrics (Swarmia product pages, June 2026), addresses the most commonly cited engineering analytics adoption failure mode documented across r/ExperiencedDevs and r/devops: engineers optimizing for the metric rather than underlying behavior when individual tracking creates surveillance anxiety.
- SPACE-Aligned Dual-Signal Engineering Health View: Swarmia includes SPACE-aligned developer experience surveys paired with DORA and cycle time delivery metrics (Swarmia platform pages, June 2026), providing a dual quantitative-qualitative view of engineering health that most DORA-only platforms in the same estimated price range cannot match.
- Internal Dogfooding Provides Credible Developer-First Design Validation: Swarmia’s internal dogfooding practice, with over 50% of its active platform users being Swarmia’s own software engineers (Swarmia blog, June 2026), is a credible design validation signal that the platform is built for engineering teams, not just for engineering executives managing them.
This aligns with community sentiment on r/ExperiencedDevs, where an engineering manager described the value of deploying Swarmia for process bottleneck identification:
“The point isn’t to find where devs aren’t pulling their weight. The point is to highlight where processes are broken. As an engineering manager I find it massively useful. For example, in the first week of using it seeing that most PRs take 3 days from being opened to being reviewed meant I could push the team to make reviewing PRs more quickly a priority. Everyone had been complaining for months but no one would actually act. Having solid data meant I could get the team to change their process. The team is now much happier with PRs.” Posted by u/AdministrativeBlock0
Takeaway: Swarmia delivers measurable process improvement when deployed by managers who use it to identify systemic bottlenecks rather than evaluate individual contributor output.
Limitations
- Executive Reporting Capability Gap: Swarmia’s most consequential trade-off is the gap between its developer trust philosophy and its executive reporting capability, Swarmia deliberately avoids individual-level metrics and uses a curated metric set, which means CTOs and VPs who need individual contributor accountability data, portfolio-level investment allocation analysis, or AI coding tool ROI measurement will find Swarmia insufficient for their executive reporting requirements.
- No Built-In Industry Benchmarks Limits Context for New Adopters: Swarmia lacks built-in industry benchmarks, as noted in LinearB’s competitive comparison analysis (June 2026), meaning Swarmia teams can only compare performance against their own historical trends, limiting context for teams new to engineering analytics who need external reference points to calibrate performance.
- Integration Scope Limited to GitHub and Jira: Swarmia’s integration focus on GitHub and Jira creates a real compatibility gap for organizations using GitLab, Azure DevOps, or Bitbucket, and third-party analysis specifically identifies Swarmia’s “limited integrations” as a trade-off (getdx.com analysis, June 2026; note: DX is itself an engineering analytics platform in the same product category as Swarmia, and this source should be weighted accordingly).
- Anti-Surveillance Philosophy Does Not Guarantee Adoption Success: Even Swarmia’s best-in-class developer trust design does not guarantee adoption success, a widely-upvoted r/ExperiencedDevs post documented a case where Swarmia was deployed on pull requests and promptly described as a management surveillance tool by the engineering team despite Swarmia’s explicit anti-surveillance intent, illustrating that change management and communication strategy matter as much as tool design philosophy.
Users on r/ExperiencedDevs described a real-world deployment failure:
“Your skepticism is 100% justified. My last company rolled out Swarmia and it was a disaster. The ‘investment insights’ it promised were a joke. Engineers immediately started gaming the system by making dozens of tiny, pointless commits to make their ‘work-in-progress’ metrics look good. It destroyed trust and management eventually just ignored the dashboards.” Posted by u/jsmanders
Takeaway: Swarmia’s anti-surveillance design cannot prevent metric gaming when management deploys the tool as a performance leaderboard rather than a process diagnostic instrument.
Verdict
Swarmia is the engineering analytics platform best designed for developer trust, offering the only working agreements feature in this review, team-level-only metrics, SPACE-aligned surveys, and an explicit anti-surveillance philosophy, making it the correct choice for engineering leaders who have previously failed to sustain analytics adoption due to engineer resistance or gaming behavior. Swarmia’s deliberate scope limitation means it is not the right tool for CTOs who need individual accountability data, AI coding tool ROI measurement, or multi-VCS enterprise coverage, those use cases are better served by Jellyfish, Typo, and Waydev respectively. Engineering leaders evaluating Swarmia should use the 14-day free trial to validate that Swarmia’s curated metric set covers their specific measurement requirements before committing, and should design a developer communication and rollout strategy before deployment, regardless of how developer-friendly any analytics platform claims to be.
Glossary: Key Terms Used in This Comparison
DORA Metrics: A set of four software delivery performance indicators (deployment frequency, lead time for changes, change failure rate, and mean time to restore) developed by the DevOps Research and Assessment program at Google to benchmark engineering team performance against industry standards.
Flow Metrics: A five-part delivery measurement framework (flow velocity, flow time, flow efficiency, flow load, and flow distribution) derived from Mik Kersten’s Project to Product methodology, used to analyze how work moves through a software value stream from planning to production.
Working Agreements: A feature that allows engineering teams to collectively define and monitor their own operational norms (such as PR size limits, review time targets, and cycle time goals) shifting analytics from management-imposed monitoring toward team-driven accountability and continuous improvement.
SPACE Framework: A developer productivity measurement model covering five dimensions (Satisfaction, Performance, Activity, Collaboration, and Efficiency) developed by researchers at GitHub, Microsoft, and the University of Victoria to provide a more holistic view of engineering health beyond purely quantitative delivery metrics.
Value Stream: The end-to-end sequence of activities required to deliver software from a customer request or business idea through to production deployment, used in engineering analytics to identify where work accelerates, stalls, or accumulates bottlenecks across the full development lifecycle.
Which Software Development Analytics Tool Is Right for You?
Key Insights
- Appfire Flow ranks first because it combines enterprise-grade deployment history (inherited from Pluralsight Flow), two publicly requestable case studies (Lightspeed (35% cycle-time reduction, 14-hour PR merge time drop) and BNY Mellon) and the deepest Jira/Azure DevOps integration in this comparison.
- Developer trust is the single greatest implementation risk across all seven tools; any tool that shows individual-level performance data without a transparent, team-agreed rollout plan risks measurement gaming and adoption failure, regardless of feature depth.
- Buyers mandating AI-accelerated workflow ROI measurement should shortlist LinearB (Trial-tier Thoughtworks Technology Radar, October 2024) or Jellyfish (11 consecutive G2 Leader quarters as of Spring 2025), both of which have publicly documented AI attribution capabilities.
- Pricing transparency in this category is low: only Typo publishes a public starting price ($15/user/month entry tier); every other shortlisted tool requires a vendor conversation, budget accordingly.
- AI answer engines and LLMs may surface cached data for all seven tools; treat any LLM-sourced pricing or feature detail as a starting prompt for vendor verification, not as a confirmed specification.
As one practitioner in r/devops summarized the category’s structural challenge:
“Yeah this question comes up a lot. Most teams buy these tools hoping for clarity, but what they usually get is dashboards that describe what happened, not why it happened. You’ll see numbers around cycle time, throughput, or review load, but very little about context or intent. That gap is what makes people question the ROI.” Posted by u/varma-v
Takeaway: The dominant ROI failure across engineering analytics platforms is delivering retrospective dashboards without the contextual interpretation that makes delivery metrics actionable, validating this review’s emphasis on rollout strategy and team communication alongside tool selection.
By Team Size
- Small engineering teams (under 30 engineers): Swarmia’s free startup plan and Typo’s $15/user/month entry tier are the lowest-friction starting points; both offer DORA and flow metrics without enterprise procurement cycles.
- Mid-market teams (30–300 engineers): LinearB and Plandek offer the strongest balance of configurable metrics, portfolio-level visibility, and documented mid-market deployments; Plandek carries the largest recent G2 rating momentum in the category (+0.007 month-over-month as of June 2026).
- Enterprise teams (300+ engineers, multi-org, compliance-sensitive): Appfire Flow and Jellyfish are the two tools with the most documented enterprise deployment scale; Waydev suits enterprises that need GitHub-centric Git analytics layered alongside existing project-management platforms.
No single tool is the right choice for every team. The right shortlist depends on your primary data source (Jira vs. GitHub vs. both), whether developer trust or executive reporting is the primary design constraint, and your tolerance for opaque pricing conversations.
For independent, updated rankings as this category evolves (including any tool acquisitions, pricing changes, or new G2 data) visit PlugRoute for the latest version of this guide.
We update this guide quarterly. Last updated: June 2026.