Google Analytics 4 is the best free analytics platform for web and marketing teams; Microsoft Power BI leads business intelligence at $14 per user per month with 18 consecutive years of Gartner leadership; and Mixpanel tops product analytics for SaaS teams with the most transparent pricing in its category. No single platform serves every use case, role, budget, data type, and EU compliance requirements determine the right fit.
The analytics platform market in 2026 spans tools priced from $0 to over $1,000,000 per year. Pricing opacity, steep learning curves, GDPR exposure, and the multi-tool reality (most mature stacks combine two to three platforms) create genuine friction for every buyer navigating this category.
PlugRoute has no affiliate relationships with any company listed. Rankings are determined entirely by research data and objective evaluation criteria.
“Remember it’ll only be good as the data you feed it. And their understanding of the data.” (u/imnotabotareyou (39 upvotes), r/BusinessIntelligence)
Takeaway: The analytics platform you select determines what data you can collect, but data quality, instrumentation discipline, and team analytical literacy determine whether that data produces decisions rather than reports.
TL;DR: Top Picks at a Glance
- Google Analytics 4: free web analytics with native Google Ads integration and AI predictive audiences at $0
- Microsoft Power BI: enterprise BI dashboards at $14/user/month; included free in Microsoft 365 E5 licenses
- Mixpanel: transparent product analytics from $25/month; retroactive event analysis; 1M events/month free tier
- Tableau: unmatched VizQL visualization depth for data professionals requiring executive-grade custom charts
What Are the Three Categories of Analytics Platforms?
The seven platforms in this evaluation divide into three functional categories: Web and Marketing Analytics Trackers measure visitor behavior and campaign attribution; Business Intelligence Visualizers deliver governed dashboards and reports from organizational data; and Product Analytics Platforms track in-product user behavior to optimize feature adoption and retention. Most mature organizations run one tool from each category.
Category 1: Web and Marketing Analytics Trackers measure website and app visitor behavior, marketing campaign attribution, and conversion performance.
Entries: Google Analytics 4, Adobe Analytics.
Category 2: Business Intelligence Visualizers and Semantic Platforms connect to organizational data sources to deliver interactive dashboards, governed reports, and (in Looker’s case) a semantic layer that enforces metric consistency across the enterprise.
Entries: Microsoft Power BI, Tableau, Looker.
Category 3: Product Analytics and Behavioral Intelligence Platforms track user actions within digital products (SaaS apps, mobile apps, and web experiences) to optimize feature adoption, reduce churn, and understand behavioral journeys.
Entries: Mixpanel, Amplitude.
Which category fits your team? Before reading all seven profiles, identify your primary question:
- Is it how many visitors arrived and which campaigns drove them? → Category 1 (2 platforms to evaluate)
- Is it which in-product features users adopt and where they churn? → Category 3 (2 platforms to evaluate)
- Is it how to govern KPIs consistently across departments? → Category 2 (3 platforms to evaluate)
Your answer reduces this evaluation from seven platforms to two or three relevant candidates before you read a single profile.
How Do the Top Analytics Platforms Compare at a Glance?
These seven platforms span a 50:1 price ratio (from $0 to $500,000-plus per year) serving five distinct buyer archetypes across marketing, product, BI, enterprise governance, and privacy compliance. The table below summarizes each platform’s category, best-fit profile, and critical trade-off for rapid side-by-side evaluation.
| Rank | Platform | Category | Best For | One-Line Summary | Key Capabilities | Primary Strength | Key Limitation |
|---|---|---|---|---|---|---|---|
| 1 | Google Analytics 4 | Web/Marketing Tracker | Marketing teams and SMBs needing free, Google Ads-integrated measurement | Google Analytics 4 is the world’s most widely deployed web analytics platform; free for most organizations, natively integrated with Google’s advertising ecosystem, and backed by the largest verified review base in the analytics category | Unified event-based tracking across web and app in a single property; Consent Mode v2 cookieless behavioral modeling for GDPR environments; AI-powered predictive audience creation for Google Ads at no additional cost | Most generous free tier in web analytics; 10M events/month at $0 | EU GDPR regulatory findings in Austria, France, and Italy (2022); data sampling on high-traffic Exploration reports; no product analytics or BI dashboarding without supplementary tools |
| 2 | Microsoft Power BI | BI Visualizer | Business analysts at Microsoft 365 or Azure organizations needing governed BI at the lowest per-user cost | Microsoft Power BI is the global BI market-share leader at approximately 20% of deployments, offering the lowest per-user cost of any enterprise BI platform at $14 per user per month; and often $0 for organizations with Microsoft 365 E5 licenses | AI Copilot for natural-language DAX query generation and report page creation; Microsoft Fabric unifying data engineering, Synapse, and visualization; VertiPaq in-memory compression supporting petabyte-scale DirectQuery performance | 18-year Gartner Magic Quadrant leadership through the 2025 report at $14/user/month | Optimized for Microsoft ecosystem; Windows-only Desktop authoring; narrower visualization flexibility than Tableau |
| 3 | Mixpanel | Product Analytics Tracker | Product managers and SaaS or mobile teams needing transparent pricing and retroactive event analysis | Mixpanel is the product analytics platform most recommended by practitioner communities for teams that invest in clean event instrumentation; offering the most transparent pricing, the most generous free tier, and retroactive analysis capability unavailable in directly comparable commercial platforms | Retroactive event analysis applied immediately to historical user data without re-instrumentation; Flows visualization mapping all actual user navigation paths; Autocapture plus intentional manual instrumentation for data-quality flexibility | Most transparent pricing in product analytics; 1M events/month free tier | Meaningful insights require dedicated developer instrumentation time; absent semantic governance layer for cross-team metric consistency |
| 4 | Tableau | Data Visualization & BI | Data analysts requiring executive-grade custom visualizations and freeform data exploration | Tableau is the visualization gold standard for data professionals; with VizQL-powered freeform exploration and AI-generated Pulse insights; but its $75 per user per month Standard Creator pricing and granular data performance ceiling make it most justified for organizations where visualization depth is a documented strategic requirement | VizQL engine translating drag-and-drop interactions into optimized database queries; Tableau Pulse AI-generated digests delivered to business stakeholders via email and Slack; Cloud and on-premises deployment options for data sovereignty requirements | Unmatched visualization depth; Sankey, animated, and geographic chart freeform exploration without writing code | Standard Creator at $75/user/month is 5× Power BI Pro; extract-based architecture degrades at granular data scale |
| 5 | Amplitude | Enterprise Product Intelligence | Enterprise product teams needing behavioral graph analytics and built-in A/B experimentation | Amplitude is the enterprise product intelligence platform most trusted by large-scale B2C and SaaS organizations, with a behavioral graph architecture, built-in A/B experimentation, and named customers including NBCUniversal, Atlassian, and Under Armour; designated by practitioner communities as the graduation platform for product analytics teams at scale | Behavioral graph modeling multi-product user journey relationships over time; Amplitude Experiment for built-in A/B and multivariate testing within the analytics platform; Amplitude Data CDP for cross-platform identity resolution without custom data engineering | Built-in A/B/n experimentation plus behavioral analytics in a single platform | Growth and Enterprise pricing requires sales engagement; 50K MTU free-tier ceiling vs. Mixpanel’s 1M events/month |
| 6 | Looker | Semantic BI Platform | Enterprise data engineering teams needing a governed single source of truth across all dashboards | Looker is the enterprise semantic BI platform that solves the ‘different teams, different numbers’ governance problem through a Git-versioned LookML semantic layer; with real-time in-database queries and the most granular user permissioning controls in the category, at an enterprise-only price floor of approximately $60,000 per year | LookML Git-versioned semantic layer enforcing a single metric definition across all dashboards; real-time in-database queries eliminating extract refresh lag across 50-plus SQL dialects; row-level and column-level permissioning for granular data governance | Only major BI platform enforcing a single governed metric definition organization-wide through architecture | $60,000–$240,000-plus/year minimum; LookML requires dedicated analytics engineering staff |
| 7 | Adobe Analytics | Enterprise Web Analytics Suite | Fortune 500 organizations running the full Adobe Experience Cloud and needing 100% unsampled multi-channel data | Adobe Analytics is the enterprise web analytics platform for Fortune 500 organizations requiring 100% unsampled multi-channel data, Analysis Workspace’s freeform ad-hoc analysis depth, and Customer Journey Analytics’ ability to unify online and offline behavioral data; at an enterprise-only price floor that positions it for large organizations already embedded in the Adobe Experience Cloud | 100% unsampled data processing at any traffic volume for every query; Analysis Workspace freeform tables enabling ad-hoc multi-dimensional analysis across any metric and dimension; Customer Journey Analytics unifying online and offline behavioral data into cross-channel person-level profiles | 100% unsampled data processing at any traffic volume; Analysis Workspace ad-hoc analysis depth | No self-serve pricing or trial; approximately $10,000–$500,000-plus/year; requires dedicated full-time administrator |
Which Analytics Platform Should I Choose for My Use Case?
| Your #1 Priority | Recommended Tool | Why | Acceptable Alternative |
|---|---|---|---|
| Free web and marketing analytics | Google Analytics 4 | Free for up to 10M events/month across unlimited websites; native bidirectional Google Ads Smart Bidding integration; deployed on 29M-plus websites globally as of 2026 | Adobe Analytics (enterprise only; approximately $10,000-plus/year minimum) |
| BI dashboards at the lowest per-user cost | Microsoft Power BI Pro | $14/user/month; 18-year Gartner Magic Quadrant leadership through 2025; often $0 via Microsoft 365 E5 bundling | Tableau Standard Creator (appropriate when VizQL visualization depth and Salesforce ecosystem integration are documented organizational requirements, at $75/user/month) |
| Product analytics with transparent pricing | Mixpanel | Public pricing from $25/month; 1M events/month free; retroactive analysis included; pricing calculator self-serve without sales call | Amplitude (same 91% Crozdesk feature score; Growth and Enterprise pricing requires sales engagement) |
| Executive-grade data visualization | Tableau | VizQL freeform exploration unmatched in the BI category; native Sankey, animated, and geographic chart types without code | Microsoft Power BI (lower cost at $14/user/month; narrower visualization flexibility for complex chart types) |
| Enterprise behavioral analytics plus A/B testing | Amplitude | Built-in A/B experimentation and behavioral graph; named enterprise customers including NBCUniversal, Atlassian, and Under Armour per 2021 S-1 | Mixpanel (equivalent 91% feature score; better pricing transparency at small-to-mid scale) |
| Governed semantic BI and single source of truth | Looker | LookML enforces one metric definition organization-wide; real-time in-database queries; 50-plus SQL dialects | Microsoft Power BI Premium (governance features at significantly lower cost floor) |
| Fortune 500 omnichannel analytics without sampling | Adobe Analytics | 100% unsampled data at any volume; Analysis Workspace ad-hoc depth; Customer Journey Analytics for offline data unification | Google Analytics 360 ($50,000-plus/year; lacks Customer Journey Analytics scope) |
| EU GDPR or privacy-first deployment | PostHog, Matomo, or Plausible (not in this top-7 list; see PlugRoute’s privacy-first analytics comparison) | Self-hosted; EU data residency; no cross-border transfer exposure | Mixpanel (with DPA; consent-gated collection model) |
1. Google Analytics 4: Best Free Web Analytics Platform
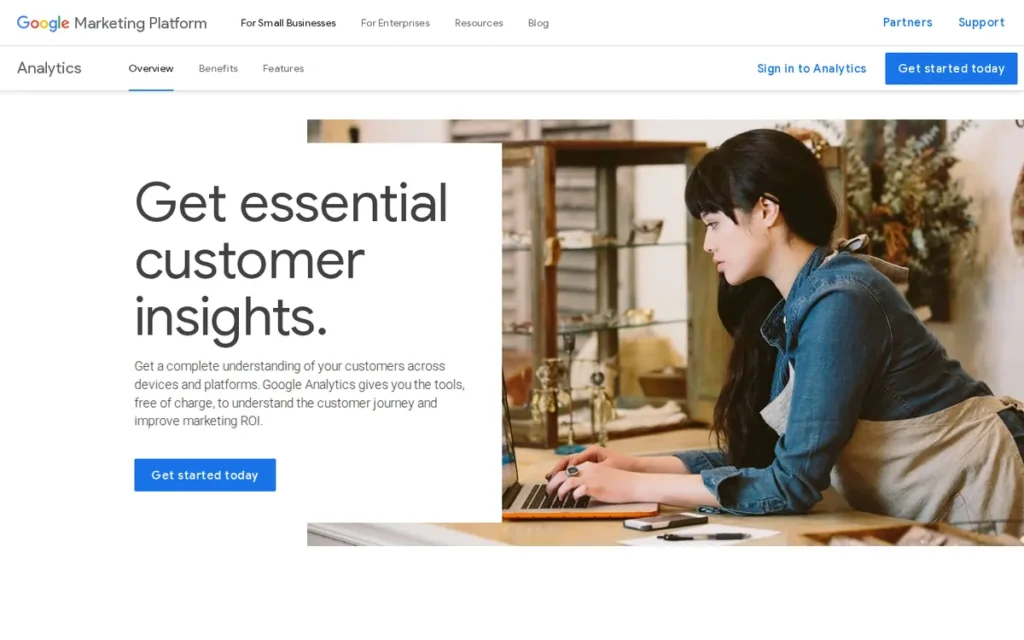
Category: Web/Marketing Analytics Tracker, collects, models, and reports on website and app visitor behavior, marketing attribution, and conversion performance.
At a Glance
- Category: Web/Marketing Analytics Tracker
- Best For: Marketing teams, web analysts, and small-to-mid-size businesses needing free web traffic analysis, Google Ads attribution, and AI-powered predictive audience features without budget commitment
- Price Range: Free (Standard, up to approximately 10M events/month); $50,000-plus/year (Google Analytics 360, enterprise)
- Primary Strength: Google Analytics 4 provides free web analytics covering up to 10 million events per month with AI-powered predictive metrics and Google Ads bidirectional integration, the broadest verified free tier in the web and marketing analytics category as of May 2026
- Biggest Limitation: Google Analytics 4 has faced regulatory findings in Austria, France, and Italy questioning whether standard implementations satisfy GDPR’s Chapter V requirements for cross-border data transfers
- One-Line Summary: Google Analytics 4 is the world’s most widely deployed web analytics platform, free for most organizations, natively integrated with Google’s advertising ecosystem, and backed by the largest verified review base in the analytics category
- Last Verified: May 2026
Overview
Google Analytics 4 is a free, event-based web and app analytics platform from Alphabet (Google) that enables marketing teams, web analysts, and business owners to measure visitor behavior, track conversions, and attribute revenue across digital channels, serving organizations from single-page personal sites to enterprise e-commerce at 29 million-plus active installs globally.
Google Analytics 4 replaces Universal Analytics’ session-based model with a unified event model that tracks every interaction (page views, scrolls, video plays, purchases) as flexible, parameterized events across web, iOS, and Android in a single property.
Google Analytics 4 is the default starting point for any organization running paid media through Google Ads, as its native bidirectional data sharing between GA4 and Google Ads provides deeper native integration than standalone third-party attribution tools, including real-time Smart Bidding optimization and audience syncing that external platforms cannot replicate without data export steps.
Key Features
- Unified Event-Based Data Model: Google Analytics 4 tracks all user interactions (from page scrolls and outbound clicks to video engagement and form submissions) as unified events with customizable parameters, eliminating the web and app tracking silos that fragmented analytics in Universal Analytics across separate web and mobile properties.
- AI-Powered Predictive Metrics: Google Analytics 4 includes purchase probability, churn probability, and predicted revenue forecasting on the Standard free tier, enabling audience segmentation that historically required paid machine learning platforms or enterprise analytics contracts, confirmed across 1.1 million-plus properties using predictive audiences as of 2026.
- Consent Mode v2: Google Analytics 4’s Consent Mode v2 sends anonymized cookieless behavioral signals from non-consenting users to machine learning models that reconstruct aggregate conversion patterns, preserving directional marketing measurement without personal data collection, a first-party data architecture designed for cookieless measurement environments.
- Bidirectional Google Ads Integration: Google Analytics 4 integrates bidirectionally with Google Ads, enabling GA4 conversion data to optimize Smart Bidding campaigns in real time and GA4 audiences to serve as targeting inputs for Search, Display, and YouTube campaigns without exporting data or third-party matching.
- Exploration Reports: Google Analytics 4’s Exploration suite provides advanced ad-hoc analysis (funnel exploration, path analysis, cohort analysis, and segment overlap) that substantially exceeds standard dashboards and approaches the depth of paid product analytics tools at no additional cost.
Best For
Google Analytics 4 is best for marketing teams, content publishers, e-commerce operators, and small-to-mid-size businesses that need reliable web traffic measurement, Google Ads attribution, and free access to AI-powered audience features, particularly organizations where the Google advertising ecosystem is the primary paid media channel and where EU data-residency requirements are not a limiting constraint.
Pricing
Google Analytics 4 Standard is free with no time limit, covering up to approximately 10 million events per month, 500 distinct event types, 50 custom dimensions and metrics, 14-month configurable data retention, and 1 million events per day of BigQuery export at no charge. Google Analytics 360 starts at $50,000 per year billed annually, adding 25M-plus events per month processing, 50-month data retention, 125 custom dimensions, 400 audiences, sub-property and rollup governance, dedicated Google support, and SLAs. There is no intermediate tier between free Standard and $50,000-plus per year for 360, a significant pricing cliff verified against Google’s official documentation and Analytify pricing guide, May 2026.
Strengths
- Strongest Quantified Performance Evidence in the Category: Properties using Google Analytics 4’s cross-platform tracking reported a 31% improvement in customer lifetime value attribution accuracy across 890,000-plus properties, per data aggregated from Google’s 2026 Analytics benchmarking study [Source: Amra & Elma, 2026, aggregating Google Analytics benchmarking data (secondary source]) the strongest performance evidence of any platform in this evaluation.
- Largest Install Base by a Factor: Google Analytics 4 is deployed across 29 million-plus websites as of 2026 [Amra & Elma, 2026], creating the largest network effect of any analytics platform, benchmarking data, community support, and compatible integrations vastly outnumber those of any competitor.
- Unmatched Free Tier Value: Google Analytics 4 Standard covers up to 10 million events per month across unlimited websites with AI-powered predictive audience features included at no cost, representing the most favorable price-to-capability ratio of any analytics platform evaluated, verified against Google’s pricing documentation, May 2026.
- Quantified Ad Spend Efficiency: Research aggregated from Contentsquare’s analysis of 35 billion sessions found that organizations using GA4’s active-user engagement model reported a 17.4% annual reduction in wasted ad spend and a 23% improvement in content engagement scores on top landing pages [Source: Amra & Elma, 2026, reporting Contentsquare data, primary Contentsquare publication not independently verified at time of writing].
Limitations
- EU GDPR Regulatory Risk: Google Analytics 4’s most consequential limitation for European organizations is regulatory exposure, data protection authorities in Austria (DSB, January 2022), France (CNIL, February 2022), and Italy (Garante, June 2022) issued findings confirmed by the EDPB that standard GA4 implementations transfer EU residents’ personal data to U.S. servers in ways that may not satisfy GDPR Chapter V cross-border data transfer requirements, driving real organizational migrations to privacy-first alternatives in those markets.
- Data Sampling at Scale: Google Analytics 4 Standard applies statistical sampling to high-traffic Exploration reports rather than processing 100% of raw data, meaning analysis for large enterprises is based on statistical estimates rather than complete data, unlike Adobe Analytics which processes 100% of data at any volume on any tier.
Users on r/GoogleAnalytics noted both the operational friction of GA4’s sampling constraints and an unexpected structural benefit of the forced migration:
“The biggest cons for me thus far:
- I deeply miss the custom reports in UA. I know about Explorations and use them heavily, but the search functionality in custom reports seemed much, much quicker.
- Really dislike how long it can take to process things. Data doesn’t seem to settle until 48h after the fact, and I often have stakeholders asking for things before that.
- Sampling threshold limitations within explorations are brutal, seemingly much more so than it was with UA. It can take me several days to get the unsampled cuts of data that I need for quarterly reporting in GA4 with the token limitations. I’m likely going to start querying this in BigQuery instead to save myself time, but I don’t love how difficult they’re making it within the UI.
The biggest upside thus far was that it forced us to re-tag everything, so we were able to build out an architecture that was a bit more future-focused than our prior config.” Posted by u/emcee__escher
Takeaway: GA4’s data sampling constraints on high-traffic Exploration reports are a documented operational burden for enterprise analytics teams (often forcing BigQuery as a workaround) confirming that the free Standard tier’s value proposition weakens materially at scale.
- Interface Complexity: Google Analytics 4’s Exploration paradigm removed the familiar session-based mental models from Universal Analytics, carrying a meaningful learning curve consistently rated a friction point by practitioners: “GA4’s interface feels overly complicated… The UI is messy and makes extracting meaningful insights a pain” (r/lovable, 2025).
- Web Analytics Scope Only: Google Analytics 4 is a web and app analytics tool and does not perform BI dashboarding, product behavioral analytics at the depth of Mixpanel or Amplitude, or semantic governance at the level of Looker, meaning organizations with broader analytics needs require supplementary tooling regardless of GA4’s strength in its native lane.
Verdict
Google Analytics 4 is the most evidence-backed, most widely adopted, and most cost-accessible analytics platform in the world as of 2026, earning the #1 ranking by leading all seven platforms on verified review volume (12,847 G2 reviews at 4.5 stars), free-tier value ($0 for up to 10M events/month across 29M-plus websites), and quantified performance evidence. Google Analytics 4 is the correct default for any organization running Google Ads campaigns and an appropriate standalone analytics solution for most organizations outside EU jurisdictions with active GDPR enforcement concerns. Organizations operating under strict EU data-residency requirements, or those prioritizing product behavioral analytics over marketing attribution, should evaluate privacy-first alternatives or supplementary tools alongside GA4.
2. Microsoft Power BI: Best Business Intelligence Platform
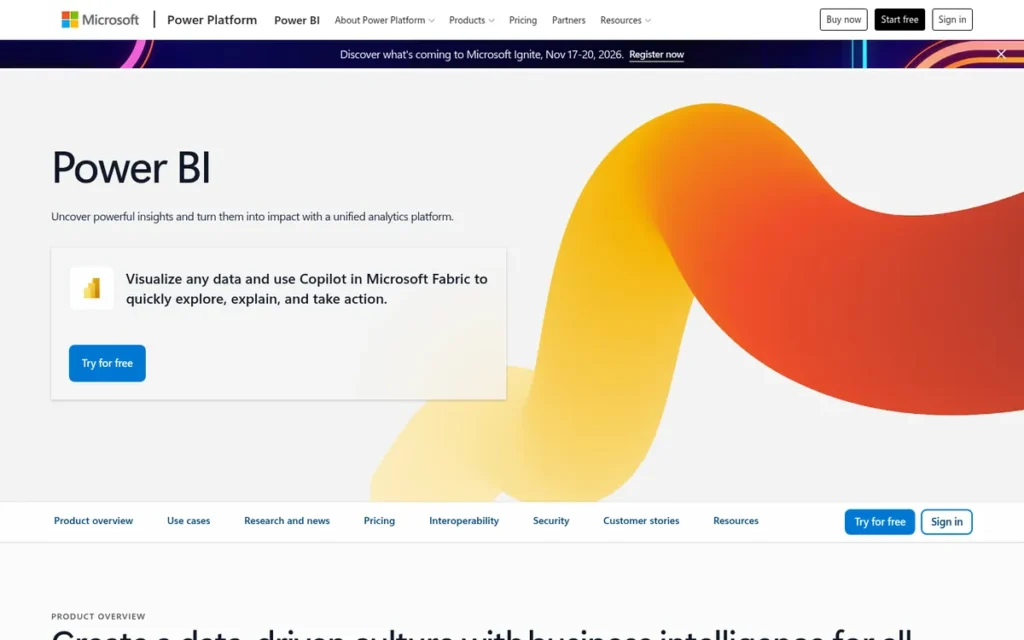
Category: Business Intelligence Visualizer, connects to organizational data sources, transforms and models data, and delivers interactive dashboards and governed reports for business decision-making.
At a Glance
- Category: Business Intelligence Visualizer
- Best For: Business analysts, Excel users, and BI teams at organizations already running Microsoft 365, Azure, or Dynamics 365 who need governed enterprise dashboards and AI-assisted analytics at the lowest per-user cost in the paid BI category
- Price Range: $0 (Desktop authoring only); $14/user/month (Pro); $24/user/month (Premium Per User); $5,450/month (Premium Per Capacity, unlimited users)
- Primary Strength: Microsoft Power BI has been named a Gartner Magic Quadrant Leader in Analytics and Business Intelligence for 18 consecutive years through the 2025 report, the longest-running independent analyst validation in the analytics category [Source: Microsoft Power BI Blog, 2025]
- Biggest Limitation: Microsoft Power BI is optimized for Azure and Microsoft 365 environments; organizations running AWS- or Google Cloud-centric data stacks face more complex integration paths and lose significant ecosystem synergy
- One-Line Summary: Microsoft Power BI is the global BI market-share leader at approximately 20% of deployments, offering the lowest per-user cost of any enterprise BI platform at $14 per user per month, and often $0 for organizations with Microsoft 365 E5 licenses
- Last Verified: May 2026
Overview
Microsoft Power BI is a business intelligence and data visualization platform from Microsoft Corporation that enables business analysts, data teams, and executive stakeholders to connect to hundreds of data sources, build interactive dashboards, and share governed reports across organizations, serving users from solo Excel practitioners to petabyte-scale enterprise data teams through a unified suite spanning Desktop, Service, Mobile, and Embedded deployment modes.
Microsoft Power BI holds approximately 20% of the global BI market and has been named a Gartner Magic Quadrant Leader in Analytics and Business Intelligence for 18 consecutive years through the 2025 report [Source: Microsoft Power BI Blog, 2025], reflecting both feature breadth and the commercial trust generated by Microsoft’s enterprise relationships.
Microsoft Power BI Pro at $14 per user per month represents the most cost-favorable entry point in the enterprise BI category, and is often effectively $0 for organizations whose Microsoft 365 E5 licenses already include Power BI Pro at no incremental cost.
Key Features
- Power BI Copilot: Microsoft Power BI Copilot generates optimized DAX queries from natural-language prompts, creates complete report pages from text descriptions, provides filter-aware summaries, and delivers mobile voice-dictation analytics, making AI-native BI authoring more accessible to non-technical business analysts than any competing platform as of 2026.
- VertiPaq In-Memory Compression: Microsoft Power BI’s VertiPaq engine compresses large datasets for fast in-memory queries, while Premium Capacity supports petabyte-scale DirectQuery processing without per-user licensing costs, delivering faster query performance per dollar than extract-based competitors in Microsoft cloud environments.
- Microsoft Ecosystem Integration: Microsoft Power BI integrates natively with Teams, Excel, and Dynamics 365, enabling analysts to embed live dashboards in team channels, analyze Power BI datasets from Excel pivot tables, and pull CRM data without custom connectors, the lowest adoption friction for organizations already in the Microsoft stack.
This structural ecosystem advantage is consistently cited as Power BI’s defining differentiator by practitioners on r/BusinessIntelligence:
“Basically it works well with the Microsoft stack, is easy to pickup and learn for intermediate-advanced excel users, and feels familiar for people familiar with Microsoft products (nearly everybody). I’ve done basic training in Tableau, but it just feels way less intuitive. Power BI just continues to grow and become more integrated for any business using Office 365, so I expect it to just grow more dominant over the years. The other tools may have had more options more quickly, but they’ll never have the kind of integration Power BI has/will have just by nature of it being a Microsoft business product.” Posted by u/tophmcmasterson
Takeaway: Power BI’s durable competitive advantage is its compounding Microsoft ecosystem integration, not merely its price, practitioners in Office 365 environments consistently describe competing BI tools as structurally disadvantaged on integration depth regardless of feature parity.
- Free Windows Desktop Authoring: Microsoft Power BI Desktop is a free Windows application enabling full report development locally without cloud infrastructure, with Power BI Service providing browser-based collaboration, scheduled refresh, and row-level security for Pro and Premium license holders.
- Microsoft Fabric Integration: Microsoft Fabric unifies Power BI with Azure Data Factory, Synapse Analytics, and real-time intelligence in a single governed environment, with Direct Lake on OneLake reaching GA status in the Power BI April 2026 Feature Summary, reducing data duplication and refresh latency for integrated architectures.
Best For
Microsoft Power BI is best for business analysts, data engineers, and BI teams at organizations already invested in the Microsoft ecosystem (particularly those running Microsoft 365, Azure, Teams, or Dynamics 365) where native integrations, Excel-user familiarity, and $14/user/month pricing (or $0 via E5 bundling) provide a decisive total-cost-of-ownership advantage over Tableau and Looker for equivalent BI and dashboarding workflows.
Pricing
Microsoft Power BI pricing as of May 2026, verified against Microsoft’s official pricing page:
- Free ($0): Power BI Desktop authoring only: no cloud sharing or collaboration
- Pro ($14/user/month): Full cloud collaboration, 10GB/user storage, Teams embedding, scheduled refresh
- Premium Per User ($24/user/month): Paginated reports, advanced AI features, 100GB/user, XMLA read/write
- Premium Per Capacity (from $5,450/month): Unlimited users, enterprise-scale workloads, Fabric integration
Organizations with Microsoft 365 E5 licenses already have Power BI Pro included at no incremental cost, the E5 bundling scenario is the most frequently cited reason Microsoft-ecosystem organizations default to Power BI before any formal BI evaluation begins. A 60-day free trial is available on Pro and Premium tiers.
Strengths
- 18-Year Gartner Leadership: Microsoft Power BI has held the #1 position in Gartner’s Magic Quadrant for Analytics and Business Intelligence Platforms for 18 consecutive years through the 2025 report (praised for both Completeness of Vision (furthest right for 7 consecutive years) and Ability to Execute (highest position)) the most sustained independent analyst validation of any platform in this evaluation.
- 5× Cost Advantage Over Tableau: Microsoft Power BI Pro at $14 per user per month is 5× less expensive than Tableau Standard Creator at $75 per user per month (verified against both vendors’ official pricing pages, May 2026), for a 100-person analytics team, a documented annual cost difference of approximately $734,400.
- Global BI Market Leader: Microsoft Power BI holds approximately 20% of the global business intelligence market share as of 2025 [SRAnalytics BI market analysis, 2026] (the highest of any single BI platform) driven in part by Microsoft’s bundling strategy placing Power BI Pro inside Microsoft 365 E5 subscriptions.
- Continued AI Investment: Microsoft Power BI’s September 2025 Feature Summary and April 2026 Feature Summary confirmed Copilot capabilities across Desktop, Service, and Mobile (including web-based Power Query editing and calculated columns in-browser) validating Microsoft’s aggressive AI-native BI development cadence.
Limitations
- Microsoft Ecosystem Dependency: Microsoft Power BI is deeply optimized for Azure and Office 365 environments, organizations running AWS, Google Cloud, or non-Microsoft data stacks face more complex integration paths, and sharing reports with external stakeholders who lack Microsoft accounts requires Pro or Premium licenses, limiting partner-facing analytics accessibility.
- Windows-Only Desktop Authoring: Microsoft Power BI Desktop is a Windows-only application, creating friction for organizations with macOS-primary analytics teams who must use the browser-based Service for authoring rather than the more fully featured Desktop environment, a limitation not disclosed in most sales conversations.
- DAX Learning Curve: Microsoft Power BI’s DAX formula language for custom calculations carries a steep learning curve (closer to SQL than Excel in its demands) constraining self-serve analytical depth for non-technical users and consistently appearing as a friction point across 8,912 G2 reviews at 4.5/5.0.
- Visualization Flexibility Ceiling: Microsoft Power BI’s built-in chart library is narrower than Tableau’s for highly complex or custom chart types, analysts requiring Sankey diagrams, animated transitions, or geographic maps at Tableau’s level of freeform exploration will find Power BI limiting without custom visual development.
Practitioners on r/BusinessIntelligence offered a balanced first-hand summary of where Power BI succeeds and where it falls short:
“To answer your question succinctly : it’s a fantastic all-in-one tool that covers a very broad range of functionality for small and large teams. It does so cheaply and well enough to cover all your needs at least a little bit. Together with aggressive release schedules and broad adoption, PBI will be the long term winner.
For more specific needs, other tools can be better. Tableau makes the best « stunning visuals », Qlik is a fully customisable, web-first powerhouse, to give an example.
Better because: Easy to use (looking at you Qlik), Cheap for small and medium teams, Complete solution, all in one, Fully integrated in the ms stack, Easy server admin (access rights, sharing, …), good with tables
Worse because (at least last I used it): MS style interface, Limited visual freedom, Used to crash a lot, Not fully customisable / code first / difficult automation , Can get frustrating to work with sometimes (nested functions, date conversion, …)
Sorry for the mobile formating” Posted by u/dadadawe
Takeaway: Power BI practitioners consistently identify limited visual freedom and DAX complexity as genuine limitations, confirming its “strong enough for most needs” positioning rather than best-in-class for visualization depth or non-Microsoft stack flexibility.
Verdict
Microsoft Power BI is the global business intelligence market leader as of 2026, earning the #2 overall ranking by combining 18 consecutive years of Gartner Magic Quadrant leadership, the second-largest verified review base at 8,912 G2 reviews at 4.5 stars, and the lowest per-user cost of any enterprise BI platform at $14 per user per month. Microsoft Power BI is the correct default for any organization already operating in the Microsoft 365 or Azure ecosystem, where native integration depth, AI Copilot capabilities, and E5 license bundling create a total-cost-of-ownership advantage no competitor has matched. Organizations whose primary infrastructure runs on Google Cloud or AWS, or whose analytics needs center on advanced custom visualization rather than governed dashboarding, should compare Microsoft Power BI against Tableau or Looker before committing.
3. Mixpanel: Best Product Analytics Platform
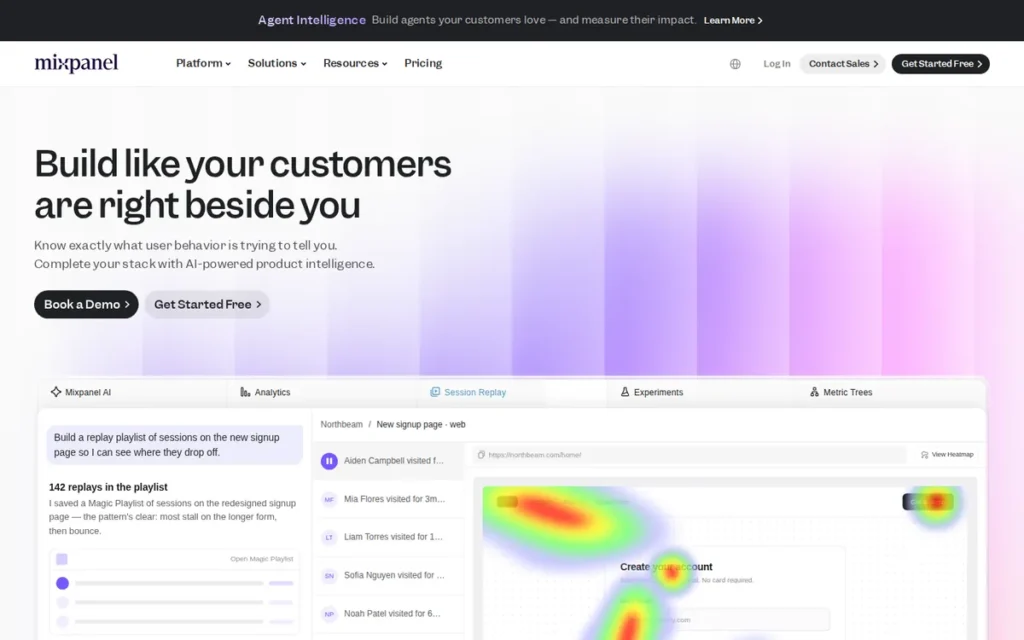
Category: Product Analytics Tracker, collects user action events within digital products and enables behavioral analysis including funnels, retention, user journeys, and feature usage.
At a Glance
- Category: Product Analytics Tracker
- Best For: Product managers, growth engineers, and SaaS or mobile app teams needing event-based behavioral analytics, transparent pricing, and fast time-to-first-insight without enterprise sales engagement
- Price Range: Free (1M events/month); Growth from $25/month; Enterprise $20,000–$100,000-plus/year
- Primary Strength: Mixpanel’s retroactive analysis capability allows product teams to define new custom events and immediately apply them to historical user data, eliminating the re-instrumentation bottleneck that delays insight at every other manual-tracking platform
- Biggest Limitation: Mixpanel requires intentional event instrumentation by a developer before meaningful behavioral data is collected, teams without dedicated engineering time will experience delayed and lower-quality initial data
- One-Line Summary: Mixpanel is the product analytics platform most recommended by practitioner communities for teams that invest in clean event instrumentation, offering the most transparent pricing, the most generous free tier, and retroactive analysis capability unavailable in directly comparable commercial platforms
- Last Verified: May 2026
Overview
Mixpanel is an event-based product analytics platform founded in 2009 that enables product managers, growth teams, and engineers to track user actions within digital products (from button clicks and feature interactions to onboarding steps and purchase flows) and answer behavioral questions without writing SQL, serving thousands of companies globally from early-stage startups to enterprise SaaS organizations.
Mixpanel maintains a 4.5/5.0 G2 rating across 1,234 verified reviews (the highest volume-to-rating combination of any specialized product analytics platform evaluated) and has been in production use for 15-plus years, surviving multiple competitive cycles including Amplitude’s rise and PostHog’s open-source disruption.
Mixpanel’s free tier covering 1 million events per month and its publicly disclosed Growth pricing starting at $25 per month make it the most transparently priced and accessible entry point in the product analytics category.
Key Features
- Retroactive Analysis: Mixpanel’s retroactive analysis capability allows product teams to define new custom events retroactively and apply them to historical user data without re-instrumentation, eliminating the “we should have tracked that” problem that requires forward-only event logging and weeks of waiting at competing commercial platforms where this capability is unavailable.
- Flows Visualization: Mixpanel’s Flows feature maps all actual user navigation paths through a product dynamically (not just pre-defined funnels) surfacing unexpected drop-off points, alternative journeys, and usage patterns that funnel analysis alone would never reveal.
- Session Replay and Heatmaps: Mixpanel includes built-in Session Replay and Heatmaps alongside its event analytics, allowing product teams to pair aggregate funnel data with individual session recordings to understand the behavioral “why” within a single platform, without purchasing a separate session recording tool.
- Autocapture: Mixpanel’s Autocapture feature automatically collects interactions from web and mobile apps without manual event tagging, enabling teams to start analyzing behavior before completing full SDK instrumentation, while the platform also supports intentional manual instrumentation for teams that prioritize data precision over speed.
- Feature Flags: Mixpanel’s Feature Flags capability enables product teams to roll out new features to targeted user segments and measure behavioral impact within the same platform, reducing toolchain dependency on separate feature-flag services for controlled product rollouts.
Best For
Mixpanel is best for product managers, growth engineers, and SaaS or mobile app teams at Series A through Series C-stage companies (and mid-market technology organizations) that need event-level behavioral analytics to improve feature adoption, reduce churn, and optimize onboarding flows, particularly when pricing transparency and fast time-to-insight are evaluation constraints and dedicated engineering time is available for clean event instrumentation.
Pricing
Mixpanel pricing as of May 2026, verified against Mixpanel’s pricing page:
- Free ($0): Up to 1 million events/month, unlimited seats, core analytics features
- Growth (from $25/month billed annually): Scaling with event volume: a full self-serve pricing calculator is available publicly without a sales call
- Enterprise (custom, typically $20,000–$100,000-plus/year): Advanced governance, dedicated support, SLAs
Mixpanel is the only major product analytics platform that publicly discloses its full pricing tier structure with a self-serve volume calculator. A 14-day trial is available on paid tiers. One practitioner confirmed significant savings: “For our tracking needs, and user count, and event volume, Mixpanel was $80k cheaper than Amplitude” (u/justphotosofdave, r/ProductManagement, 2025), though volume configurations vary and both platforms should be evaluated against specific event volumes.
Strengths
- Highest Independent Score in Sub-Category: Mixpanel achieved a 91% overall feature and value rating in independent head-to-head product analytics comparisons [Source: Crozdesk product comparison directory, accessed May 2026] (tied with Amplitude and above Heap at 88%) with specific strength in real-time granular event tracking and self-serve querying speed.
- Category-Leading Retroactive Analysis: Mixpanel’s retroactive analysis capability (defining a new custom event and immediately applying it to historical behavioral data without re-instrumentation) is documented as unavailable in directly comparable commercial product analytics platforms including Amplitude and Heap as of May 2026 [Mixpanel pricing, May 2026], directly eliminating the instrumentation debt problem that delays analysis at platforms relying solely on forward-only event logging.
- Most Generous Free Product Analytics Tier: Mixpanel’s free tier covers 1 million events per month at no cost, the most generous free product analytics ceiling of any platform in this evaluation, sufficient for early-stage startups to run full production analytics before spending a dollar [Mixpanel pricing, May 2026].
- Practitioner-Validated Accessibility: Community validation from r/ProductManagement confirms Mixpanel’s time-to-insight advantage: “Mixpanel is damn simple to learn such that you’re getting 80% of the value fairly quickly” (u/michinya, r/ProductManagement, 2025), a platform that rewards investment without months of onboarding.
Limitations
- Engineering Dependency for Quality Data: Mixpanel’s most consequential trade-off is its instrumentation requirement, while Autocapture provides a faster start, teams that want precise, intentional event data still need a developer to define, instrument, and maintain an event schema: “Do NOT bother to do this unless you have an engineer who can dedicate solid time to setting it up properly and maintain it” (u/michinya, r/ProductManagement, 2025).
- Scope Limited to Product Analytics: Mixpanel does not perform BI dashboarding for financial or operational reporting, does not provide semantic governance for cross-team metric consistency, and does not cover web traffic and Google Ads attribution with the depth GA4 provides, meaning most Mixpanel deployments require at least one supplementary platform to cover the full analytics surface.
- Enterprise Pricing Opacity: Mixpanel’s Enterprise tier requires sales engagement before any dollar figure is disclosed, meaning the pricing transparency advantage (public Growth tier calculator) disappears at enterprise scale, though this is a less severe gap than Amplitude, which also gates Growth tier pricing behind sales calls.
- Absence of Semantic Governance Layer: Mixpanel does not enforce centralized metric definitions across teams or workspaces, the same event name defined inconsistently in two project configurations produces divergent metric values without any platform-level warning or enforcement, requiring organizational documentation conventions rather than structural architecture to maintain cross-team data quality at scale.
Verdict
Mixpanel is the highest-evidence, most transparently priced, and most accessible product analytics platform in the market as of 2026, earning the #3 overall ranking and the #1 position within the product analytics sub-category on the strength of a 4.5/5.0 G2 rating across 1,234 verified reviews, the most generous free tier in its category, and a retroactive analysis capability unique among commercial platforms at comparable price points. Mixpanel is the correct starting point for any product or growth team evaluating event-based behavioral analytics where pricing transparency and engineering constraints are real factors. Teams without dedicated engineering time for clean event instrumentation should evaluate Amplitude’s Autocapture or PostHog’s open-source self-hosting as alternatives before committing.
4. Tableau: Best Data Visualization Platform
Category: Data Visualization and BI Platform, enables drag-and-drop visual exploration of structured data, producing interactive dashboards, executive reports, and analytical stories for business and data analyst audiences.
At a Glance
- Category: Data Visualization and BI Platform
- Best For: Data analysts, BI professionals, and organizations requiring sophisticated custom visualizations and polished executive dashboards, particularly those in the Salesforce ecosystem or with data sovereignty requirements preventing cloud-only deployment
- Price Range: Tableau Public ($0, public data only); Standard Creator $75/user/month; Enterprise Creator $115/user/month; Explorer $42/user/month; Viewer $15/user/month (all billed annually, minimum 1 Creator license required)
- Primary Strength: Tableau’s VizQL engine enables a level of freeform visual exploration (including Sankey diagrams, animated transitions, and custom geographic maps) that no competing BI platform matches without writing code
- Biggest Limitation: Tableau’s Standard Creator license at $75 per user per month is five times more expensive than Power BI Pro, and its extract-based architecture degrades in performance when analysts explore granular, non-aggregated data at enterprise scale
- One-Line Summary: Tableau is the visualization gold standard for data professionals (with VizQL-powered freeform exploration and AI-generated Pulse insights) but its $75 per user per month Standard Creator pricing and granular data performance ceiling make it most justified for organizations where visualization depth is a documented strategic requirement
- Last Verified: May 2026
Overview
Tableau is a data visualization and business intelligence platform founded in 2003 and acquired by Salesforce in 2019 for $15.7 billion, enabling data analysts and BI professionals to connect to hundreds of data sources and build sophisticated interactive dashboards, geographic maps, and analytical stories through its proprietary VizQL engine (without writing SQL) at an estimated 16.4% global BI market share that places it second only to Power BI.
Tableau holds a 4.4/5.0 G2 rating across 5,672 verified reviews, with consistent practitioner recognition as the “undisputed leader in data visualization” and the “gold standard for executive storytelling” across multiple independent 2026 BI analyses [PowerBI Consulting Visualization Comparison, 2026].
Tableau’s Standard Creator license at $75 per user per month is the highest per-user entry price of any BI platform in this evaluation, a cost reality that must be weighed transparently against its unmatched visualization depth in any objective assessment.
Key Features
- VizQL Visual Query Language: Tableau’s VizQL engine translates drag-and-drop interactions directly into optimized database queries, enabling analysts to build Sankey diagrams, density plots, animated chart transitions, custom geographic maps, and sunburst charts without code, at a level of freeform exploration that Power BI and Looker require significant custom development to approximate.
- Tableau Pulse: Tableau Pulse delivers AI-generated plain-language insight summaries to business stakeholders via email, Slack, and conversational interfaces on a scheduled or triggered basis, pushing analytics value to decision-makers who would never navigate to a dashboard without being prompted.
- Tableau Agent and Explain Data: Tableau Agent provides conversational analytics for natural-language questions, while Explain Data automatically surfaces statistical reasons for data anomalies or spikes, reducing the time analysts spend on routine investigation tasks that previously required manual drill-down.
- Cloud and On-Premises Deployment Flexibility: Tableau supports both fully managed cloud deployment (Tableau Cloud) and self-hosted on-premises or private cloud deployment (Tableau Server on AWS, Azure, Google Cloud, or private infrastructure), providing data sovereignty flexibility that cloud-only BI platforms cannot accommodate.
- Tableau Prep: Tableau Prep provides visual, code-free ETL and data cleaning capabilities within the Tableau ecosystem, reducing dependency on separate data engineering tooling for routine transformation tasks before analysis begins.
Best For
Tableau is best for data analysts, BI professionals, and analytics-led organizations, particularly those serving executive audiences requiring polished visual storytelling, operating in industries where sophisticated geographic or custom chart types are standard deliverables, or already embedded in the Salesforce CRM ecosystem, where the $75/user/month Standard Creator cost is justified by VizQL’s visualization depth and no competing platform replicates that capability without code.
Pricing
Tableau pricing as of May 2026, verified against tableau.com/pricing:
- Tableau Public ($0): Public-data visualization only: not suitable for proprietary business data
- Standard Creator ($75/user/month billed annually): Full authoring access; minimum 1 Creator required per deployment
- Enterprise Creator ($115/user/month billed annually): Advanced enterprise governance features; contact Tableau sales for access
- Explorer ($42/user/month): Limited authoring capabilities
- Viewer ($15/user/month): Consume-only access to published dashboards
All deployments require at least one Creator license. A 14-day free trial is available on Creator. At $75/user/month Standard Creator, Tableau is 5× more expensive than Power BI Pro ($14/user/month), for a 50-person analytics team, an annual difference of approximately $36,600 versus $8,400. Organizations quoted Enterprise Creator pricing ($115/user/month) will find the cost gap versus Power BI Pro approximately 8×.
Strengths
- Second-Largest BI Market Share: Tableau holds a 16.4% global BI market share as of 2026 [SRAnalytics BI market analysis, 2026], placing it second only to Power BI’s approximately 20%, and is independently characterized as the “gold standard for executive storytelling” and “undisputed leader in data visualization” across multiple 2026 BI analyses [PowerBI Consulting, 2026].
- VizQL Technical Moat: Tableau’s VizQL engine, developed as a Stanford research spinout in 2003, remains the only BI platform technology that translates drag-and-drop visual interactions directly into database-optimized queries in real time, enabling chart types and exploration depth practitioners consistently cite as unavailable in Power BI or Looker without extensive custom development.
- Salesforce Ecosystem Access: Tableau’s $15.7 billion Salesforce acquisition (2019) provides native Salesforce CRM data connectors and shared enterprise sales relationships across Salesforce’s 150,000-plus customer base, a structural distribution advantage for organizations already evaluating Salesforce products.
- Continued Visualization Investment: Tableau’s April 2026 feature update added native Sankey chart support, mixed geometry spatial analysis, and enhanced table color formatting [Source: Tableau New Features blog, April 2026, tableau.com/products/new-features], validating ongoing investment in visualization depth that justifies its premium positioning.
Limitations
- Premium Pricing vs. Equivalent BI Alternatives: Tableau’s Standard Creator at $75 per user per month is 5× more expensive than Power BI Pro, a cost premium that practitioners identify as creating sunk-cost mentality once annual contracts are signed: “I can’t believe the license costs. It’s like an invitation to having a sunk cost mentality” (r/datascience, 2025).
- Granular Data Performance Ceiling: Tableau’s extract-based architecture struggles at scale with non-aggregated granular data, as practitioner u/MindlessTime noted (39 upvotes, r/datascience, 2025): “The only solution is to pre-aggregate the data… But then you lose the ability to drill down, which is kind of the point of Tableau.”
- Post-Acquisition Product Direction Uncertainty: Post-Salesforce acquisition concerns about pricing trajectory and product prioritization are consistently cited in community discussions, with one practitioner observation capturing the dominant sentiment: “Tableau is a BI tool for corporations and safe people” (u/perkypeanut, r/tableau, 2025).
- Creator License Floor Cost: Tableau requires at least one Creator license ($75/user/month Standard, $115/user/month Enterprise) per deployment, adding a mandatory floor cost even for organizations that primarily need Viewer-tier access for the majority of their team, making total deployment cost higher than advertised starting prices suggest.
Verdict
Tableau is the visualization gold standard in enterprise analytics and earns the #4 overall ranking on the strength of 5,672 G2 reviews at 4.4 stars, 16.4% global BI market share, and two decades of practitioner recognition as the platform of choice when visual quality and freeform exploration depth are non-negotiable requirements. Tableau is the correct selection for data-professional-led organizations (particularly those in the Salesforce ecosystem or with data sovereignty requirements) where the $75/user/month Creator cost is explicitly justified by VizQL’s capabilities and where Pulse-delivered insights extend analytics value beyond the analyst community. Organizations evaluating Tableau primarily for standard dashboarding and reporting should compare Microsoft Power BI Pro at $14/user/month and benchmark both platforms against granular production data volumes before signing annual contracts.
5. Amplitude: Best Enterprise Product Intelligence Platform
Category: Enterprise Product Intelligence Platform, tracks user behavioral events across digital products, models complete user journeys at scale, and integrates A/B experimentation and customer data management for enterprise product and data teams.
At a Glance
- Category: Enterprise Product Intelligence Platform
- Best For: Enterprise product teams and B2C technology companies managing multi-product platforms who need integrated behavioral analytics, built-in A/B experimentation, and cross-product user journey modeling with dedicated engineering resources
- Price Range: Free Starter (10M events/month, 50K MTU); Plus from $49/month; Growth custom from approximately $20,000/year; Enterprise custom $50,000-plus/year
- Primary Strength: Amplitude’s behavioral graph architecture enables product teams to model complete multi-product user journeys (connecting actions, cohorts, sequences, and outcomes across platforms) at a depth and scale that event-log platforms cannot replicate
- Biggest Limitation: Amplitude’s Growth and Enterprise pricing requires sales engagement before any number is disclosed, and its implementation complexity (requiring structured upfront event taxonomy design) means teams without data engineering resources face weeks of onboarding before seeing meaningful insights
- One-Line Summary: Amplitude is the enterprise product intelligence platform most trusted by large-scale B2C and SaaS organizations, with a behavioral graph architecture, built-in A/B experimentation, and named enterprise customers including NBCUniversal, Atlassian, and Under Armour, designated by practitioner communities as the graduation platform for product analytics teams at scale
- Last Verified: May 2026
Overview
Amplitude is an enterprise behavioral analytics and product intelligence platform founded in 2012 that models complete user journeys across digital products through its behavioral graph architecture, enabling product teams, growth analysts, and data engineers at large-scale organizations to measure feature adoption, retention drivers, conversion funnels, and cross-product behavioral patterns at levels of complexity that event-log platforms cannot sustain.
Amplitude went public on the Nasdaq (AMPL) in September 2021 via direct listing and serves named enterprise customers including NBCUniversal, Atlassian, Under Armour, and Shopify per the company’s 2021 S-1 filing [Source: Amplitude Nasdaq S-1, September 2021], maintaining a 4.5/5.0 G2 rating across 678 verified reviews.
Amplitude extends beyond analytics into a full product intelligence suite that includes Amplitude Experiment (built-in A/B testing), Amplitude Data (customer data platform for identity resolution), and Session Replay with Heatmaps, positioning the platform as a multi-tool replacement rather than a single analytics layer.
Key Features
- Behavioral Graph Architecture: Amplitude’s behavioral graph models the relationships between user actions, cohorts, sequences, and product outcomes over time, enabling cross-product user journey analysis and multi-step behavioral modeling that platforms relying on individual event logs cannot resolve at enterprise data volumes.
- Amplitude Experiment: Amplitude Experiment provides native A/B, multivariate, and feature-flag testing with full behavioral impact measurement within the same platform where product analytics live, eliminating data reconciliation errors that occur when experimentation and analytics run in separate tools.
- Amplitude Data (CDP): Amplitude Data functions as a customer data platform with identity resolution capabilities, merging behavioral data from web, iOS, and Android into unified persistent user profiles without requiring custom data engineering or separate CDP tooling.
- Out-of-the-Box Analytics Views: Amplitude’s pre-configured Product, Onboarding, Feature, and Retention dashboards deliver behavioral metrics within hours of instrumentation, reducing time-to-first-insight for teams that have not yet built bespoke analysis frameworks.
- AI Copilot and Anomaly Detection: Amplitude’s AI Copilot enables conversational analytics through natural-language interactions with behavioral data, while anomaly detection proactively alerts product teams to statistically significant changes in key metrics before manual dashboard review catches them.
Best For
Amplitude is best for enterprise product teams, growth organizations, and B2C technology companies running multi-product platforms at scale, particularly those that need behavioral analytics, integrated A/B experimentation, and cross-product user journey modeling in a single platform and have structured engineering resources for event taxonomy design, with named customer evidence from the 2021 S-1 including NBCUniversal, Atlassian, Under Armour, and Shopify validating its enterprise scalability.
Pricing
Amplitude pricing as of May 2026, verified against amplitude.com/pricing:
- Starter ($0): Up to 10 million events/month and 50,000 MTU, basic analytics features
- Plus ($49/month billed annually): For 10M events/month, scaling to approximately $995/month for 300M events/month
- Growth (custom, from approximately $20,000/year): Advanced governance and experimentation, requires sales engagement
- Enterprise (custom, $50,000-plus/year): Unlimited events, advanced security, SSO, SLAs, dedicated customer success, requires sales engagement
Qualifying early-stage startups can access the Startup Program at up to 200,000 MTU free. A 14-day trial is available on paid plans. Amplitude’s Growth and Enterprise tiers require sales engagement, no self-serve pricing is available for those tiers, in direct contrast to Mixpanel’s publicly calculable Growth pricing.
Strengths
- Enterprise Product Intelligence Standard: Amplitude achieved a 91% overall feature and value rating in independent product analytics comparisons [Source: Crozdesk product comparison directory, accessed May 2026] (tied with Mixpanel and above Heap at 88%) with specific competitive advantage in enterprise-scale behavioral cohort analysis, multi-product tracking, and integrated experimentation workflow depth.
- Practitioner “Graduation Platform” Designation: Amplitude is designated by product analytics communities as the platform teams migrate to at scale: “Amplitude is where most orgs end up eventually” (r/ProductManagement, 2025), reflecting documented consensus that its behavioral graph handles enterprise complexity requirements that smaller platforms cannot accommodate.
- Public Company Transparency: Amplitude’s Nasdaq listing (AMPL, direct listed September 2021) provides quarterly financial disclosure and named customer transparency, with verifiable enterprise deployments at NBCUniversal, Atlassian, Under Armour, and Shopify per the S-1 filing validating production-scale credibility unavailable from privately held competitors.
- Integrated Experimentation Workflow: Amplitude Experiment’s built-in A/B and multivariate testing within the behavioral analytics platform eliminates a separate toolchain dependency, practitioners cite reduced data reconciliation overhead and accelerated learn-build-measure cycles compared to running experimentation in a separate tool.
Limitations
- Pricing Opacity at Enterprise Scale: Amplitude’s most consequential trade-off is that Growth and Enterprise pricing requires sales engagement before any number is disclosed (unlike Mixpanel’s publicly calculable Growth tier) a friction that practitioners in r/ProductManagement and r/SaaS identify as a barrier to self-directed budget evaluation.
- Implementation Complexity and Free-Tier Ceiling: Amplitude requires structured upfront event taxonomy design taking engineering teams days to weeks before behavioral data is analytically useful, compounded by its 50,000 MTU free-tier ceiling, which pushes early-stage teams into paid tiers earlier in their evaluation cycle.
- AI Feature Skepticism: AI analytics claims are subject to documented practitioner skepticism specifically in Amplitude discussions, as u/middlerange observed in r/SaaS (2025): “Most of what’s being sold as AI analytics is really just chat with your data, natural language queries that write SQL and return charts. They’re selling you a faster horse”, a criterion buyers should apply when evaluating Amplitude’s Copilot marketing against production use cases.
- Limited Marketing Attribution Depth: Practitioners running Amplitude alongside dedicated attribution tools have noted that Amplitude underperforms on upstream marketing attribution compared to specialized tools, with one practitioner specifically maintaining Amplitude for product-usage analytics while migrating marketing attribution to a separate platform (u/danda_musna, r/SaaS, 2025).
Verdict
Amplitude is the leading enterprise product intelligence platform as of 2026, earning the #5 overall ranking on the strength of 678 G2 reviews at 4.5 stars, a behavioral graph architecture uniquely suited to multi-product enterprise use cases, and integrated A/B experimentation that eliminates a separate toolchain for product-led growth teams. Amplitude is the correct choice for enterprise-scale B2C technology organizations where cross-product behavioral modeling, governance depth, and built-in experimentation justify higher implementation complexity and opaque enterprise pricing. Teams at earlier stages, with smaller engineering capacity, or with pricing transparency as a hard requirement should evaluate Mixpanel’s equivalent capabilities and publicly calculable Growth pricing before engaging Amplitude’s sales process.
6. Looker (Google Cloud): Best Semantic BI Platform
Category: Semantic Business Intelligence Platform, enforces consistent metric definitions across all organizational dashboards through a governed LookML modeling layer, querying live data warehouses rather than data extracts.
At a Glance
- Category: Semantic Business Intelligence Platform
- Best For: Enterprise data engineering teams and large organizations (500-plus employees) with mature cloud data warehouse infrastructure who need a governed single source of truth for all business metrics across multiple departments
- Price Range: Looker Studio Pro $9/user/month (distinct, lower-complexity product); Looker Standard approximately $60,000–$240,000/year; Looker Enterprise approximately $240,000–$1,200,000-plus/year; all enterprise tiers require sales engagement
- Primary Strength: Looker’s LookML semantic layer is the only major BI architecture that enforces a single, Git-versioned definition of every business metric organization-wide, ensuring finance, marketing, and product teams see identical numbers for identical queries
- Biggest Limitation: Looker’s minimum annual contract of approximately $60,000 per year and its LookML learning curve (requiring SQL-experienced analytics engineers) effectively exclude all but large enterprises with mature data teams from practical deployment
- One-Line Summary: Looker is the enterprise semantic BI platform that solves the “different teams, different numbers” governance problem through a Git-versioned LookML semantic layer, with real-time in-database queries and the most granular user permissioning controls in the category, at an enterprise-only price floor of approximately $60,000 per year
- Last Verified: May 2026
Overview
Looker is a cloud-native business intelligence platform acquired by Google (Alphabet) in June 2019 for approximately $2.6 billion [Source: Alphabet official announcement, June 2019], built around a fundamentally different architecture than extract-based BI tools: instead of pulling data into an in-memory cache, Looker queries source databases directly and in real time through LookML, a SQL-based, Git-versioned semantic modeling language that defines business logic, metrics, joins, and dimensions in a single governed layer shared across all dashboards and all teams.
Looker holds a 4.4/5.0 G2 rating across 456 verified reviews, a lower review volume that reflects its enterprise-only pricing floor rather than product quality, with practitioners consistently validating its governance and permissioning architecture as the most sophisticated in the BI category.
LookML functions as an organization’s metrics layer, a centralized, version-controlled repository of business logic that any connected BI tool or API consumer can query against, enabling what practitioners call headless BI: analytics served through governed definitions rather than static dashboard configurations.
Key Features
- LookML Semantic Layer: Looker’s LookML semantic modeling layer defines every business metric (revenue, active users, conversion rates) in a single Git-versioned SQL-based model that all dashboards query, ensuring every team sees the same numbers for the same definitions and eliminating the metric disagreement problem that plagues organizations relying on dashboard-level calculated fields.
- Real-Time In-Database Query Model: Looker submits queries directly to source data warehouses at the moment a dashboard is viewed, providing real-time data freshness without extract refresh scheduling, making every Looker dashboard a live view of the warehouse rather than a cached snapshot that may be hours or days old.
- Granular User Permissioning: Looker’s row-level, column-level, and field-level security controls are documented by enterprise practitioners as “head and shoulders above the alternatives when it comes to user permissioning and data security controls” (u/CheeseDog_, r/dataanalysis, 2024), enabling granular data governance without custom development.
- Gemini AI Integration: Looker’s Gemini AI integration (2025–2026 updates) enables conversational BI agents that answer natural-language questions against the governed LookML semantic layer, reducing hallucination risk common to warehouse-native NL-to-SQL approaches by grounding responses in pre-verified metric definitions.
- Looker Explore: Looker’s Explore interface enables self-service data exploration for business users who are not LookML developers, applying governed dimensions and measures through a point-and-click interface that prevents users from computing metrics inconsistently or querying the warehouse incorrectly.
Best For
Looker is best for enterprise data engineering teams, analytics engineers, and large organizations (typically 500-plus employees) with mature cloud data warehouse infrastructure who need to enforce a single source of truth for all business metrics across multiple departments, particularly in financial services, e-commerce, and media where metric consistency across finance, product, and marketing is a compliance or operational requirement.
Pricing
Looker pricing as of May 2026, all enterprise tiers require sales engagement; no self-serve pricing is available. Verified via Google Cloud Looker pricing and community-confirmed data points:
- Looker Studio Pro ($9/user/month): A distinct, lower-complexity visualization product, not enterprise Looker: that shares the brand name but serves a fundamentally different use case and audience
- Looker Standard (approximately $60,000–$240,000/year): Mid-market enterprise deployments
- Looker Enterprise (approximately $240,000–$1,200,000-plus/year): Large-scale with advanced governance
- Looker Embed (OEM/embedded analytics, approximately $120,000–$600,000/year)
A practitioner-confirmed mid-market deployment cited $8,000/month ($96,000/year) (u/kjeft, r/BusinessIntelligence, 2024). Google Cloud does not publish official Looker pricing tiers publicly, all ranges in this section are practitioner-estimated from community disclosures, with the sales-engagement-only structure confirmed on Google Cloud’s pricing page as of May 2026.
Strengths
- Only Governed Semantic Layer in Production at Scale: Looker’s LookML semantic layer is the only major BI platform technology enforcing a single, Git-versioned definition of every business metric organization-wide, validated by enterprise practitioners managing 500-plus user deployments as the only structural (rather than cultural) solution to the metric inconsistency problem, as confirmed across r/BusinessIntelligence and r/dataanalysis practitioner threads (2024).
- Most Database-Agnostic Major BI Platform: Looker supports over 50 SQL dialects including BigQuery, Snowflake, Redshift, Databricks, PostgreSQL, and MySQL, making it the most data-warehouse-agnostic major BI platform in production use, with real-time queries that eliminate extract refresh scheduling and provide live warehouse data on every dashboard view [Improvado BI tool comparison, 2026].
- Category-Leading Permissioning Controls: Looker’s row-level, column-level, and field-level user permissioning is independently cited as “EXTREMELY flexible” and “head and shoulders above the alternatives” (u/CheeseDog_, r/dataanalysis, 2024), directly relevant for regulated industries handling sensitive financial or healthcare data.
- Google Acquisition and Gemini Integration: Looker’s Google acquisition ($2.6B, June 2019) and Gemini AI integration provide conversational BI agent capabilities that query the governed LookML semantic layer directly, reducing AI hallucination risk by grounding natural-language responses in pre-verified business metric definitions rather than raw table structures.
Limitations
- Enterprise-Only Pricing Floor: Looker’s most consequential trade-off is cost accessibility, at approximately $60,000 to $240,000 per year minimum for Standard tier, Looker effectively prices out the vast majority of the addressable market, with one practitioner disclosing $8,000/month and stating directly: “We would not go with Looker again considering the cost” (u/kjeft, r/BusinessIntelligence, 2024).
- LookML Staffing Dependency: Looker’s LookML implementation requires dedicated SQL-experienced analysts or analytics engineers, representing a personnel cost of $80,000–$150,000-plus per year on top of licensing, making Looker’s true annual cost of ownership significantly higher than the licensing fee alone reveals.
- Limited Visualization Flexibility: Looker’s dashboard visualization is cited as a limitation relative to Tableau, practitioner consensus is direct: “It doesn’t create the most beautiful dashboards (Tableau is better there)” (u/BigData-dan, r/dataanalysis, 2024), meaning Looker is a governance and exploration tool, not a visual storytelling tool.
- Performance Requires Infrastructure Quality: Perceived slowness is frequently reported by new users, but experienced practitioners consistently attribute it to underlying warehouse infrastructure or LookML model design rather than Looker itself, “Looker itself is incredibly fast… if it’s administered properly” (u/CheeseDog_, r/dataanalysis, 2024), making first-impression evaluations unreliable.
Verdict
Looker is the most architecturally sophisticated governed business intelligence platform in this evaluation, earning the #6 overall ranking because its $60,000-plus annual pricing floor, LookML implementation complexity, and enterprise-only audience scope limit its relevance to the smallest subset of buyers, while its governance capabilities within that subset are genuinely unmatched. Looker is the correct choice for large enterprises (500-plus employees) with mature cloud data warehouse infrastructure where the “different teams, different numbers” metric consistency problem is a documented operational or compliance priority and dedicated analytics engineering resources can implement and maintain LookML models. Organizations outside this profile should evaluate Power BI Premium’s governance features, Mixpanel’s transparent pricing, or open-source alternatives like Metabase or Lightdash before engaging Looker’s sales process.
7. Adobe Analytics: Best Enterprise Web Analytics Suite
Category: Enterprise Web Analytics Suite, collects and analyzes multi-channel digital behavioral data (web, mobile, offline) at Fortune 500 scale without data sampling, with native integration across Adobe’s Experience Cloud for omnichannel attribution and campaign measurement.
At a Glance
- Category: Enterprise Web Analytics Suite
- Best For: Fortune 500 organizations already running Adobe Experience Cloud (Experience Manager, Target, Campaign) who need 100% unsampled multi-channel web analytics, advanced custom segmentation, and cross-channel customer journey analysis across online and offline behavioral data
- Price Range: No self-serve pricing; entry approximately $10,000–$50,000/year; standard enterprise approximately $100,000–$500,000/year; full Adobe Experience Cloud approximately $500,000–$1,000,000-plus/year
- Primary Strength: Adobe Analytics processes 100% of raw behavioral data at any traffic volume without statistical sampling, the only platform in this evaluation that guarantees complete data for every query, including high-traffic deployments where GA4 Standard applies sampling to exploratory analysis
- Biggest Limitation: Adobe Analytics requires dedicated full-time administrator staffing (approximately $80,000–$150,000/year in personnel cost), specialist implementation contractors ($50,000–$200,000 for initial setup), and contracts starting at approximately $10,000/year, creating a five-year total cost of ownership that can exceed $1,000,000 before ROI measurement begins
- One-Line Summary: Adobe Analytics is the enterprise web analytics platform for Fortune 500 organizations requiring 100% unsampled multi-channel data, Analysis Workspace’s freeform ad-hoc analysis depth, and Customer Journey Analytics’ ability to unify online and offline behavioral data, at an enterprise-only price floor that positions it for large organizations already embedded in the Adobe Experience Cloud
- Last Verified: May 2026
Overview
Adobe Analytics is an enterprise-grade multi-channel web and digital analytics platform from Adobe Systems, tracing its lineage to the 2009 acquisition of Omniture SiteCatalyst for $1.8 billion [Source: TechCrunch, September 2009], that enables Fortune 500 marketing analysts, enterprise analytics teams, and digital experience strategists to collect, analyze, and attribute behavioral data from web, mobile, product interactions, and offline touchpoints at any traffic volume without data sampling.
Adobe Analytics holds a 4.3/5.0 G2 rating (the lowest average rating among the seven platforms in this evaluation) as of May 2026. The review volume should be confirmed at g2.com/products/adobe-analytics/reviews as of the time of reading, as G2 counts update continuously.
Adobe Analytics is among the most operationally demanding and cost-intensive platforms in this evaluation, with applicability concentrated among large enterprises already operating in the Adobe Experience Cloud ecosystem.
Key Features
- 100% Unsampled Data Processing: Adobe Analytics processes 100% of raw behavioral data at any traffic volume for any query without statistical sampling, providing more complete data for financial reporting, compliance audits, and precision attribution scenarios where sampling introduces unacceptable measurement error, unlike GA4 Standard which applies statistical sampling to high-traffic Exploration reports.
- Analysis Workspace: Adobe Analytics’ Analysis Workspace provides a drag-and-drop freeform table environment where any metric can be sliced by any dimension in real time, enabling multi-dimensional breakdowns, cohort analysis, fallout funnels, flow visualization, and custom attribution modeling that practitioners cite as the most powerful web analytics ad-hoc analysis interface available.
- Customer Journey Analytics (CJA): Adobe Analytics Customer Journey Analytics unifies online behavioral data, call center records, in-store point-of-sale transactions, and loyalty program interactions into a single cross-channel behavioral profile through Adobe Experience Platform, enabling cross-channel journey analysis that requires significant custom data engineering to approximate in any competing platform.
- Extensive Custom Variable Architecture: Adobe Analytics supports up to 250 eVars, 75 props, and 1,000 events per report suite, the most extensive custom variable architecture in the analytics market, enabling precise multi-channel tracking for enterprises with complex product taxonomies and multi-touchpoint customer journeys.
- Adobe Experience Cloud Integration: Adobe Analytics integrates natively across Adobe Experience Cloud (including Target for personalization, Campaign for email automation, Audience Manager for DMP functions, and Experience Manager for content governance) enabling closed-loop measurement between content delivery, audience targeting, and conversion analytics within a single vendor ecosystem.
Best For
Adobe Analytics is best for Fortune 500 organizations and large enterprises already operating within the Adobe Experience Cloud stack (particularly those in retail, financial services, media, and travel) where the platform’s 100% unsampled data guarantee, Analysis Workspace’s ad-hoc analysis depth, and Customer Journey Analytics’ cross-channel behavioral unification justify the $100,000–$500,000-plus annual license cost, dedicated administrator staffing, and specialist implementation overhead the platform requires.
Pricing
Adobe Analytics pricing is available only through custom enterprise contracts, no self-serve pricing exists at any tier, and no trial is available without sales engagement. Practitioner-confirmed ranges as of May 2026:
- Entry-level (approximately $10,000–$50,000/year): Small enterprise, basic report suites
- Standard enterprise (approximately $100,000–$500,000/year): Large traffic volume, multiple report suites
- Full Adobe Experience Cloud (approximately $500,000–$1,000,000-plus/year): AEM + Target + Analytics + Campaign combined
One r/webdev practitioner confirmed: “My client, I think, pays about 500k a year for a license of AEM, Target and Analytics” (u/mytmouse13, r/webdev, 2023). Total cost of ownership adds implementation services ($50,000–$200,000) and ongoing dedicated administrator staffing ($80,000–$150,000/year). Organizations should request a fully itemized TCO estimate before any contract engagement. All pricing is based on practitioner-confirmed community data and vendor category positioning, May 2026.
Strengths
- Only Unsampled Data Guarantee at Any Traffic Volume: Adobe Analytics processes 100% of raw behavioral data for every query regardless of traffic volume, a technically differentiated guarantee specifically required for financial reporting and compliance audits in regulated industries including financial services and healthcare, where GA4 Standard’s sampling on high-traffic Exploration reports introduces unacceptable measurement uncertainty.
- Analysis Workspace Depth Acknowledged Even by Departing Users: Adobe Analytics’ Analysis Workspace is independently cited as the most powerful ad-hoc web analytics environment available, with practitioners who have migrated away to GA4 consistently acknowledging feature regression: “I think when it comes to customization and debugging Adobe is far more superior” (u/darknightaml, r/businessanalysis, 2025).
- 15-Plus Years of Fortune 500 Institutional Relationships: Adobe Analytics’ enterprise relationships through the Omniture SiteCatalyst lineage create the deepest institutional knowledge and highest switching costs in web analytics, enterprise implementations at major retailers, financial institutions, and media companies require 12–18 months of re-instrumentation work to migrate, providing genuine platform durability for committed deployments.
- Unique Cross-Channel Journey Analysis: Adobe Analytics’ Customer Journey Analytics module unifies online behavioral data, call center records, in-store POS data, and loyalty program data into a single person-level behavioral profile, enabling cross-channel journey analysis at a scope that requires significant custom data engineering to approximate in any competing platform, including GA4 360 or Mixpanel.
Limitations
- Prohibitive Total Cost of Ownership: Adobe Analytics’ most consequential trade-off is its TCO structure, at $100,000–$500,000-plus per year in licensing, plus $50,000–$200,000 in implementation services, plus $80,000–$150,000 per year in dedicated administrator staffing, Adobe Analytics’ five-year TCO can exceed $1,000,000 before any business ROI is measured.
- C-Suite Sales Model Acknowledged by Practitioners: One practitioner observed that “Adobe is great at marketing. Their pre-sales teams absolutely can sell the product to the C suite of enterprise firms” (u/mytmouse13, r/webdev, 2023), a candid acknowledgment that some of Adobe Analytics’ enterprise adoption reflects sales capability rather than purely product merit, particularly for organizations not running the full Adobe Experience Cloud stack.
- Steepest Learning Curve in the Category: Adobe Analytics’ eVar and prop configuration, segment building, data layer architecture, and SAINT classifications represent the steepest analyst learning curve of any platform in this evaluation, analysts without Adobe-specific training produce lower-quality analysis even after implementation is complete, creating a persistent training dependency.
- No Self-Serve Evaluation Path: Adobe Analytics has no free tier, no self-serve trial without sales engagement, and no intermediate pricing between zero and a $10,000-plus annual contract minimum, creating evaluation friction that pushes organizations toward GA4 or other transparent-entry alternatives unless the need for Adobe’s specific capabilities is already established before procurement begins.
Verdict
Adobe Analytics is the most technically capable enterprise web analytics platform in this evaluation for Fortune 500 omnichannel use cases, earning the #7 overall ranking because its 100% unsampled data processing and Analysis Workspace depth are accessible only to organizations sustaining a five-year total cost of ownership that can exceed $1,000,000, capabilities relevant to a narrow fraction of the total evaluation population at a price the majority of organizations cannot justify. Adobe Analytics is the correct choice exclusively for large enterprises already embedded in the Adobe Experience Cloud stack where omnichannel depth justifies its operational and financial demands. All other organizations should evaluate GA4, Power BI, or Mixpanel before considering Adobe Analytics.
What Red Flags Should I Watch For When Evaluating Analytics Platforms?
The most consequential red flags when evaluating analytics platforms are pricing opacity requiring sales engagement before any number is disclosed, absence of self-serve trial paths, AI features that are NL-to-SQL wrappers rather than proactive intelligence, dedicated administrator staffing requirements that inflate true costs, EU data transfer risks, and brand name confusion that masks enterprise price floors.
Red Flag #1: Pricing Requires a Sales Call Before Any Number Is Disclosed
Three platforms in this evaluation require sales engagement before any pricing information is available:
- Amplitude: Growth and Enterprise tier pricing requires a sales call before any dollar figure is disclosed, no self-serve pricing exists above the free Starter tier, in direct contrast to Mixpanel’s publicly calculable Growth pricing
- Looker: Standard and Enterprise tier pricing is entirely sales-negotiated with no published tier prices at any level, all figures in this article are practitioner-estimated from community disclosures
- Adobe Analytics: All tiers require sales engagement: there is no free tier, no self-serve trial, and no published starting price at any level
This forces budget-constrained organizations to invest significant procurement time before discovering an economic mismatch. Additionally, Google Analytics 4 contains an under-disclosed pricing cliff: the free Standard tier covers up to 10 million events per month, but the next tier (Google Analytics 360) starts at $50,000 per year with no intermediate option and no self-serve upgrade path.
Red Flag #2: No Free Trial or Self-Serve Evaluation Path
Adobe Analytics provides no free tier and no trial without sales engagement, meaning organizations cannot validate the platform against their own real data before committing to a minimum $10,000-plus per year contract. Any platform that cannot be tested with real organizational data before contract signature creates adoption and ROI risk. Platforms that allow genuine self-serve evaluation include GA4 (free forever), Power BI (60-day trial), Mixpanel (free tier plus 14-day trial), Amplitude (Starter tier), and Tableau (14-day trial).
Red Flag #3: Platform Requires a Dedicated Full-Time Administrator to Operate
Adobe Analytics typically requires one or more full-time Analytics administrators ($80,000–$150,000/year in personnel cost) and specialist implementation contractors ($50,000–$200,000 for initial setup). Self-hosted Tableau Server also requires dedicated server administration. These staffing dependencies are rarely disclosed in initial sales conversations and can double or triple the effective annual cost of ownership. Request an explicit staffing requirements disclosure before any procurement decision.
Red Flag #4: AI Features Marketed Without Distinguishing Proactive Insight From NL-to-SQL Wrappers
Every platform in this evaluation now markets AI features, Power BI Copilot, GA4 anomaly detection, Amplitude AI Copilot, Tableau Pulse, Looker Gemini agents. Practitioner communities have documented a widespread concern: “Most of what’s being sold as AI analytics is really just chat with your data, natural language queries that write SQL and return charts. They’re selling you a faster horse” (u/middlerange, r/SaaS, 2025). Ask vendors to demonstrate AI features that surface insights you did not know to ask for, not just features that answer questions you already formulated.
Red Flag #5: EU/GDPR Regulatory Exposure Without Data Residency Option
Google Analytics 4 standard implementations have faced regulatory findings in Austria (DSB, 2022), France (CNIL, 2022), and Italy (Garante, 2022) confirmed by the EDPB, questioning GDPR Chapter V compliance for cross-border data transfers. Organizations serving EU-based users should confirm:
- Whether EU data residency options are available on the platform
- Whether a GDPR-compliant Data Processing Agreement is offered
- Whether the platform’s default data transfer model has faced regulatory findings in EU jurisdictions
Matomo and PostHog offer self-hosted deployment on EU-based server infrastructure, eliminating cross-border data transfer to U.S. servers entirely, the root cause of the GDPR Chapter V challenges that standard GA4 implementations face. Self-hosted deployment means no data leaves the jurisdiction in which it is collected, removing the legal basis for the DPA findings in Austria, France, and Italy.
Red Flag #6: Confusing Looker Studio (Free / $9/month) With Enterprise Looker ($60,000-plus/year)
Looker Studio and enterprise Looker are different products sharing a brand name, the first is a free visualization tool built for marketing dashboards, the second is a governed semantic BI platform requiring dedicated analytics engineering staff. If your evaluation begins with the assumption that Looker is the $9/user/month product, the first sales conversation will be financially disorienting. Confirm explicitly which product is under discussion, and at which price level, before any further evaluation conversation proceeds.
What Questions Should I Ask Before Choosing an Analytics Platform?
The most decisive evaluation questions address data completeness at your traffic volume, total cost of ownership including implementation and staffing, infrastructure compatibility with your cloud provider, self-serve evaluation availability, and EU data-residency compliance, these questions surface the constraints most vendor sales conversations are designed to defer.
Question #1: Does this platform process 100% of my data at my traffic volume, or does it apply sampling?
GA4 Standard applies statistical sampling to high-traffic Exploration reports. Adobe Analytics processes 100% of data at any volume. Power BI, Tableau, and Looker performance depends on the underlying data source and query method. For financial reporting, compliance audits, or precision attribution, ask vendors to specify exactly when and how sampling is applied, and get the answer in writing before contract signature.
Question #2: What is the total cost of ownership over three years, including implementation, staffing, and contract escalation?
License cost is only one component of TCO. Adobe Analytics adds $50,000–$200,000 for implementation services and $80,000–$150,000/year for dedicated administrator staffing. Looker adds $80,000–$150,000/year for analytics engineering. Request an itemized three-year TCO estimate (including professional services, training, and anticipated contract escalation) before signing any annual agreement.
Question #3: Does my primary data infrastructure have native integration with this platform?
Infrastructure compatibility directly affects integration overhead and total cost of ownership:
- Microsoft Power BI: deepest native integration with Azure, Microsoft 365 Teams, Excel, and Dynamics 365, maximum ecosystem synergy for Microsoft-stack organizations
- Looker: strongest query performance with BigQuery, Snowflake, and Redshift on properly optimized warehouse infrastructure, performance is warehouse-dependent, not Looker-inherent
- Adobe Analytics: most efficient integration with the full Adobe Experience Cloud suite, organizations not running the full suite gain less value per licensing dollar
Choosing a platform whose architecture conflicts with your existing data infrastructure creates hidden integration overhead and eliminates the ecosystem efficiency that justifies premium pricing.
Question #4: Can I self-serve evaluate this platform with real organizational data before engaging a sales team?
GA4 (free forever), Power BI (60-day trial), Mixpanel (free tier plus 14-day trial), Amplitude (Starter tier), and Tableau (14-day trial) all allow meaningful evaluation without a sales call. Adobe Analytics and Looker Standard do not. A platform that cannot be evaluated with real organizational data before financial commitment cannot have its fit properly validated before the contract is signed.
Question #5: Does my EU data-residency or GDPR compliance requirement restrict which platforms I can legally deploy?
Organizations serving EU-based users should confirm three things before selecting a platform:
- Whether EU data residency options are available on the platform
- Whether a GDPR-compliant Data Processing Agreement is offered
- Whether the platform’s default data transfer model has faced regulatory findings in EU jurisdictions (as GA4 has in Austria, France, and Italy)
Privacy-first self-hosted alternatives like Matomo and PostHog may be legally required for some EU deployments.
Question #6: Can this platform serve my marketing, product, and data engineering teams simultaneously, or will I need supplementary tools?
No single platform in this evaluation serves web marketing analytics, product behavioral analytics, and enterprise BI dashboarding simultaneously. Most organizations run two to three complementary platforms. Knowing the supplementary tools required (and their combined cost) before committing to a primary platform prevents unexpected stack expansion costs after contracts are signed.
Question #7: What is the vendor’s product stability and update cadence following any recent acquisition?
Tableau was acquired by Salesforce in 2019 for $15.7 billion. Looker was acquired by Google in 2019 for approximately $2.6 billion. Adobe Analytics has operated under Adobe ownership since the $1.8 billion Omniture acquisition in 2009. Post-acquisition product direction shifts (including pricing restructures, feature prioritization changes, and support model alterations) are documented risks in practitioner communities. Request a product roadmap and review recent feature release cadence before signing a multi-year contract with any post-acquisition platform.
How Did We Rank These Analytics Platforms?
These seven analytics platforms were ranked by scoring each against six objective criteria (verified review ratings and volume, pricing transparency and value, use-case breadth across buyer archetypes, documented performance evidence, implementation accessibility, and data privacy posture) using publicly verifiable data sources with all scores, weights, and methods disclosed below.
What Data Sources Did We Use?
Every platform was evaluated using identical research protocols across four source categories: G2 verified review databases, official vendor pricing pages, practitioner communities across nine Reddit forums, and independent analyst reports with cross-referenced third-party market analyses. All pricing was verified against official pages or practitioner-confirmed community disclosures where self-serve pricing was unavailable.
The specific sources used for every platform include:
- G2 verified review counts and star ratings (May 2026)
- Official vendor pricing pages for all publicly available tiers (May 2026)
- Practitioner sentiment across nine Reddit communities: r/BusinessIntelligence, r/dataanalysis, r/ProductManagement, r/SaaS, r/datascience, r/businessanalysis, r/webdev, r/lovable, r/tableau
- Independent analyst reports including Gartner Magic Quadrant for Analytics and Business Intelligence Platforms (2013–2025)
- Third-party market analyses including SRAnalytics BI market analysis (2026), Crozdesk product comparison directory (2026), and Improvado BI tool comparison (2026)
- Practitioner-confirmed community pricing disclosures where official pricing was unavailable, with source links and community usernames documented
What Six Criteria Did We Score Each Platform Against?
Each platform received a score on six objective criteria applied consistently across all seven entries:
C1, Verified Review Ratings and Volume: G2 star ratings multiplied by a volume-tier weight, Tier 1 (5,000-plus reviews) carries full weight; Tier 2 (1,000–4,999 reviews) carries 0.85 weight; Tier 3 (500–999 reviews) carries 0.70 weight; Tier 4 (under 500 reviews) carries 0.55 weight. A 4.5/5.0 rating across 289 reviews is materially less reliable than the same rating across 12,847 reviews, and this evaluation makes that difference explicit. Weight: primary.
C2: Pricing Transparency and Value Accessibility: Assesses whether pricing is publicly available without a sales call, free tier generosity at realistic organizational volumes, price per seat or per event benchmarked against the category median, and TCO transparency including implementation and staffing. Weight: primary.
C3: Breadth of Use-Case Coverage Across Buyer Archetypes: Scores one point per archetype the platform substantively serves across five buyer types:
- Web/marketing analytics: needs traffic measurement, campaign attribution, and advertising integration
- Product analytics: needs behavioral event tracking, funnel analysis, and user journey mapping
- BI/dashboarding: needs cross-data-source governance, scheduled reporting, and executive visualization
- Enterprise governance: needs semantic metric consistency, access controls, and data lineage
- Privacy compliance: needs EU data residency, consent-first collection, and GDPR-compliant architecture Weight: secondary.
C4: Documented Performance Evidence and Market Validation: Assesses quantified customer outcome statistics with named sources, independent analyst recognition, verified market share data, and notable named customer deployments. Weight: primary.
C5: Implementation Accessibility and Time-to-Value: Assesses median time to first meaningful dashboard or insight without professional services, whether dedicated full-time admin staffing is required, and engineering dependency level for initial data collection. Weight: secondary.
C6: Data Privacy and Regulatory Compliance Posture: Assesses documented regulatory findings against the platform in EU/GDPR jurisdictions, availability of data-residency or self-hosted deployment options, and whether the consent architecture enables compliant measurement from non-consenting users. Weight: secondary.
How Did We Weigh Conflicting Evidence Sources?
When review platform ratings conflict with Reddit practitioner sentiment, specificity and recency are weighted over generic praise or criticism.
A detailed 2025 Reddit thread with 39-plus upvotes from a named practitioner describing a specific performance limitation outweighs a generic 2023 G2 review. As one practitioner disclosed when reviewing Looker costs: “We spend 8k USD/mo just in licensing… We would not go with looker again considering the cost” (u/kjeft, r/BusinessIntelligence, 2024), this specific, dated account of a production deployment carries more decisional weight for any buyer evaluating Looker than ten generic five-star reviews from unspecified enterprise users.
Vendor-reported statistics are labeled throughout this article. Performance statistics cited via secondary aggregation sources (amraandelma.com) are disclosed as such, with the secondary-source chain made explicit.
How Did We Verify Platform Claims?
Only claims corroborated by at least one independent source are stated as verified facts.
Performance statistics are cited with original research sources and years. Pricing data is verified against official pages or practitioner-confirmed community disclosures with source links. No statistic in this article is presented as fact without a traceable source.
The Power BI Gartner streak (18 consecutive years through the 2025 report) was verified against Microsoft’s official Power BI blog announcement. Amplitude’s named enterprise customers were verified against the company’s 2021 Nasdaq S-1 filing. The Adobe Analytics Omniture acquisition price ($1.8 billion) was verified against the original TechCrunch announcement from September 2009.
When Is This Ranking Data Refreshed?
This article was last verified in May 2026. Pricing, features, and G2 review counts are refreshed quarterly. Significant platform changes (acquisitions, pricing restructures, regulatory findings) trigger immediate updates.
We update this guide quarterly. Last updated: May 2026.
Independence Disclosure
PlugRoute has no affiliate relationships with any company listed. Rankings are determined entirely by research data and objective evaluation criteria.
What Are the Most Common Analytics Platform Questions in 2026?
The following questions address the most common evaluation uncertainties from organizations actively comparing analytics platforms in 2026, each answer is designed to be actionable without requiring context from the rest of this article.
What is the best free analytics platform in 2026?
Google Analytics 4 is the best free analytics platform in 2026, covering up to 10 million events per month across unlimited websites with AI-powered predictive audiences and native Google Ads integration at no cost, confirmed by 12,847 G2 reviews at 4.5 stars and 29 million-plus active deployments globally as of May 2026. Organizations in EU jurisdictions with active GDPR enforcement findings should evaluate self-hosted alternatives like Matomo or Plausible as compliant options.
What is the difference between Google Analytics 4 and Mixpanel?
Google Analytics 4 is a web and marketing analytics platform optimized for traffic measurement, campaign attribution, and Google Ads optimization, it tells you how visitors arrived and what they did on your site. Mixpanel is a product analytics platform optimized for tracking user behavior inside digital products, feature adoption, funnel completion, and churn analysis. Most SaaS and mobile app teams run both: GA4 for marketing attribution and Mixpanel for product behavioral insights, as neither platform replaces the other.
How does PlugRoute determine analytics platform rankings?
PlugRoute ranks analytics platforms by scoring each against six objective criteria (G2 review volume-weighted ratings, pricing transparency, use-case breadth, documented performance evidence, implementation accessibility, and data privacy posture) using publicly verifiable sources including G2 reviews, official pricing pages, Gartner reports, and practitioner Reddit communities. No affiliate relationships influence any ranking or positioning in this evaluation. The full methodology appears in the section above.
What Do These Analytics Platform Terms Actually Mean?
Five technical terms appear repeatedly across analytics platform comparisons and carry materially different implementations across vendors, understanding their precise meaning prevents costly evaluation assumptions before a platform is selected.
Event-Based Data Model: An analytics architecture in which every user interaction (page view, click, form submission, purchase) is recorded as a discrete “event” with customizable properties, replacing the session-based model that counted visits and page views. Google Analytics 4 and Mixpanel use event-based models, enabling cross-platform tracking and retroactive analysis that session-based systems cannot support.
Semantic Layer: A governed data modeling layer (as implemented in Looker’s LookML) that defines business metrics (revenue, active users, conversion rate) in a single SQL-based, Git-versioned model shared across all dashboards and all teams. Looker’s semantic layer ensures every department queries the same definition of every metric, solving the “different teams, different numbers” data governance problem at the organizational level rather than through cultural convention.
Behavioral Graph: Amplitude’s proprietary architecture that models not just individual user events but the relationships between actions, cohorts, sequences, and outcomes over time across one or more products. Amplitude’s behavioral graph enables multi-product user journey analysis at enterprise scale (understanding how a user’s actions across multiple sessions and products relate to long-term retention and conversion) at a depth event-log platforms cannot sustain.
Consent Mode v2: Google’s privacy architecture for GA4 that sends anonymized “cookieless pings” from users who decline cookie consent, feeding machine learning models that reconstruct aggregate behavioral patterns without collecting personal data. Consent Mode v2 preserves directional conversion measurement under GDPR, though its legal status as a fully compliant measurement method varies by EU jurisdiction and has not been definitively affirmed by all data protection authorities as a complete substitute for consented data collection.
Monthly Tracked Users (MTU): The pricing metric used by Amplitude to measure platform consumption, counting unique users who triggered at least one event in a given calendar month, regardless of total event volume. MTU-based pricing favors high-event-volume, low-user-count products; event-volume pricing favors low-frequency, high-user-count scenarios. Verify the specific pricing metric used by each platform at the time of evaluation, as vendors adjust pricing models periodically, confirm current terms at each vendor’s official pricing page before projecting costs.
Glossary: Key Terms Used in This Comparison
Event-Based Data Model: An analytics architecture in which every user interaction (page view, click, purchase, or form submission) is recorded as a discrete “event” with customizable properties, replacing session-based models that counted visits and page views. Google Analytics 4 and Mixpanel use event-based models, enabling cross-platform tracking and retroactive analysis that session-based systems cannot support.
Semantic Layer: A governed data modeling layer (as implemented in Looker’s LookML) that defines business metrics such as revenue, active users, and conversion rate in a single SQL-based, Git-versioned model shared across all dashboards and all teams. It ensures every department queries the same definition of every metric, solving the “different teams, different numbers” data governance problem at the organizational level rather than through cultural convention.
Behavioral Graph: Amplitude’s proprietary architecture that models not just individual user events but the relationships between actions, cohorts, sequences, and outcomes over time across one or more products. It enables multi-product user journey analysis at enterprise scale (understanding how a user’s actions across multiple sessions and products relate to long-term retention and conversion) at a depth event-log platforms cannot sustain.
Consent Mode v2: Google’s privacy architecture for GA4 that sends anonymized cookieless signals from users who decline cookie consent, feeding machine learning models that reconstruct aggregate behavioral patterns without collecting personal data. Its legal status as a fully compliant measurement method varies by EU jurisdiction and has not been definitively affirmed by all data protection authorities as a complete substitute for consented data collection.
Monthly Tracked Users (MTU): The pricing metric used by Amplitude to measure platform consumption, counting unique users who triggered at least one event in a given calendar month regardless of total event volume. MTU-based pricing favors high-event-volume, low-user-count products, while event-volume pricing favors low-frequency, high-user-count scenarios, making the distinction material when projecting costs across platforms with different pricing structures.
Which Analytics Platform Is Right for You?
The right analytics platform in 2026 depends on your primary use case: Google Analytics 4 for free web and marketing measurement, Microsoft Power BI for enterprise BI at the lowest per-user cost, and Mixpanel for product behavioral analytics with transparent pricing. No single platform serves all use cases simultaneously, most mature organizations run two to three complementary platforms.
Key Insights
- Google Analytics 4 is the correct default for any organization running Google Ads campaigns, with 29 million-plus deployments and 12,847 G2 reviews at 4.5 stars confirming broad reliability, and is irreplaceable for Google Ads-centric marketing measurement regardless of what other platforms are deployed alongside it.
- Microsoft Power BI is the most cost-efficient enterprise BI platform at $14/user/month (5× less expensive than Tableau Standard Creator ($75/user/month)) and is often $0 for organizations with Microsoft 365 E5 licenses, making it the default BI choice before any formal evaluation begins for Microsoft-ecosystem organizations.
- For a 100-person analytics team, choosing Power BI Pro over Tableau Standard Creator saves approximately $734,400 per year, equivalent to hiring five to six additional data analysts at US median salary, or funding 30 years of Mixpanel Growth plan for the same team. This cost difference should be explicitly documented before any Tableau evaluation begins.
- Mixpanel is the correct starting point for product analytics evaluation: the most transparent pricing in its category, a 1 million events per month free tier, and a retroactive analysis capability unavailable in directly comparable commercial platforms make it the default entry point for SaaS and mobile teams.
- Tableau remains the visualization gold standard for data professionals when advanced chart types and executive visual storytelling are non-negotiable requirements, but its 5× pricing premium over Power BI requires explicit documentation of that need before commitment.
- Amplitude is the enterprise graduation platform for product analytics teams at scale (its behavioral graph and built-in experimentation are best suited for large B2C organizations managing multi-product platforms) but its Growth and Enterprise pricing opacity is a genuine barrier compared to Mixpanel’s publicly calculable tiers.
- Looker solves the metric governance problem structurally at the organizational level (its LookML semantic layer is architecturally unique) but its $60,000-plus per year minimum and LookML staffing dependency make it appropriate only for enterprises with 500-plus employees, mature data warehouse infrastructure, and dedicated analytics engineering resources.
- Adobe Analytics earns the #7 ranking because its genuine differentiators: 100% unsampled data, Analysis Workspace depth, Customer Journey Analytics, are available only to organizations that can sustain a five-year TCO potentially exceeding $1,000,000, correctly positioning it as a Fortune 500 platform rather than a general evaluation option.
For teams with limited budgets, the combination of GA4 (free, for marketing attribution) plus Mixpanel Growth (from $25/month, for product analytics) covers 90% of analytics needs for pre-Series B companies at near-zero cost. No enterprise contract is required, and both platforms provide self-serve evaluation before any dollar is committed.
Users on r/SaaS shared a first-hand account of this transition delivering measurable results:
“We made the switch from spreadsheets (ikr) and GA to a more unified setup when we were around 12 people and it actually made a pretty big difference. Before that we were constantly asking each other for data or rebuilding the same reports in different ways, took forever to answer basic questions about user behavior. We ended up going with Mixpanel for product stuff and used Embeddable to build custom dashboards that our PM could actually update without bugging engineering every time. The big change was that our team could finally see patterns in real time instead of waiting days for someone to pull numbers together. Revenue tracking got way clearer too because we could see which campaigns actually converted instead of just guessing. Setup took maybe 2 weeks to get the basics working.” Posted by u/elliezena
Takeaway: Small teams that pair GA for traffic attribution with Mixpanel for product behavioral analytics consistently report faster time-to-insight and reduced dependency on manual reporting, validating the GA4 plus Mixpanel stack as the evidence-based default for pre-Series B organizations.
For enterprise BI and data teams, the most evidence-backed combination is Microsoft Power BI for governed dashboarding (at $14/user/month or $0 via E5 bundling) plus Amplitude for product analytics where experimentation depth justifies the additional cost. Organizations with mature data engineering capacity and metric governance as a documented operational priority should evaluate Looker’s semantic layer before committing to the full complexity of Adobe Experience Cloud.
For EU-based organizations, GDPR compliance must be a first-order evaluation criterion before any platform is selected. GA4’s standard implementation has faced regulatory findings in Austria, France, and Italy, and privacy-first alternatives, Matomo, Plausible, PostHog, may be legally required for some deployments. The most common mistake in analytics platform selection is committing to an annual contract before validating the platform against real organizational data. GA4, Mixpanel, Power BI, Amplitude, and Tableau all offer meaningful free tiers or trials, evaluate with real production data before engaging any enterprise pricing discussion.
Running two to three analytics platforms simultaneously is not a failure of consolidation, it is the correct architecture for most mature organizations. GA4 (free) plus Mixpanel Growth (from $25/month) plus Power BI Pro ($14/user/month) delivers a complete marketing, product, and BI analytics stack at a combined cost that is approximately 95% less than a single Adobe Analytics enterprise contract. Browse PlugRoute’s analytics category for additional independent platform comparisons, all rankings are determined by research data with no affiliate relationships.