Esri ArcGIS leads for enterprise GIS professionals and government agencies; Mapbox is the top choice for developers building location features into applications and connected vehicles; CARTO is best for data teams running spatial analytics inside an existing cloud data warehouse. The right platform depends entirely on which of five distinct buyer contexts you occupy.
Location platform software spans five buyer segments that differ so dramatically in architecture, pricing, and required technical expertise that choosing the wrong category wastes budget before a single query runs. A developer API like Mapbox, an enterprise GIS suite like Esri ArcGIS, and a no-code tool like Mapline serve completely different buyers, evaluating them together without establishing category first guarantees a mismatch that no feature comparison resolves.
PlugRoute has no affiliate relationships with any company listed. Rankings are determined entirely by research data and objective evaluation criteria.
“Modern GIS looks like data science but with a geospatial bent, python libraries, visualisation tools. GIS analysis directly in the database with stuff like Snowflake/Databricks etc etc. Carto is big [in this space].” (u/Gargunok, r/gis, 2025)
Takeaway: Practitioners in the GIS community confirm that warehouse-native spatial analytics (specifically naming CARTO within Snowflake and Databricks environments) represents a recognized, real-world workflow shift, not a vendor marketing construct.
What Are the Top Location Platform Picks for 2026?
- Esri ArcGIS: enterprise GIS standard for government, utilities, and regulated industries
- Mapbox: developer APIs and SDKs for building location-powered apps and automotive navigation
- CARTO: warehouse-native spatial analytics for BigQuery, Snowflake, and Databricks teams
- Mapline: most affordable no-code territory mapping for SMB sales and field teams
What Are the 5 Categories of Location Platform Software in 2026?
Location platform software in 2026 organizes into five distinct buyer categories that differ fundamentally in architecture, required technical expertise, and buyer profile. Matching your organization to the correct category before comparing specific platform features is the single most impactful evaluation decision available, the category determines whether any individual platform is relevant before feature analysis begins.
The five categories are:
- Category 1: Enterprise GIS Suite: Esri ArcGIS: full professional GIS toolchain for dedicated GIS teams, government, and regulated industries
- Category 2: Developer Location Platform (API/SDK): Mapbox: modular APIs and SDKs for engineering teams building location features into products
- Category 3: Warehouse-Native Spatial Analytics: CARTO: spatial queries executed inside BigQuery, Snowflake, Databricks, or Redshift
- Category 4: Specialized Location Intelligence: Foursquare: enterprise POI data licensing and place-aware apps; Precisely: CASS-certified address validation and enterprise geocoding; Placer.ai: U.S. foot traffic analytics for retail and commercial real estate
- Category 5: No-Code Business Mapping: Mapline: Excel-to-territory-map workflow for SMB sales and field operations teams
Evaluating Esri ArcGIS alongside Mapline, or CARTO alongside Placer.ai, compares platforms designed for entirely different buyers. No feature comparison resolves a category mismatch.
How Do the Top 7 Location Platform Software Tools Compare?
The seven best location platform software tools span five deployment categories, from enterprise GIS suites to no-code business mapping platforms. Each tool occupies a distinct specialized niche where no other evaluated platform provides equivalent capability depth for its specific buyer context, spanning professional spatial analysis, developer APIs, warehouse-native analytics, specialized data intelligence, and visual business mapping.
All G2 ratings sourced June 2026. All pricing figures independently verified or disclosed as unavailable. No entry received preferential treatment.
| Rank | Platform | Category | Best For | One-Line Summary | G2 Rating (June 2026) | Price Range | Key Limitation |
|---|---|---|---|---|---|---|---|
| #1 | Esri ArcGIS | Enterprise GIS Suite | GIS professionals, government, utilities, defense | The market-dominant enterprise GIS platform deployed across 350,000+ organizations in 200 countries (per Esri marketing materials, 2026), offering unmatched spatial analytics depth and the only platform with equal capability across desktop, cloud, self-hosted, and developer API tiers | 4.4/5.0 | Pricing on request | Highest TCO; proprietary geodatabase lock-in |
| #2 | Mapbox | Developer Location Platform | Engineering teams building location features into applications | Leading developer location API with MapGPT AI navigation (January 2024) and public free-tier pricing; recognized with the 2024 Autotech Breakthrough Navigation Technology Solution of the Year award | 4.5/5.0 | Free tier + pay-as-you-go | Usage-based bill shock at production API volume; model load before committing |
| #3 | CARTO | Warehouse-Native Analytics | Data teams on BigQuery/Snowflake/Databricks | Only platform running 100+ spatial analytics functions as warehouse stored procedures directly inside customer’s existing data infrastructure | 4.5/5.0 | 14-day trial; PAYG; enterprise on request | Requires existing warehouse infrastructure; not a general-purpose GIS tool |
| #4 | Placer.ai | Foot Traffic Analytics | U.S. retail and CRE foot traffic benchmarking | Leading U.S. foot traffic platform with $100M ARR (February 2024); use for directional trends and competitive benchmarking, not absolute headcounts | 4.6/5.0 | Pricing on request | Statistical estimates only; verified accuracy discrepancies for absolute counts; U.S.-only coverage |
| #5 | Foursquare | POI Intelligence Platform | Enterprise POI licensing and place-aware apps | POI platform with 200M+ places, endorsed by Esri for ArcGIS Places across 170+ countries; December 15, 2024 City Guide shutdown raises data pipeline sustainability questions | 4.3/5.0 | $250/month developer; enterprise on request | Consumer app shutdown raises unresolved human-verified data sustainability questions |
| #6 | Precisely | Address Validation Platform | CASS-certified geocoding and postal compliance | CASS-certified enterprise address validation deployed by 95 of the Fortune 100 (per Precisely April 2026 press release) across 12,000+ customers in 100+ countries | 4.2/5.0 | Pricing on request | Narrowest use case in evaluation; lowest G2 rating (4.2/5.0); legacy implementation complexity |
| #7 | Mapline | No-Code Business Mapping | SMB sales territory and field team mapping | Most pricing-transparent no-code business mapping tool with Excel-native workflow; free version and published annual tiers starting at ~$330/year | 4.5/5.0 | Free; ~$330–$660/yr; ~$99–$349/mo | Limited analytics depth; SMB scalability ceiling |
Which Location Platform Software Should I Choose for My Use Case?
Match your primary deployment need to the correct platform before comparing features, choosing the wrong category is the most common and costly evaluation error in the location platform market. Each row below maps a specific use case trigger to the platform with the strongest verified evidence for that context, including open-source alternatives.
| Your #1 Priority | Recommended Tool | Why | Acceptable Alternative |
|---|---|---|---|
| Enterprise GIS with full analytical toolchain | Esri ArcGIS | Unmatched depth, Living Atlas data, 350,000+ org adoption (per Esri, 2026) | QGIS (free, open-source) |
| Building location features into apps or products | Mapbox | Best developer API/SDK ecosystem; public free tier; MapGPT AI navigation | HERE Platform, Google Maps Platform |
| Spatial analytics inside BigQuery, Snowflake, or Databricks | CARTO | Only warehouse-native spatial platform; 100+ Analytics Toolbox functions | PostGIS (self-hosted, open-source) |
| U.S. retail or CRE foot traffic benchmarking (directional only) | Placer.ai | ~30M device panel; $100M ARR commercial validation (February 2024) | SafeGraph, StreetLight Data |
| Enterprise POI data licensing and place-aware app development | Foursquare | 200M+ places; Esri institutional endorsement for ArcGIS Places | Google Places API, HERE Places |
| CASS-certified address validation for postal compliance | Precisely | Only CASS-certified platform in this evaluation; 95 of Fortune 100 (April 2026) | Melissa Data, SmartyStreets |
| No-code territory mapping for SMB sales teams | Mapline | Most transparent pricing; Excel-native; free version available | Maptive, eSpatial |
| Cost-free GIS analysis alternative | QGIS (open-source, not ranked) | Free, full-featured desktop GIS; recommended before any commercial commitment | PostGIS + OpenStreetMap |
Before committing to a commercial platform: If you have technical staff and a tight budget, evaluate QGIS (free, open-source desktop GIS) and PostGIS (free, open-source spatial database) first. The GIS practitioner community consistently recommends mastering open-source fundamentals before commercial licensing. Commercial platforms are best justified when you need managed data freshness, vendor SLAs, or capabilities that open-source tools do not replicate.
1. Esri ArcGIS: Best Overall for Enterprise GIS & Professional Spatial Analysis

Category: Enterprise GIS Suite, a comprehensive geographic information system platform combining desktop analysis, cloud collaboration, self-hosted deployment, and developer APIs for professional spatial workflows at enterprise scale.
At a Glance
| Field | Detail |
|---|---|
| Category | Enterprise GIS Suite |
| Best For | GIS professionals, government agencies, utilities, defense organizations, and large enterprises requiring advanced spatial analysis, field data collection, 3D modeling, and enterprise-grade data governance |
| Price Range | Pricing on request; annual subscription with role-based licensing tiers (Creator, Editor, Viewer, GIS Professional); additional costs for premium analytics extensions, server components, and Living Atlas premium content; student and educational licenses available at significantly reduced cost |
| Primary Strength | Esri ArcGIS provides the deepest end-to-end GIS toolchain of any commercially available platform, bundling curated global datasets through ArcGIS Living Atlas alongside desktop, cloud, self-hosted, and developer API tiers in a single subscription |
| Biggest Limitation | Esri ArcGIS carries the highest total cost of ownership in this evaluation, with complex role-based licensing, mandatory extension fees, and structural vendor lock-in through proprietary geodatabase formats and certification requirements that make migration costly and time-consuming |
| One-Line Summary | Esri ArcGIS is the market-dominant professional GIS platform across North America, Europe, and large-enterprise global deployments; serving 350,000+ organizations in 200 countries (per Esri marketing materials, 2026); offering unmatched spatial analytics depth, the ArcGIS Living Atlas dataset library, and equal deployment capability across desktop, cloud, self-hosted, and developer API tiers |
| Last Verified | June 2026 |
Overview
Esri ArcGIS is a comprehensive end-to-end GIS platform combining desktop (ArcGIS Pro), cloud (ArcGIS Online), self-hosted (ArcGIS Enterprise), and developer API tiers, built for GIS professionals, government agencies, utilities, defense organizations, and large enterprises that require advanced spatial analysis, data governance, and enterprise-scale field operations.
Esri ArcGIS has been in continuous development since its founding in 1969 under founder-led private ownership in Redlands, California, making Esri ArcGIS the market-dominant professional GIS platform across North America, Europe, and large-enterprise global deployments. The 2025 release of ArcGIS Maps SDK 5.0 added AI and agentic workflow components that extend Esri ArcGIS’s analytical accessibility beyond specialist GIS staff while preserving full geoprocessing depth for professional users.
Key Features
- ArcGIS Living Atlas: Esri ArcGIS bundles the ArcGIS Living Atlas of the World (described by Esri as “the foremost collection of geographic information from around the globe”) providing subscribers with immediate access to authoritative global datasets including census data, satellite imagery, demographic layers, and environmental boundaries without requiring separate data licensing agreements (ArcGIS Living Atlas, 2026).
- Four Synchronized Deployment Tiers: Esri ArcGIS delivers ArcGIS Pro for advanced desktop geoprocessing, ArcGIS Online for cloud-based collaboration and map sharing, ArcGIS Enterprise for self-hosted deployments with full organizational control, and the ArcGIS Maps SDK for JavaScript (v5.0, 2025) for developer integration into web applications, a deployment breadth no competing platform matches at equivalent depth (Esri Product Index, 2026).
- AI and Agentic Mapping (SDK 5.0): Esri ArcGIS Maps SDK for JavaScript version 5.0 (released 2025) introduced AI and agentic workflow components enabling conversational and natural language-driven spatial analysis, reducing the GIS expertise barrier for business users while maintaining full geoprocessing depth for specialist staff (Esri Developer Blog, 2025).
- Certified Partner Network: Esri ArcGIS supports an extensive Partner Network of certified resellers, system integrators, and solution developers extending the core platform into specialized verticals including utility network management, emergency response, field workforce automation, and 3D city modeling (Esri Partner Network, 2026).
- FedRAMP Authorization: Esri ArcGIS Online maintains FedRAMP (Federal Risk and Authorization Management Program) authorization for U.S. government cloud instances, a mandatory federal cloud security certification required by many U.S. civilian and defense agencies that structurally disqualifies most commercial location platforms from public sector bid processes without agency-specific security assessment waivers.
Best For
Esri ArcGIS is best for organizations with dedicated GIS staff, government and regulated-industry buyers operating under procurement mandates or FedRAMP requirements, and enterprises that need the full analytical depth of professional geoprocessing, 3D spatial modeling, field data collection, and Living Atlas data access within a single governed platform.
Pricing
Esri ArcGIS does not publish standard list pricing publicly. Esri ArcGIS pricing is organized by role-based user types (Creator, Editor, Viewer, GIS Professional) under annual subscription licensing for ArcGIS Online and ArcGIS Pro, with separate licensing for ArcGIS Enterprise deployments.
Additional costs apply for premium analytics extensions, Living Atlas premium content layers, and server components. PlugRoute attempted to obtain public pricing through all available channels, none exist; a direct sales engagement is required before any cost figure is provided.
Educational and student licensing is available at significantly reduced cost, with free access programs for qualifying academic institutions. Verify all current pricing directly with Esri before procurement decisions, current as of June 2026 (Esri pricing overview, 2026).
Strengths
- Esri ArcGIS is deployed across 350,000+ organizations in 200 countries as of 2026, the broadest verified organizational reach of any platform in this evaluation, reflecting decades of enterprise contract retention in government, utilities, defense, healthcare, and commercial sectors (per Esri official marketing materials, 2026; independently verifiable deployment scale is not available for a privately held company that does not publish annual reports) (Esri official, 2026).
- Esri ArcGIS bundles the ArcGIS Living Atlas of the World with subscriptions, providing immediate access to authoritative global geographic datasets, eliminating the separate data licensing costs that competing platforms require for equivalent global coverage, a total cost of ownership differentiator not reflected in per-seat pricing comparisons (ArcGIS Living Atlas, 2026).
- Esri ArcGIS Maps SDK 5.0 added AI components for conversational and agentic spatial analysis Esri Developer Blog, 2025, extending Esri ArcGIS’s usability to non-specialist business users and positioning the platform for organizations investing in AI-augmented data workflows.
- Esri ArcGIS’s educational pipeline: the platform taught in more GIS university programs globally than any competitor, creates sustained workforce familiarity that self-reinforces enterprise adoption: “ESRI has done a good job. Like all GIS courses on universities are held in ArcGIS. A student licence is cheap. So everyone leaving the university has ArcGIS knowledge and will stay probably in the ESRI bubble” (u/ecoMAP, r/gis, 2025).
Limitations
- Highest Total Cost of Ownership: Esri ArcGIS carries the highest total cost in this evaluation, its role-based licensing structure, mandatory extension fees for advanced analytics modules, enterprise server licensing, and periodic mandatory compliance updates create annual spend consistently exceeding what smaller organizations or non-GIS-primary teams can justify. One r/gis practitioner states directly: “you are trapped with ESRI to the end of times (and their prices ☠️)” (u/Aaronhpa97, r/gis, 2025).
- Proprietary Vendor Lock-In: Esri ArcGIS enforces proprietary geodatabase formats and certification-dependent administration that create structural switching costs, once an organization has built geoprocessing workflows and trained staff to ArcGIS certification levels, migrating to alternatives requires significant budget and calendar time in retraining investment, data conversion overhead, and workflow redesign.
- No Transparent Pricing: Esri ArcGIS does not publish list pricing, requiring a full sales engagement before costs can be modeled against competing platforms or open-source alternatives, a friction point that disadvantages Esri ArcGIS in self-service evaluation processes where buyers compare platforms independently before engaging vendors.
- Overkill for Non-GIS Teams: Esri ArcGIS’s analytical depth is its strength and its misalignment risk, organizations that need to visualize sales territories, validate mailing addresses, or run spatial queries on a Snowflake dataset should evaluate Mapline, Precisely, or CARTO respectively, as deploying Esri ArcGIS for these use cases adds unnecessary cost and learning curve without proportional benefit.
This reality is particularly acute for government organizations, as one municipal GIS practitioner explained on r/gis:
“I’m the sole GIS person in a municipality. I have a small gov EA with Esri for $27k/year. The big lift isn’t just changing workflows and software, I would need to hire another FTE just to manage the system. This FTE would have to be an IT professional and not a recent college grad with a Geography or GIS degree. I’m not getting a CS major to come do open source GIS for a small gov for less than $75k/year salary that would be around $125k/year total with benefits and overhead. I would also need to put together a training program for all the staff that use Pro to learn QGIS. My planners, engineers, fire fighters, police, and analysts know the Esri ecosystem. They do not have the time to learn something new.” Posted by u/l84tahoe
Takeaway: For municipal and government Esri ArcGIS users, the true migration cost extends far beyond license fees, workforce retraining, IT infrastructure replacement, and staff time make switching economically infeasible even when annual pricing increases are substantial, which is precisely why Esri’s lock-in compounds over time rather than resolving.
Verdict
Esri ArcGIS is the market-standard enterprise GIS platform verified across 350,000+ organizations in 200 countries (per Esri marketing materials, 2026), offering unmatched spatial analytics depth, the ArcGIS Living Atlas bundled dataset library, and the only platform in this evaluation with equal deployment capability across desktop, cloud, self-hosted, and developer API tiers simultaneously.
For organizations with dedicated GIS staff, regulatory compliance requirements, or professional spatial analysis workflows that justify the cost, Esri ArcGIS delivers capabilities that no evaluated platform simultaneously matches across all five assessment criteria.
Buyers should enter procurement with clear budget authority and a documented migration exit strategy, as Esri’s pricing structure and proprietary data formats create multi-year lock-in that is difficult and costly to reverse. The decision to adopt Esri ArcGIS is not a software procurement decision, it is an organizational commitment to a platform ecosystem that will shape GIS staff training, data format choices, and analytical workflow architecture for a decade or more.
2. Mapbox: Best for Developers Building Location Features into Products, Applications & Connected Vehicles

Category: Developer Location Platform (API/SDK), a modular API and SDK platform for building maps, navigation, search, and geospatial data features into applications, enterprise software, and connected vehicle systems.
At a Glance
| Field | Detail |
|---|---|
| Category | Developer Location Platform (API/SDK) |
| Best For | Engineering teams and product developers building location features; maps, routing, geocoding, and navigation; into consumer apps, enterprise software, logistics platforms, fleet management systems, and automotive OEM experiences |
| Price Range | Free tier available + pay-as-you-go usage-based pricing (public pricing page at mapbox.com/pricing); costs escalate with API call volume at production scale; model production load against published tiers before committing |
| Primary Strength | Mapbox provides the most developer-complete location API and SDK ecosystem in this evaluation, combining map rendering, AI navigation (MapGPT), geocoding, and Mapbox Studio map design in a single platform with a publicly priced free tier for prototyping |
| Biggest Limitation | Mapbox’s usage-based pricing model creates bill shock risk at production scale; API costs that are negligible during development escalate sharply when consumer app traffic, fleet management load, or automotive session volume increases unexpectedly, a concern consistently documented by the developer community |
| One-Line Summary | Mapbox is the leading developer location platform for building map, navigation, and search experiences into applications, offering a publicly priced free-to-paid SDK ecosystem, an AI-powered navigation layer with MapGPT (announced January 2024), and the 2024 Autotech Breakthrough Navigation Technology Solution of the Year award confirming its automotive-grade competitive standing |
| Last Verified | June 2026 |
Overview
Mapbox is a developer-first location platform providing modular APIs and SDKs for map rendering, navigation, geocoding, and geospatial data, purpose-built for engineering teams embedding location features into consumer apps, enterprise software, fleet management systems, and connected vehicle experiences.
Mapbox was founded in 2010 in San Francisco and is privately held, positioning Mapbox as infrastructure-level location technology powering experiences across automotive, travel, transportation, logistics, delivery, and ride-sharing verticals. Mapbox is distinctly different from enterprise GIS platforms and no-code business tools: Mapbox is designed for technical teams building location-powered products, not for GIS analysts running spatial queries or business users visualizing sales territories.
Key Features
- Modular API Suite: Mapbox provides Maps API for tile rendering, Navigation SDK for turn-by-turn routing, Search API for geocoding and place discovery, and Datasets API for custom geospatial data management, all accessible via a single Mapbox account with usage-based billing under a publicly documented pricing model, verified at mapbox.com/pricing in June 2026.
- Mapbox Studio: Mapbox Studio enables developers and designers to create fully custom map styles at pixel level (adjusting colors, fonts, data layer visibility, and label placement) through a visual editor that outputs production-ready map styles without requiring CSS authoring or custom rendering code.
- MapGPT AI Navigation SDK: Mapbox Navigation SDK with MapGPT (announced January 2024) introduces an AI-powered natural language voice assistant for in-app and in-vehicle navigation, enabling conversational, voice-activated location interactions as part of a connected car platform alternative to Apple CarPlay and Android Auto for automotive OEM integrations (PR Newswire, January 2024).
- Automotive-Grade 3D Navigation: Mapbox supports 3D live navigation with sensor fusion, ADAS lane-level guidance, and vision AI for road, vehicle, and POI recognition, extending the platform into L2+ advanced driver assistance system integrations documented in Mapbox’s MWC 2025 presentation (Mapbox MWC 2025 Blog).
- Mapbox GL JS Open-Source Library: Mapbox GL JS: the open-source web mapping rendering library underlying Mapbox’s browser-based maps, is one of the most widely forked location rendering libraries in the open-source JavaScript ecosystem, as evidenced by GitHub fork counts and community adoption across major mapping applications, contributing to developer mindshare beyond the paid API customer base (Mapbox GL JS repository, 2026).
Best For
Mapbox is best for engineering teams and product developers building location-powered applications where map appearance customization, navigation accuracy, and API modularity are decision factors, including consumer mobile apps, fleet and logistics platforms, automotive OEM navigation experiences, and enterprise applications requiring embedded location features rather than standalone GIS analysis.
Pricing
Mapbox publishes a public pricing page at mapbox.com/pricing with a free tier enabling prototyping and early development. Mapbox production pricing follows a usage-based, pay-as-you-go model triggered by map loads, API requests, and navigation sessions.
Third-party analysis (Mapular.com, 2026) and developer community commentary confirm that costs escalate sharply at high API volumes. Engineering teams should model expected production traffic against published pricing tiers before committing Mapbox for high-volume consumer applications.
Custom enterprise pricing is available for automotive OEM and large-scale fleet deployments. Verify current free tier limits and per-unit rates directly at mapbox.com/pricing before procurement decisions, current as of June 2026.
Strengths
- Mapbox Boundaries delivered a documented 20% loading time reduction for customer Hyperplan, one of the few publicly cited, quantified performance outcomes in the developer location platform category, providing independently verifiable evidence of production impact (Mapbox Customer Showcase, 2026).
- Mapbox Navigation SDK won Navigation Technology Solution of the Year in the 2024 Autotech Breakthrough Awards, a third-party recognition from an independent automotive technology panel confirming Mapbox’s competitive standing among enterprise-grade navigation solutions for OEM and fleet deployments (Mapbox press releases, 2024).
- Mapbox MapGPT: the AI-powered natural language voice assistant integrated into the Navigation SDK (PR Newswire, January 2024), represents the first production-grade LLM-driven navigation layer documented in this evaluation, extending Mapbox’s addressable market into automotive OEM integrations where traditional navigation SDKs lack conversational interface capability.
- Mapbox GL JS remains one of the most widely forked and adopted location rendering libraries in the open-source JavaScript ecosystem, providing community-contributed ecosystem depth and developer mindshare that extends Mapbox’s market presence well beyond its direct paid API customer base (Mapbox GL JS, 2026).
Limitations
- Usage-Based Bill Shock Risk: Mapbox’s usage-based pricing model is its most consequential operational risk at scale, API costs that are negligible during prototyping escalate sharply when production application traffic increases, documented in third-party technical analysis (Mapular.com, 2026) and consistently raised in developer community discussions; organizations building high-traffic consumer apps should model worst-case API call scenarios against published pricing before architecture decisions lock in Mapbox dependencies.
- Not a GIS Analysis Tool: Mapbox is explicitly not a GIS analysis platform: the r/gis practitioner community categorizes Mapbox as a “building tool” for embedding location features into products, distinctly separate from analytical platforms like ArcGIS or QGIS; teams needing spatial analysis workflows, geoprocessing, or professional GIS output will find Mapbox insufficient as a standalone solution (r/gis, 2025).
- Mapbox GL JS Proprietary Licensing Transition: Mapbox GL JS: the open-source web map rendering library that powers Mapbox’s browser-based maps, transitioned from an open-source to a proprietary license in 2020, resulting in the MapLibre GL open-source fork maintained by the community; organizations building on Mapbox’s rendering layer with open-source dependency strategies should evaluate MapLibre GL as a cost-free, license-clean alternative before committing to Mapbox’s commercial SDK, as the 2020 licensing change cannot be retroactively undone for products already built on the original open-source version.
- No Self-Hosted Deployment Path: Mapbox operates exclusively as a cloud API platform with no supported self-hosted deployment for core tile services, creating a critical dependency on Mapbox’s infrastructure availability, pricing decisions, and business continuity that organizations with data sovereignty requirements, air-gapped government environments, or geographic data residency mandates cannot mitigate; buyers in these contexts should evaluate HERE or Esri Enterprise as self-hostable alternatives before committing to Mapbox’s cloud-only architecture.
The operational reality of Mapbox’s pricing model at scale is well documented in the developer community. A practitioner on r/selfhosted described building an alternative specifically to avoid these costs:
“I’ve been banging my head against the wall lately trying to build a dispatch system for a driver fleet. The main issue was cost, services like Google Maps or Mapbox wanted ridiculous money ($50k+) once we hit a certain volume of matrix calls. I decided to try and roll my own self-hosted microservice using Node and PostGIS, but I kept hitting the ‘Thundering Herd’ problem where too many GPS pings at once would lock up the DB.” Posted by u/Nice-Foundation-9264
Takeaway: Developers building high-frequency location systems for fleet and dispatch operations consistently find that Mapbox’s usage-based pricing becomes economically unworkable at production API volumes, driving engineering teams to invest in self-hosted PostGIS alternatives rather than absorb the scaling cost.
Verdict
Mapbox is the market-leading developer location platform for building map, navigation, and search experiences into applications, with a publicly documented free-to-paid pricing model, the MapGPT AI navigation SDK (January 2024), and the 2024 Autotech Breakthrough Navigation Technology Solution of the Year award confirming its automotive-grade competitive position.
For engineering teams building location features into products, Mapbox provides the most complete and developer-friendly API ecosystem in this evaluation.
Buyers must model production API volumes against published pricing tiers before committing to avoid bill shock at scale. Teams needing spatial analysis workflows rather than application development should evaluate Esri ArcGIS or CARTO instead.
3. CARTO: Best for Data-Warehouse-Native Spatial Analytics (BigQuery, Snowflake, Databricks, Redshift)
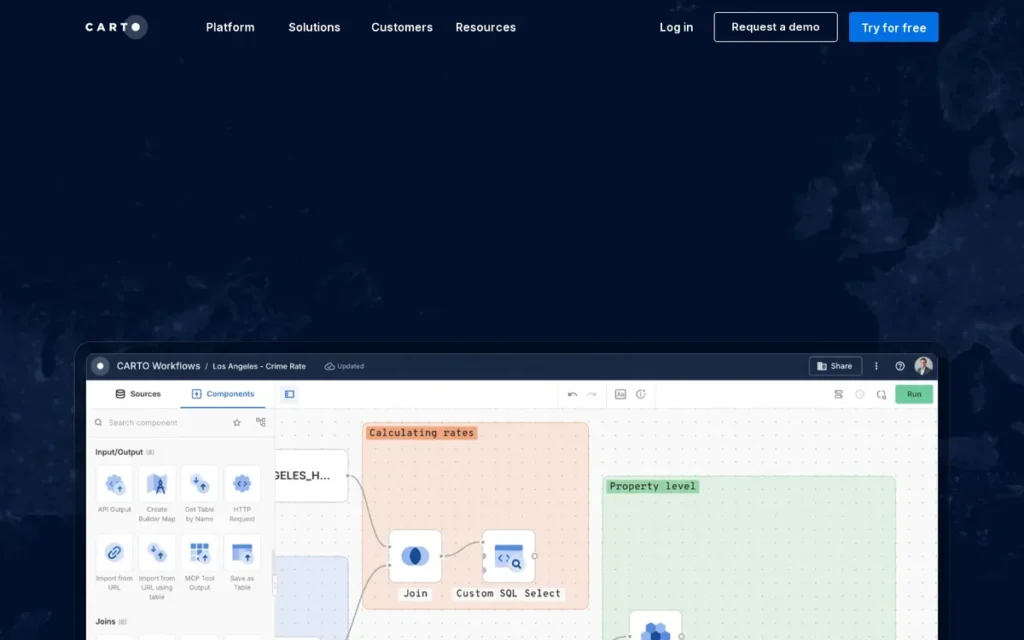
Category: Warehouse-Native Spatial Analytics, a cloud-native spatial analytics platform that executes geospatial queries and visualizations directly inside a customer’s existing cloud data warehouse, eliminating data movement and preserving existing governance controls.
At a Glance
| Field | Detail |
|---|---|
| Category | Warehouse-Native Spatial Analytics |
| Best For | Data engineers, GIS analysts, and analytics teams at organizations already running data in BigQuery, Snowflake, Databricks, or AWS Redshift who need spatial analytics without moving data outside their governed warehouse environment |
| Price Range | 14-day free trial; Pay As You Go (monthly usage-based, no upfront commitment); Enterprise, Strategic, and Custom annual tiers with custom pricing; contact sales for enterprise tier quotes (carto.com/pricing) |
| Primary Strength | CARTO is the only platform in this evaluation built natively to execute spatial analytics inside a customer’s existing cloud data warehouse, eliminating ETL pipelines and preserving data governance through an Analytics Toolbox of 100+ stored-procedure spatial functions |
| Biggest Limitation | CARTO requires an existing, mature cloud data warehouse infrastructure; organizations without an established BigQuery, Snowflake, Databricks, or Redshift environment cannot deploy CARTO meaningfully; and practitioner-documented support quality concerns indicate the support team may not reliably identify the right solution for client use cases |
| One-Line Summary | CARTO is the warehouse-native spatial analytics platform for data-mature enterprises, running 100+ geospatial analysis functions as stored procedures directly inside BigQuery, Snowflake, Databricks, or Redshift without data movement or separate GIS infrastructure; confirmed by Oracle Partner Network (OPN) partner status and practitioner community recognition |
| Last Verified | June 2026 |
Overview
CARTO is a cloud-native, warehouse-native spatial analytics platform that runs geospatial analysis and visualization directly inside a customer’s existing cloud data warehouse (supporting BigQuery, Snowflake, Databricks, AWS Redshift, Oracle, and PostgreSQL) eliminating the ETL pipelines and data movement that traditional GIS tools require.
CARTO was founded in approximately 2012 and has evolved from a consumer mapping tool into an enterprise spatial analytics platform with Oracle Partner Network (OPN) partner status and formal integrations with the Google, Snowflake, Databricks, and AWS ecosystems. CARTO is not a general-purpose GIS tool, a business visualization platform, or a developer API layer, CARTO’s value proposition is specific: organizations with mature data warehouse infrastructure gain spatial analytical capability without disrupting existing governance, compute economics, or access controls.
Key Features
- Warehouse-Native Architecture: CARTO executes all spatial queries: including spatial SQL joins, aggregations, clustering, and index operations, as SQL inside the customer’s BigQuery, Snowflake, Databricks, Redshift, Oracle, or PostgreSQL instance, meaning spatial processing scales with the customer’s existing warehouse compute rather than requiring separate GIS infrastructure (CARTO documentation, 2026).
- Analytics Toolbox (100+ Functions): CARTO’s Analytics Toolbox contains more than 100 advanced spatial analytics functions (including spatial clustering, isochrone generation, H3 spatial indexing, routing analytics, and spatial joins) deployed as native stored procedures within the customer’s warehouse (CARTO API reference, 2026).
- CARTO Builder: CARTO Builder provides a low-code map and visualization interface for creating interactive geospatial dashboards directly from warehouse data, accessible to business intelligence users without GIS expertise while remaining connected to the governed warehouse data layer.
- Spatial Data Observatory: CARTO’s Spatial Data Observatory provides a curated library of pre-licensed geospatial datasets (demographic boundaries, retail trade areas, mobility data, and climate risk layers) that can be joined directly to warehouse tables without negotiating separate data vendor agreements.
- Agentic GIS Capabilities: CARTO’s platform documentation describes CARTO as “the leading Agentic GIS and Location Intelligence platform” CARTO documentation, 2026, signaling active development of AI-augmented spatial query capabilities enabling natural language interaction with geospatial data within warehouse-connected workflows; note this is a vendor-stated positioning rather than an independently verified third-party designation.
Best For
CARTO is best for analytics teams and data engineers at mid-to-large enterprises already operating a BigQuery, Snowflake, Databricks, or Redshift data stack who need to add spatial analytics (network planning, risk assessment, growth opportunity identification, logistics optimization) without extracting data from their governed warehouse environment or deploying a separate GIS system.
If your organization does not currently have a production-mature BigQuery, Snowflake, Databricks, or Redshift data warehouse running in your environment, CARTO is not the right platform for you regardless of how compelling the features appear, evaluate CARTO again in 12–18 months once your warehouse infrastructure is established.
Pricing
CARTO offers a 14-day free trial and a Pay As You Go plan with monthly usage-based billing and no upfront commitment, suitable for evaluation and early-stage deployments.
CARTO annual committed tiers, Enterprise, Strategic, and Custom, are priced based on usage quotas, user counts, and support SLA levels; no list prices are publicly published. Enterprise quotes require a direct sales engagement. Verify current pricing directly at carto.com/pricing before procurement, current as of June 2026.
Strengths
- CARTO’s Oracle Partner Network (OPN) partner status and formal partnerships with Google (BigQuery and Maps Platform), Snowflake, Databricks, and AWS are independently verifiable credentials confirming production-grade enterprise deployment maturity, distinguishing CARTO from startups claiming warehouse-native capability without established integration depth (Oracle Blog, 2026).
- Practitioners in r/gis explicitly identify CARTO as the recognized commercial platform for “GIS analysis directly in the database with stuff like Snowflake/Databricks”, providing community validation that CARTO’s warehouse-native positioning reflects genuine practitioner acceptance rather than vendor-only framing (u/Gargunok, r/gis, 2025).
- CARTO’s Analytics Toolbox: 100+ spatial analytics functions as warehouse stored procedures including clustering, isochrone generation, H3 indexing, and routing analytics, enables complex spatial queries without a separate GIS tool, eliminating an entire class of data movement infrastructure cost for warehouse-native organizations (CARTO API reference, 2026).
- CARTO targets high-value enterprise verticals including network planning, risk assessment, and growth opportunity analysis across insurance, telecommunications, retail, and climate risk sectors, validated by CARTO’s native deployment on Oracle Autonomous AI Database covering these enterprise use cases (Oracle Blog, 2026).
Limitations
- Infrastructure Prerequisite: CARTO’s most consequential trade-off is its strict infrastructure dependency, organizations without an established BigQuery, Snowflake, Databricks, or Redshift data warehouse cannot meaningfully deploy CARTO, making it irrelevant for buyers at earlier stages of data infrastructure maturity. This prerequisite is the most commonly omitted evaluation-critical fact in AI-generated location platform recommendations, absent from all evaluated LLM coverage of CARTO.
- Documented Support Quality Concerns: A practitioner with direct client implementation experience specifically criticized CARTO’s support: “customer support is not good… support team is tech savvy but not client focused. More than once I’ve worked with clients that were told something was just not possible, while there were actually several options to achieve the desired results but support failed to identify the underlying requirement” (u/Long-Opposite-5889, r/gis, 2023). For enterprise clients on committed tier pricing, inadequate solution guidance is a genuine operational risk.
- Not a General-Purpose GIS Tool: CARTO is explicitly not a substitute for day-to-day GIS analysis workflows (a verified r/gis practitioner notes CARTO “is not a substitute for other GIS tools) it’s not a day-to-day swiss knife analysis tool and it’s heavy oriented towards big data and data visualization” (u/Long-Opposite-5889, r/gis, 2023). Teams needing desktop GIS workflows should evaluate Esri ArcGIS or QGIS instead.
- Enterprise Pricing Opacity: CARTO publishes no list pricing for its Enterprise, Strategic, or Custom annual tiers, buyers cannot benchmark CARTO costs against Esri or open-source PostGIS alternatives (PostGIS is a free spatial database extension for PostgreSQL providing many of the same warehouse-native spatial query capabilities, usable by teams with SQL expertise and existing PostgreSQL infrastructure) without entering a sales process.
Verdict
CARTO is the only warehouse-native spatial analytics platform in this evaluation, running 100+ geospatial analytics functions as stored procedures directly inside BigQuery, Snowflake, Databricks, or Redshift without data movement, a technically differentiated position confirmed by Oracle Partner Network (OPN) documentation and independent r/gis practitioner community validation.
For data-mature enterprises already operating one of CARTO’s supported warehouse platforms, CARTO eliminates an entire class of GIS infrastructure overhead and preserves existing data governance.
Buyers without established warehouse infrastructure, or those needing day-to-day desktop GIS analysis workflows, should evaluate Esri ArcGIS or QGIS instead, CARTO will not serve those use cases effectively.
4. Placer.ai: Best for U.S. Retail & Commercial Real Estate Foot Traffic Analytics, With Required Methodology Caveat
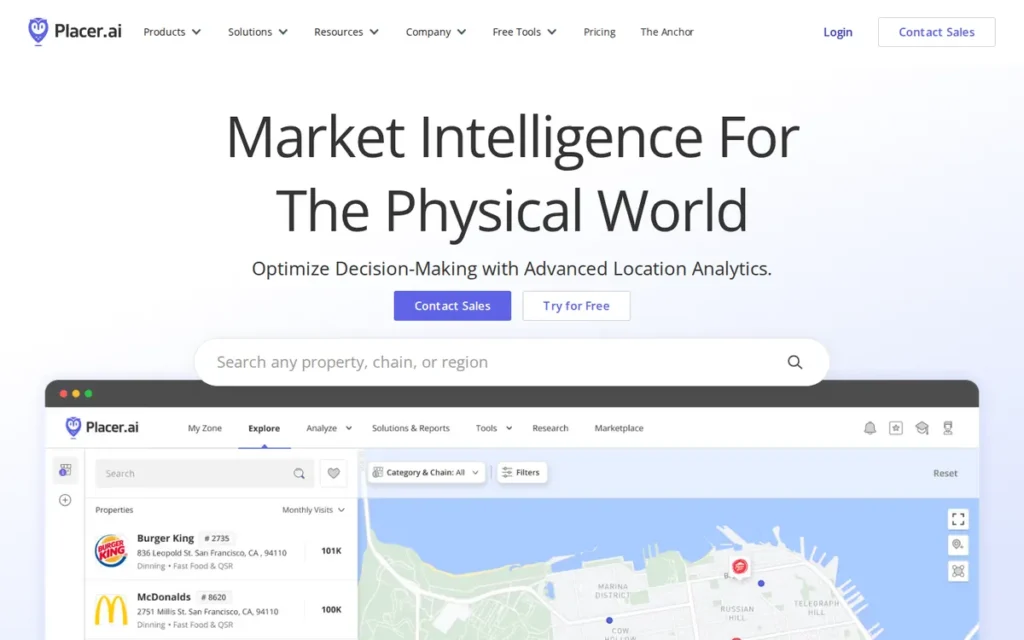
Category: Foot Traffic Analytics, a mobile panel-based platform that estimates physical visit patterns at locations using de-identified device signals to produce directional traffic intelligence for retail, commercial real estate, and hospitality analysis.
At a Glance
| Field | Detail |
|---|---|
| Category | Foot Traffic Analytics |
| Best For | Retail analytics teams, commercial real estate investors and brokers, hospitality operators, and U.S.-focused municipal planners needing competitive visit benchmarking, trade area analysis, and directional foot traffic trends; specifically for relative comparison rather than absolute headcount measurement |
| Price Range | Pricing on request; enterprise subscription tiers; no published list prices; higher tiers unlock API access and dedicated support |
| Primary Strength | Placer.ai provides directional foot traffic intelligence from a ~30M-device U.S. mobile panel, enabling competitive benchmarking and trade area analysis at a scale and speed that manual counting and hardware sensor alternatives cannot match for multi-location or multi-competitor analysis |
| Biggest Limitation | Placer.ai generates statistically derived visit estimates; not census-counted measurements; with documented absolute accuracy discrepancies including a verified case of 100,000 modeled visits versus approximately 200 actual visits counted by a commercial real estate operator using manual clickers, zero international visitor coverage, and a U.S.-only geographic scope |
| One-Line Summary | Placer.ai is the leading U.S. foot traffic analytics platform for retail and commercial real estate, backed by $100M ARR (February 2024) and a ~30M-device mobile panel, but its statistically estimated visit counts must be treated as directional benchmarks rather than absolute measurements; a methodology distinction the platform does not always communicate clearly in its marketing materials |
| Last Verified | June 2026 |
Overview
Placer.ai is a foot traffic analytics platform that uses a panel of approximately 30 million passively collected, de-identified U.S. mobile devices, roughly 8% of the U.S. population, to estimate visits, trade areas, consumer behavior patterns, and competitive visit benchmarks at physical locations, serving retail, commercial real estate, hospitality, government, and nonprofit buyers.
Placer.ai was launched in 2018, is headquartered in Schaumburg, Illinois, and reached $100M in Annual Recurring Revenue on February 20, 2024, demonstrating strong commercial traction within six years of operation (Placer.ai ARR announcement, February 2024). Placer.ai’s core methodology generates statistical visit estimates from sampled device data, reliable for trend analysis and relative competitive comparison but with documented limitations for absolute visitor count accuracy, a distinction that carries material financial consequences for buyers making site selection, lease negotiation, or investment underwriting decisions.
Key Features
- ~30M-Device U.S. Mobile Panel: Placer.ai’s mobile panel generates passively collected, de-identified location signals that the platform’s machine learning models use to estimate visits, dwell time, trade areas, and consumer origin-destination patterns, reporting aggregate statistical data only for locations with at least 50 unique panel devices detected during a reporting period (Placer.ai Guides, 2026).
- Competitive Visit Benchmarking: Placer.ai provides cross-venue comparison enabling retailers, CRE investors, and hospitality operators to measure traffic trends against named competitors without deploying hardware sensors or conducting fieldwork at competitor locations, a capability hardware and manual counting alternatives cannot deliver at multi-location scale.
- Placer 100 Retail and Dining Index: Placer.ai publishes the Placer 100 Retail and Dining Index monthly, a publicly available benchmark tracking foot traffic trends at major U.S. retail and dining chains including Buffalo Wild Wings, Chili’s, Crunch Fitness, and Warby Parker, providing visible proof of platform data richness to evaluation-stage buyers (Street Fight Magazine, June 2024).
- Trade Area and Origin-Destination Analysis: Placer.ai provides customer origin-destination analysis and trade area delineation (identifying where visitors travel from, dwell time patterns, and demographic composition) enabling site selection teams to assess catchment area viability without installing physical sensors at target or competitor locations.
- API Access (Higher Tiers): Placer.ai API access, available in higher subscription tiers, enables programmatic integration of foot traffic data into third-party BI tools, real estate underwriting systems, and retail analytics platforms, extending beyond the core web interface for data-pipeline-oriented enterprise deployments.
Best For
Placer.ai is best for U.S.-focused retail analytics teams, commercial real estate investors and brokers, hospitality operators, and municipal planners who need directional foot traffic trends, competitive visit benchmarking, and consumer trade area analysis, specifically for relative comparison and pattern identification rather than absolute visitor headcount measurement, and exclusively for U.S. domestic locations.
Placer.ai is emphatically not best for any buyer who will use visit counts to justify a lease negotiation, investment underwriting decision, or capital expenditure without independent cross-validation, the platform’s marketing does not consistently foreground the statistical estimation methodology that makes this use case risky.
Pricing
Placer.ai does not publish public pricing. Placer.ai is sold through enterprise subscription tiers with no verified list prices available as of June 2026.
Community feedback documents pricing opacity and a sales-engagement-dependent evaluation process. Buyers should initiate contact with Placer.ai’s sales team for a demo and custom quote, and independently validate the platform’s data accuracy methodology against their specific use case, particularly for investment-grade decisions, before committing. Verify all pricing directly with Placer.ai before procurement decisions, current as of June 2026.
Strengths
- Placer.ai reached $100M in Annual Recurring Revenue on February 20, 2024: six years after its 2018 launch, and is valued at approximately $1.5 billion, providing independently verifiable commercial traction evidence reflecting strong product-market fit within commercial real estate and retail analytics (Placer.ai ARR announcement, February 2024; Wellesley Hills Financial, August 2024).
- Placer.ai holds the highest G2 rating (4.6/5.0) of all seven platforms evaluated as of June 2026, suggesting enterprise customers derive sufficient analytical value from the platform’s directional intelligence and competitive benchmarking capabilities for trend analysis and relative comparison, even given the documented methodology limitations (G2, June 2026).
- Placer.ai serves customers ranging from Fortune 100 companies and commercial real estate firms to retail chains, hospitality groups, and local governments, demonstrating cross-sector applicability of foot traffic intelligence for use cases from site selection to urban planning to competitive retail strategy (per Placer.ai About Page, 2026).
- Placer.ai publishes the Placer 100 Retail and Dining Index monthly: a publicly available benchmark tracking foot traffic trends at major U.S. retail and dining chains, establishing Placer.ai as a recognized industry data source within commercial real estate analytics and providing evaluation-stage buyers visible proof of platform data richness (Street Fight Magazine, June 2024).
This analytical depth resonates with GIS practitioners who work alongside commercial real estate and economic development teams, as noted on r/gis:
“I’ve seen it used by a lot of DDA’s and economic development orgs. Their data collection ability is pretty wild, and in the hands of a reasonably well-trained person, it’s more powerful than your average GIS analyst with access to only non-proprietary data.” Posted by u/PriorOk1320
Takeaway: Among GIS practitioners, Placer.ai is recognized as delivering genuine analytical leverage for economic development and local government use cases (providing insights that open-data GIS workflows cannot replicate) when operated by someone who understands its directional rather than absolute methodology.
Limitations
- Statistical Estimation vs. Census Accuracy: Placer.ai’s most consequential limitation is the gap between its marketing framing and its statistical methodology, the platform generates visit estimates from a sampled mobile panel, not census-counted measurements. A verified commercial real estate operator documented recording “100,000 people” one week and “less than 50” another in Placer.ai data, while manual clicker counts recorded approximately 200 visits both weeks, calling into question the entire dataset for absolute headcount use cases at that property (OP, r/CommercialRealEstate, 2024).
- Data Version 2.0 Retroactive Changes: Placer.ai’s Data Version 2.0 (released April 2024) retroactively changed historical visit data, disrupting longitudinal trend analysis for organizations relying on multi-year benchmarks and carrying direct implications for CRE investors or retailers tracking year-over-year performance. Additionally, Placer.ai provides zero tracking of international visitors, making it unsuitable for airport retail, international tourism markets, or any use case where non-U.S. visitor patterns are material (u/naynayfresh, r/CommercialRealEstate, 2024).
- U.S.-Only Coverage, Zero International Tracking: Placer.ai’s geographic constraint is driven by GDPR and CCPA regulatory requirements that Placer.ai’s marketing does not consistently emphasize, making Placer.ai unsuitable for global retailer site selection, international tourism market analysis, or any operational context requiring visit intelligence for non-U.S. locations.
- 50-Device Panel Minimum Threshold: Placer.ai cannot generate data for low-traffic venues (small independent retailers, rural locations, new developments, or any property where fewer than 50 unique panel devices are detected during a reporting period) excluding a material subset of U.S. commercial real estate from the platform’s coverage without always providing disclosed notification to the subscriber (Placer.ai Guides, 2026).
The methodology transparency concern extends beyond individual accuracy issues to the underlying data philosophy, as GIS practitioners on r/gis have noted:
“I have no beef with Placer.ai but more so with the general lack of data quality or transparency. Curious what their sample size is? ‘Oh don’t worry’. What’s the source? ‘Proprietary information’. Bottom line, this kind of product and others like it (Near, Here, Veraset, Unacast, etc) that don’t tell you how many phones they’re pinging or ground truth any of the data to give you an estimated penetration rate are vastly over promising the value of their data and/or don’t give you the ability to stand behind the conclusions you could draw from the data. If you can’t trust the data quality, what’s the point?” Posted by u/Icy_Praline_6060
Takeaway: GIS and analytics practitioners who evaluate Placer.ai cite its refusal to disclose panel size, data sourcing, and accuracy ground-truthing as a foundational credibility problem, one that applies across the entire mobile panel data category and prevents any buyer from making analytically defensible decisions with its outputs.
Verdict
Placer.ai is the highest-rated location platform in this evaluation (G2 4.6/5.0) and the established standard for U.S. retail and commercial real estate foot traffic analytics, backed by $100M ARR in February 2024 and a ~30M-device panel enabling competitive benchmarking that no hardware sensor deployment can match at multi-location scale.
Placer.ai’s statistical estimation methodology has documented absolute accuracy limitations (verified by independent CRE operator field testing and confirmed across multiple r/CommercialRealEstate threads) that its own marketing materials do not consistently disclose. This is the most consequential information gap between platform marketing and platform reality in this evaluation.
Treat Placer.ai as a directional intelligence and competitive benchmarking tool. For absolute visit counts required for lease negotiations, investment underwriting, or financially consequential site selection decisions, cross-validate with Department of Transportation counts or independent field survey data.
5. Foursquare: Best for Enterprise POI Data Licensing & Place-Aware Application Development

Category: Location Data & POI Intelligence Platform, an enterprise platform for licensing place data (points of interest, location attributes, and visit signals) and building location-aware applications through API access, data warehouse integrations, and enterprise analytics products.
At a Glance
| Field | Detail |
|---|---|
| Category | Location Data & POI Intelligence Platform |
| Best For | Enterprise application developers needing globally verified POI data, marketing analytics teams requiring location-based audience intelligence and campaign attribution, and organizations building place-aware apps needing a commercially licensed, institutionally validated POI dataset |
| Price Range | FSQ Spatial Workbench Developer Plan: $250/month (30-day trial at $0 + usage); Enterprise Places API, Attribution, Audience, and Visits products: pricing on request (foursquare.com/pricing) |
| Primary Strength | Foursquare’s Places Engine contains 200M+ globally verified points of interest, endorsed by Esri as the POI data source for ArcGIS Places across 170+ countries; providing the most institutionally validated commercial POI dataset of any platform in this evaluation |
| Biggest Limitation | Foursquare’s December 15, 2024 consumer City Guide app shutdown (web version discontinued April 28, 2025) removes the primary mechanism through which its Superuser community historically contributed human-verified POI corrections and updates, raising unresolved long-term data freshness questions about the quality layer differentiating its Places Engine |
| One-Line Summary | Foursquare is an enterprise location data and POI intelligence platform with a 200M+ place database endorsed by Esri for ArcGIS Places across 170+ countries, a $250/month developer entry tier, and a 15-year POI data heritage; though the December 2024 consumer app shutdown introduces unresolved questions about the long-term sustainability of its human-verified data quality layer |
| Last Verified | June 2026 |
Overview
Foursquare is an enterprise location intelligence and places data platform built around a Places Engine database of 200M+ globally verified points of interest, endorsed by Esri as the POI data foundation for ArcGIS Places across more than 170 countries as of 2026. Foursquare was founded in 2009 by Dennis Crowley and Naveen Selvadurai and has fully pivoted to an enterprise B2B data business following the December 15, 2024 shutdown of the Foursquare City Guide consumer app (web version discontinued April 28, 2025), with the Swarm check-in app continuing operation and the enterprise API and data business remaining active.
Foursquare’s current enterprise product suite spans the Places API, FSQ Spatial Workbench, Attribution, Audience, and Visits products, serving enterprise marketers, application developers, and analytics teams who need a trusted, globally licensed POI dataset or location-based visit attribution capabilities.
Key Features
- 200M+ Place Database (Places Engine): Foursquare’s Places Engine contains 200M+ globally verified places in its commercial database, with a 100M+ place subset released under the Apache 2.0 open-source license, providing a cost-free POI alternative for developers who can build their own confidence-score filtering on the community-sourced open dataset (Foursquare product pages, 2026).
- Multi-Layer Quality Pipeline: Foursquare’s Places Engine quality methodology combines programmatic web scraping, Superuser community verification, and AI moderation to maintain POI accuracy, the multi-source pipeline Esri trusted as the foundation for ArcGIS Places coverage across 170+ countries; as of early 2025, Esri incorporates Foursquare Open Source Places data for ArcGIS Places global coverage (ArcGIS Documentation, verified June 2026).
- FSQ Spatial Workbench: Foursquare FSQ Spatial Workbench provides analytics and visualization for spatial data analysis, territory intelligence, and visit pattern mapping, accessible via a published $250/month Developer Plan with a 30-day trial period, providing one of the few transparent pricing anchors in this evaluation (Foursquare Pricing, 2026).
- Enterprise Attribution and Audience Products: Foursquare Attribution, Audience, and Visits products enable location-based marketing campaign measurement, consumer behavioral segmentation, and physical visit analysis for enterprise marketing and analytics teams, priced via custom enterprise quotation with no published list prices.
- Single-Record REST API (No Batch Support): Foursquare provides a REST API for the Places database supporting single-record place lookups and proximity search; community developer testing confirms the API lacks batch query support, requiring individual API calls per location lookup, an O(n) time complexity constraint that adds engineering overhead for large-scale POI pipeline builds (r/ExperiencedDevs, u/Rexcovering, 2024).
Best For
Foursquare is best for enterprise application developers building place-aware features into consumer or enterprise apps, marketing analytics teams needing location-based audience segmentation and campaign attribution, and organizations seeking a commercially licensed, globally verified POI dataset with institutional quality credentials, particularly teams already in the Esri/ArcGIS ecosystem where the Esri-Foursquare data quality endorsement provides independently verified confidence.
Pricing
Foursquare publishes a $250/month Developer Plan for FSQ Spatial Workbench with a 30-day trial available at $0 plus usage costs, one of the few verifiable pricing anchors in the location platform category (Foursquare Pricing, 2026).
Foursquare enterprise pricing for the full commercial Places API tier, Attribution, Audience, and Visits products is custom-quoted and not publicly listed. A developer community source noted that Foursquare previously charged for confidence scores as a separate upsell, indicating the enterprise pricing model includes modular capability bundling (r/ExperiencedDevs, 2024).
The Apache 2.0 open-source 100M-place dataset is freely available for developers who can accept the filtering overhead of an unverified community-sourced dataset. Verify all current enterprise pricing directly with Foursquare before procurement, current as of June 2026.
Strengths
- Esri’s selection of Foursquare as the POI data provider for ArcGIS Places across more than 170 countries is the strongest independently verifiable data quality endorsement in the location platform category, when the world’s leading GIS platform trusts a specific POI source for global production coverage, that institutional validation is a due-diligence-grade quality signal for enterprise buyers (ArcGIS Documentation, verified June 2026).
- CB Insights has recognized Foursquare as a leader in location intelligence in its market index, a third-party analyst designation cited in Foursquare’s 2025 materials; note that the specific CB Insights ranking cycle year is not independently confirmed as a 2025 or 2026 update, and readers should verify current ranking status directly (Foursquare Blog, 2026).
- Foursquare’s hybrid AI-plus-human Places Engine quality methodology: combining programmatic scraping, Superuser community contributor verification, and AI moderation, represents a multi-source quality assurance pipeline that algorithmic-only competitors cannot replicate at equivalent global scale, evidenced by the Esri partnership validation (Foursquare Blog, 2026).
- Foursquare released 100M+ global places under the Apache 2.0 open-source license: enabling cost-free POI access for developers building location-aware applications and expanding Foursquare’s credibility within the developer ecosystem beyond its commercial API customer base (Foursquare product pages, 2026).
Limitations
- City Guide Shutdown and Data Pipeline Sustainability: Foursquare’s most consequential structural concern is the December 15, 2024 shutdown of the Foursquare City Guide consumer app, the primary channel through which the Superuser community historically contributed human-verified POI updates at global scale. Community commentary identifies this risk directly: “when they split it they lost a majority oftheir active users. I don’t know how they can become relevant again” (r/Foursquare, 2024). The long-term sustainability of the human-verification layer remains an unresolved question for multi-year enterprise contracts.
Long-time Foursquare community members on r/Foursquare connect current data quality directly to declining user participation:
“When the app was being used by a lot of people, the data was always fresh and up to date. You would often find really great places around the world to visit based on simple searches in the app. The rating system was pretty good when people were leaving feedback on places and I always had success in finding places to eat and get coffee in any city around the world. I use Google for this now and it’s awful in comparison. The search in the app is still good. The way I used to use it is an ordered search with the highest rated at the top. Then put it on the map and refine things that way. The problem is that the data these days is incomplete.” Posted by u/sitdowndisco
Takeaway: Community veterans directly attribute Foursquare’s declining POI data completeness to the reduction in active contributors, a causal link that makes the City Guide consumer app shutdown a credible enterprise risk, since the same community participation mechanism that kept data fresh is now further diminished.
- No Batch API Support: Foursquare’s Places API lacks batch query support: requiring individual API calls per location lookup and creating O(n) time complexity for POI pipeline builds, adding significant engineering overhead compared to competitors with bulk or batch endpoint support, a specific limitation documented by a developer evaluating Foursquare for large-scale POI database population (r/ExperiencedDevs, u/Rexcovering, 2024).
- Open Dataset Quality Filtering Required: Users of the open-source 100M-place dataset have flagged the presence of “user-generated junk, pranks, and mistakes in geolocation-centric datasets” that require confidence-score filtering, with confidence scores previously sold as a commercial upsell by Foursquare, creating an additional cost consideration for developers relying on the open dataset for production use cases (OpenStreetMap community, 2024).
- Enterprise Pricing Opacity: Foursquare publishes pricing only for the FSQ Spatial Workbench Developer Plan ($250/month), the full commercial Places API, Attribution, Audience, and Visits enterprise products carry no published list prices, requiring a full sales engagement before cost can be modeled, disadvantaging buyers conducting self-service evaluation against alternatives with more pricing transparency.
Verdict
Foursquare is the enterprise POI data platform with the strongest institutional validation in this evaluation, Esri’s selection of Foursquare data for ArcGIS Places across 170+ countries and CB Insights’ location intelligence recognition confirm the commercial and quality credibility of the Places Engine’s 200M+ global database.
Foursquare’s $250/month Spatial Workbench Developer Plan provides a rare pricing transparency anchor in a category dominated by opaque enterprise quotes. The Apache 2.0 open-source 100M-place dataset offers a cost-free alternative for developers who can manage quality filtering independently.
The December 15, 2024 City Guide consumer app shutdown (web version discontinued April 28, 2025) introduces a genuine unresolved question about the human-verified data quality pipeline that buyers should investigate directly with Foursquare before committing to a multi-year enterprise contract.
6. Precisely: Best for Enterprise Address Validation, CASS-Certified Geocoding & Regulated-Industry Data Integrity

Category: Address Validation & Data Integrity Platform, an enterprise-grade platform providing CASS-certified address standardization, geocoding, data enrichment, and geospatial data quality management for organizations where address accuracy and postal compliance are operational and regulatory requirements.
At a Glance
| Field | Detail |
|---|---|
| Category | Address Validation & Data Integrity Platform |
| Best For | Financial services, insurance, healthcare, direct mail, and government organizations requiring CASS-certified address validation, enterprise-grade geocoding accuracy, and data integrity management at scale across large customer or location datasets |
| Price Range | Pricing on request; enterprise subscription, custom-quoted based on deployment scale, modules selected (Spectrum Platform, EngageOne, enrichment packages), and usage volume; no published list prices |
| Primary Strength | Precisely is the only CASS-certified address validation and geocoding platform in this evaluation, meeting USPS-mandated accuracy thresholds of 98.5% for ZIP, ZIP+4, and carrier route standardization; deployed by 95 of the Fortune 100 (per Precisely April 2026 press release) across 12,000 customer organizations in 100+ countries |
| Biggest Limitation | Precisely’s highest-value capabilities are specific to address validation and postal compliance use cases; organizations needing general-purpose mapping, spatial analytics, developer APIs, or foot traffic intelligence will not find equivalent capability here, and its lowest G2 rating (4.2/5.0) reflects documented implementation complexity and dated UI concerns |
| One-Line Summary | Precisely is the enterprise address validation and data integrity platform with USPS CASS certification, deployed by 95 of the Fortune 100 (April 2026) across 12,000+ customers in 100+ countries, providing the most credentialed geocoding and postal compliance capability in this evaluation for organizations where address accuracy is a regulated operational requirement |
| Last Verified | June 2026 |
Overview
Precisely is a data integrity platform combining CASS-certified address validation, enterprise geocoding, data enrichment, geospatial data quality management, and customer communications tools under the Spectrum Technology Platform and EngageOne product suite, serving 12,000 customers in more than 100 countries, including 95 of the Fortune 100 (per Precisely April 2026 press release; older marketing materials cited 99) (Precisely official; AWS Marketplace listing, 2026).
Precisely is the successor company to Pitney Bowes Software, separated through private equity acquisition in 2019–2020, inheriting decades of enterprise-grade address processing development originally built for financial services, insurance, healthcare, direct mail, and government sectors. Precisely’s primary value is not mapping or spatial analytics but the upstream data quality layer, ensuring addresses are valid, geocodes are accurate, and spatial data is enriched to the standards required for regulated industry operations and postal compliance workflows.
Key Features
- USPS CASS Certification: Precisely’s Spectrum Technology Platform and Geo Addressing API are CASS (Coding Accuracy Support System) certified by the USPS, meeting mandated accuracy minimums of 98.5% for ZIP, ZIP+4, and carrier route standardization, enabling organizations to qualify for USPS bulk mailing discounts and maintain postal data hygiene standards required in regulated industries (USPS PostalPro, 2026; Precisely CASS documentation, 2026).
- Multi-Country Address Validation: Precisely provides address validation, address standardization, and geocoding across 100+ countries through its global address reference database, supporting multinational enterprise organizations with geographically distributed customer and location datasets that require consistent address integrity standards across markets.
- Data Enrichment Capabilities: Precisely’s data enrichment capabilities append location intelligence attributes (demographic data, risk scores, POI proximity, and spatial boundary classifications) to existing enterprise datasets, enabling spatial context to be added to address-keyed operational databases without requiring a full GIS implementation.
- Cloud-Modernized EngageOne Suite: Precisely’s EngageOne Compose and EngageOne Vault (customer communications management products) are available on Amazon Web Services as of 2026, reflecting Precisely’s cloud modernization effort and reducing on-premise infrastructure overhead for new deployments (PR Newswire, 2026).
- Mandatory CASS Cycle Compliance: Precisely maintains mandatory CASS upgrade cycle compliance for customers, including CASS Cycle O compatibility updates, a recurring implementation requirement tied to USPS regulatory refresh cycles that customers must complete to maintain postal certification and preserve bulk mailing discount eligibility (Precisely CASS Cycle O page, 2026).
Best For
Precisely is best for financial services, insurance, healthcare, and direct mail organizations where CASS-certified postal compliance is a regulatory or operational requirement, and for enterprise IT and data governance teams managing large customer databases where address standardization accuracy directly impacts downstream operational systems, claims processing, correspondence delivery, or regulatory reporting.
Pricing
Precisely does not publish public pricing. Precisely enterprise pricing is custom-quoted based on deployment scale, module selection (Spectrum Platform modules, EngageOne communications products, enrichment data packages), and usage volume.
PlugRoute attempted to obtain public pricing through all available channels, none exist for Precisely enterprise tiers. No verified public dollar amounts are available as of June 2026. The enterprise model is consistent with Precisely’s position as a negotiated-contract vendor serving Fortune 100 buyers under multi-year agreements.
Buyers should plan for a structured sales engagement with procurement cycle and budget authority before receiving a quote. Verify all current pricing directly with Precisely before procurement decisions, current as of June 2026.
Strengths
- Precisely serves 95 of the Fortune 100 (per Precisely April 2026 press release; older marketing materials cited 99) across 12,000+ customer organizations in more than 100 countries, the highest verified Fortune 100 penetration of any platform in this evaluation, reflecting structural deployment in enterprise data operations where address integrity is a regulated operational requirement (Precisely official; AWS Marketplace listing, verified June 2026).
- Precisely’s USPS CASS certification is a hard technical credential requiring periodic requalification against mandated postal accuracy thresholds of 98.5% for ZIP, ZIP+4, and carrier route standardization, a compliance credential required for bulk mailing postal discounts that no other platform in this evaluation holds (USPS PostalPro, verified 2026).
- Precisely’s Pitney Bowes Software heritage provides a multi-decade track record of enterprise-grade address processing development, giving the Spectrum Technology Platform maturity and institutional enterprise relationship depth that newer geospatial analytics entrants in this evaluation cannot match for the specific use case of high-volume address validation at regulated industry standards.
- Precisely expanded its FedRAMP-authorized offering to include its Geo Addressing API for address verification and geocoding in 2025, a federal cloud security qualification extending Precisely’s regulated-industry credentials beyond postal compliance into U.S. government agency address data management (PR Newswire, FedRAMP announcement, 2025).
Limitations
- Lowest G2 Rating in This Evaluation: Precisely carries the lowest G2 rating (4.2/5.0) among all seven evaluated platforms, reflecting enterprise reviewer feedback citing implementation complexity, dated user interfaces in legacy Spectrum Platform modules, steep learning curves for administrative configuration, and high total cost of ownership as consistent friction points (G2, June 2026). Buyers evaluating Precisely should request a demonstration of the specific modules required for their use case before signing, as UI quality and workflow complexity vary significantly between newer cloud-native EngageOne modules and legacy Spectrum components.
- Mandatory CASS Cycle Upgrade Burden: Precisely’s CASS cycle compliance requirement imposes a mandatory periodic upgrade burden, when USPS refreshes its CASS cycle (as with the Cycle O transition), customers must complete implementation updates to maintain postal certification, adding recurring operational cost that organizations must factor into total cost of ownership modeling beyond initial licensing fees (Precisely CASS Cycle O page, 2026).
- Narrow Use-Case Profile: Precisely is a highly specialized platform whose capability profile does not extend into general-purpose mapping, spatial analytics, developer API access, or foot traffic intelligence, organizations with any of these needs should evaluate Esri ArcGIS, Mapbox, CARTO, or Placer.ai respectively, as Precisely’s core differentiation serves a specific, bounded use case that does not apply outside regulated postal compliance and data integrity contexts.
- Legacy UI and Implementation Complexity: Precisely’s legacy Spectrum Technology Platform modules carry dated user interfaces and architectural decisions from the Pitney Bowes Software era, enterprise reviewers on G2 consistently cite complex administrative configuration, dated UI, and steep learning curves for new staff onboarding as friction points that add ongoing training and support cost beyond initial licensing fees (G2, June 2026).
Verdict
Precisely is the enterprise data integrity standard for address validation and CASS-certified geocoding, deployed by 95 of the Fortune 100 (per April 2026 press release) across 12,000+ organizations in more than 100 countries, the most broadly adopted platform in this evaluation by Fortune 100 customer count among organizations where address accuracy and postal compliance are regulated operational requirements.
Precisely’s lowest G2 rating (4.2/5.0) and fully opaque pricing reflect the implementation complexity inherent in a mature enterprise platform built for Fortune 100 procurement cycles rather than developer-driven self-service adoption. For organizations that require CASS-certified postal compliance at Fortune 100 scale, Precisely’s implementation complexity and pricing opacity are predictable enterprise trade-offs rather than disqualifying defects.
Buyers outside financial services, insurance, healthcare, or direct mail should evaluate whether Precisely’s narrow specialization in address validation and postal compliance aligns with their location platform requirements before initiating a sales process.
7. Mapline: Best No-Code Business Mapping for SMB Sales Teams, Field Operations & Territory Management
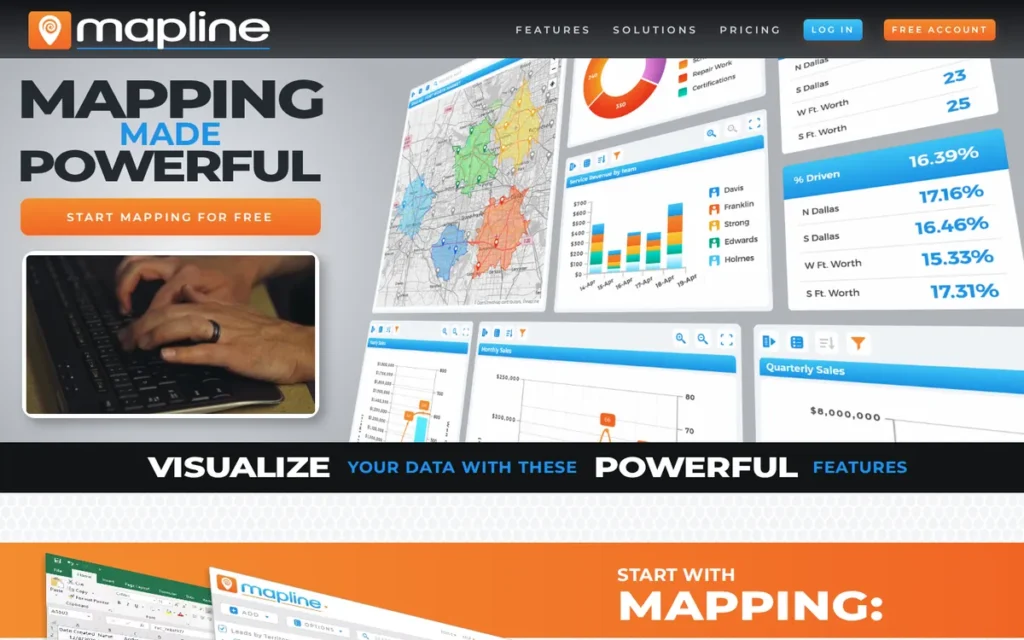
Category: No-Code Business Mapping, a web-based mapping platform that converts spreadsheet or CRM data into interactive territory maps, heat maps, and route plans for non-technical business teams without GIS expertise or coding requirements.
At a Glance
| Field | Detail |
|---|---|
| Category | No-Code Business Mapping |
| Best For | Sales managers, field operations teams, and SMB business analysts who need to convert spreadsheet or CRM data into territory maps, heat maps, and optimized routes without GIS expertise or engineering resources |
| Price Range | Free version available; approximately $330/year (basic territory mapping) to $660/year (Pro with custom shapes and heat maps); approximately $99/month to $349/month for advanced analytics and territory management; verify current tiers at mapline.com |
| Primary Strength | Mapline provides the most accessible no-code path from spreadsheet data to interactive business maps in this evaluation, with the most transparent published pricing; enabling SMBs to evaluate and adopt territory mapping and heat mapping without a sales engagement or GIS expertise |
| Biggest Limitation | Mapline’s analytics depth and scalability ceiling are significantly below the enterprise platforms in this evaluation; organizations requiring advanced spatial analysis, large dataset processing, predictive territory modeling, or bi-directional CRM sync will outgrow Mapline’s capabilities and need to migrate to more capable platforms |
| One-Line Summary | Mapline is the leading no-code business mapping platform for SMB sales and field operations teams, offering Excel-to-territory-map workflows, automated territory rebalancing, and published pricing starting at approximately $330/year; making it the most pricing-transparent and technically accessible platform in this evaluation for non-GIS business users |
| Last Verified | June 2026 |
Overview
Mapline is a no-code business mapping platform that converts Excel, CSV, or CRM data into interactive territory maps, heat maps, optimized routes, and KPI dashboards for sales, operations, and field teams who need geographic data visualization without GIS expertise or engineering resources.
Mapline positions itself as a “geo BI, geo mapping, geo routing, and geo scheduling” platform, occupying a specific market gap between enterprise GIS tools that are too technical and expensive for non-specialist use and pure BI tools with no spatial capability (Mapline official, 2026). Mapline’s published pricing with a free version and annual tiers starting at approximately $330/year is the most transparent cost structure in this entire evaluation, making Mapline uniquely accessible for SMBs conducting self-service location mapping evaluation without a formal procurement budget.
Key Features
- Excel and CSV-Native Data Import: Mapline’s Excel and CSV-native import enables non-technical users to upload address data from existing spreadsheets and generate geocoded pin maps, territory overlays, and heat maps in minutes, without writing code, using a GIS application, or engaging a spatial data consultant (Mapline official, 2026).
- Automated Territory Rebalancing: Mapline’s territory mapping module supports ZIP code-based territory design, custom shape drawing, proximity-based boundary creation, and automated territory rebalancing that redistributes sales rep assignments as headcount, product lines, or market geographies change, replacing error-prone manual spreadsheet allocation (Mapline Territory Mapping Features, 2026).
- KPI Dashboard Integration: Mapline’s KPI dashboard integration maps business performance metrics (revenue by territory, call volume by region, and customer density by zone) directly onto territory maps, enabling sales managers to identify geographic performance gaps without configuring a separate BI tool.
- Route Optimization: Mapline’s route optimization module generates optimized multi-stop routes from mapped location data, enabling field sales and service teams to plan efficient visit sequences without a dedicated routing application or GIS engineer.
- Secure Map Sharing: Mapline supports map sharing and collaboration via secure links, enabling non-GIS users to distribute territory maps, heat maps, and route plans to field teams and management stakeholders without requiring recipients to hold Mapline accounts or any GIS software.
Best For
Mapline is best for sales operations managers, field service directors, and SMB business analysts at organizations without dedicated GIS staff who need to visualize customer locations, design and rebalance sales territories, optimize field visit routes, and share location-based KPI dashboards, specifically where the entire workflow begins with spreadsheet or CRM data and must produce a deployable result without technical implementation resources.
Pricing
Mapline is the most pricing-transparent platform in this evaluation. Mapline offers a permanently free tier for basic territory creation and pin plotting with no credit card required, enabling evaluation-stage SMB buyers to test core workflows with real data before committing to a paid plan.
Published annual tiers have been cited at approximately $330/year for basic territory mapping and $660/year for the Pro package including custom shapes and heat maps (MapBusinessOnline competitor comparison). Monthly plans starting at approximately $99/month up to approximately $349/month for advanced analytics and territory management have been cited by Impakter Rankings (2025).
Mapline is the only platform in this evaluation where a buyer can complete the entire evaluation-to-purchase process without a sales engagement. Verify exact current tier names and pricing directly at mapline.com before purchase, current as of June 2026.
Strengths
- Mapline is the only platform in this evaluation with a free version and publicly published annual pricing tiers, enabling complete self-service evaluation without a sales engagement, a capability absent as of June 2026 from all other platforms in this comparison, each of which requires a sales engagement before providing cost transparency for enterprise or mid-market tiers (Mapline.com, 2026; MapBusinessOnline comparison).
- Mapline holds a G2 rating of 4.5/5.0 (June 2026), with Capterra reviews specifically citing Excel data import, geocoding accuracy, heatmap quality, and map sharing as valued capabilities, confirming the platform consistently delivers on its core no-code business mapping promise for its target SMB and sales operations audience (G2, June 2026; Capterra, 2026).
- Mapline’s automated territory rebalancing capability reduces the operational burden of redistributing sales territories as headcount or market conditions change, replacing error-prone manual spreadsheet allocation for sales operations teams without GIS resources and reducing territory planning cycle times from days to hours (Mapline Territory Mapping Features, 2026).
- Mapline’s permanently free tier provides basic territory creation and pin plotting with no credit card required, enabling evaluation-stage SMB buyers to test core mapping workflows with real data before committing to any paid plan, a risk-free onboarding path unique in this evaluation where all other platforms require either credit card entry or a sales engagement to begin testing (Mapline official, 2026).
Limitations
- Analytics Ceiling: Mapline’s most consequential trade-off is its analytics depth, the platform is purpose-built for visual territory mapping, heat mapping, and basic route optimization, not for spatial analytics, geoprocessing, advanced CRM bi-directional integration, large-dataset processing, or predictive territory modeling. Competitive documentation from alternative territory mapping platforms confirms Mapline’s strongest differentiation is visual territory creation, with limited advanced analytics depth and scalability constraints for enterprise-grade deployments (eSpatial alternative comparison, 2025).
- Enterprise Scalability Constraints: Organizations that begin with Mapline’s SMB tier frequently outgrow its capabilities as data volumes increase or analytical requirements deepen, requiring migration to platforms such as Esri ArcGIS Business Analyst or CARTO that carry the switching costs typical of any platform change, representing a real operational disruption for organizations whose territory data and workflow configurations are embedded in Mapline.
- Geocoding Accuracy for Irregular Addresses: Mapline’s geocoding accuracy depends on its underlying geocoding engine, which third-party reviewers note is less precise than enterprise-grade geocoding provided by platforms like Precisely or CARTO’s warehouse-integrated spatial functions, meaning pin placement accuracy for addresses in rural areas, new developments, or non-standardized address formats may require manual correction before territory maps reflect actual customer locations accurately (Capterra, 2026). Organizations managing large customer datasets with irregular address quality should test geocoding accuracy with a representative sample before committing territory workflows to Mapline’s engine.
- No Native Bi-Directional CRM Sync: Mapline’s CRM integration capabilities are primarily import-oriented rather than native bi-directional sync, organizations requiring real-time territory assignment updates flowing back into Salesforce or HubSpot based on geographic rule changes will find Mapline’s integration depth insufficient for fully automated sales operations workflows.
Verdict
Mapline is the most pricing-transparent and technically accessible location mapping platform in this evaluation, with a free version and published annual tiers starting at approximately $330/year that enable complete self-service evaluation for SMB buyers, a unique capability in a category where all other evaluated platforms require sales engagement before cost transparency is provided.
For sales managers, field operations teams, and non-technical business analysts who need to convert spreadsheet data into territory maps and route plans without GIS expertise, Mapline delivers its core promise with a 4.5/5.0 G2 rating confirming user satisfaction within its target audience.
Organizations with advanced spatial analytics requirements, enterprise dataset volumes, or governance-sensitive data workflows should evaluate Esri ArcGIS or CARTO rather than treating Mapline as a scalable GIS replacement.
What Red Flags Should I Watch For When Evaluating Location Platform Software?
The five most critical red flags in location platform software evaluations each represent a distinct way evaluation-stage buyers receive incomplete information before committing to a platform. Recognizing these patterns before engaging vendors prevents the category mismatches, pricing surprises, and data quality errors that account for most post-deployment disappointment in this market.
Red Flag #1: Usage-Based Pricing Without a Production Budget Model
Platforms such as Mapbox and CARTO charge based on API call volume or warehouse compute, costs negligible during development but capable of escalating sharply in production.
Always model your expected production API call volume, session count, or query frequency against published pricing tiers before committing to an architecture that depends on a usage-billed platform. Bill shock from unexpected API volume at production scale is the most consistently documented post-deployment surprise in the developer location platform category.
Red Flag #2: Foot Traffic Data Presented Without Methodology Disclosure
Foot traffic data presented without methodology disclosure is not data, it is a number whose meaning cannot be evaluated.
Any vendor presenting visit counts without disclosing whether figures are census-counted or statistically estimated from a sampled panel is presenting data that will generate materially incorrect decisions. The gap between estimated and actual counts has been verified to exceed orders of magnitude for specific locations, documented as 100,000 modeled versus approximately 200 counted by independent field testing (r/CommercialRealEstate, 2024).
Red Flag #3: Warehouse-Native Positioning Without Infrastructure Prerequisite Disclosure
A vendor marketing warehouse-native spatial analytics without prominently disclosing the required existing data warehouse infrastructure is omitting the most consequential deployment constraint.
CARTO requires a production-mature BigQuery, Snowflake, Databricks, or Redshift environment to deploy meaningfully, organizations at earlier stages of data infrastructure maturity will find the platform non-functional for their environment, regardless of how compelling the feature set appears during sales evaluation.
Red Flag #4: POI Data Quality Claims Without Third-Party Validation Credentials
Any vendor claiming global POI data quality should be asked for independently verifiable validation credentials, such as named enterprise partnerships with recognized GIS platforms, analyst index placements, or accuracy benchmarks from certified third-party audits.
Algorithmic-only POI datasets lack the human-verification layer that prevents stale listings, closed businesses, and geocoding errors at scale. Confidence score availability and methodology transparency are minimum requirements for enterprise POI procurement.
Red Flag #5: Enterprise GIS Recommendations Without Total Cost of Ownership and Lock-In Analysis
Any evaluation of Esri ArcGIS that omits proprietary geodatabase format lock-in, mandatory extension fees, certification-dependent administration costs, and the structural barrier to migrating accumulated geoprocessing workflows is incomplete.
The r/gis practitioner community consistently identifies Esri’s lock-in dynamics as more consequential for long-term platform decisions than feature comparisons, and the same structural concern applies to any platform with proprietary data formats or certification requirements that increase switching costs progressively over time (r/gis, multiple threads, 2025).
What Questions Should I Ask Before Choosing a Location Platform?
Before selecting a location platform, decision-makers should ask five core evaluation questions covering use case fit, infrastructure compatibility, pricing at production scale, data methodology, and regulatory requirements. Answering these questions before beginning feature comparisons eliminates the category mismatches that account for most post-deployment disappointment in the location platform market.
Question #1: What is my primary use case, building a product, analyzing data, validating addresses, or visualizing territories?
The answer determines which category of location platform is relevant before any specific tool comparison begins.
Engineering teams building location features need developer API platforms like Mapbox. Data analysts at warehouse-native organizations need CARTO-category tools. Organizations managing postal compliance need CASS-certified platforms like Precisely. Sales managers without technical staff need no-code tools like Mapline. Answering this question first eliminates four or five platforms from consideration before any feature comparison begins.
Question #2: Do I have an existing cloud data warehouse (BigQuery, Snowflake, Databricks, or Redshift) and is it production-mature?
This question gates CARTO’s relevance entirely, organizations without an established data warehouse cannot deploy CARTO meaningfully.
It also determines whether PostGIS (self-hosted, open-source, free) is a viable alternative for analytics-oriented use cases where warehouse infrastructure exists and the organization has SQL-proficient data staff who do not require a commercial spatial analytics overlay.
Question #3: What is my expected API call volume or data query frequency at production scale, and have I modeled costs at that volume?
Usage-based platforms (primarily Mapbox and CARTO’s Pay As You Go tier) require production volume cost modeling before architectural commitment. Costs that are negligible at development scale can generate significant monthly expense at production traffic volumes.
Request a production cost estimate from the vendor based on your expected load before finalizing vendor selection. Mapbox API call costs, CARTO warehouse compute costs, and Foursquare confidence score upsells can each generate significant monthly expense at scale that is not apparent from free tier or development-phase pricing.
Question #4: Do I need absolute visitor counts, or directional traffic trends and relative competitive benchmarking?
Platforms like Placer.ai generate statistically estimated visit counts valid for trend analysis and relative competitive comparison, but with documented absolute accuracy limitations. A verified case documented 100,000 modeled visits versus approximately 200 actual visits at a commercial property (r/CommercialRealEstate, 2024).
If your decision requires census-accurate headcounts for financial underwriting, lease negotiations, or investment decisions, cross-validate panel-based data against DOT traffic counts or independent manual surveys before committing.
Question #5: What are my regulatory, postal compliance, or data governance requirements, and do they mandate specific certifications or architectures?
Match your specific regulatory or governance context to the platform requirement it mandates:
- USPS bulk mailing compliance required → Precisely (CASS-certified Spectrum Platform and Geo Addressing API)
- U.S. federal government procurement → Esri ArcGIS Online (FedRAMP-authorized) or Precisely Geo Addressing API (FedRAMP-authorized, 2025)
- GDPR or CCPA regulatory jurisdiction → verify data processing agreements with Placer.ai and Foursquare before contract; both aggregate consumer-sourced location signals subject to privacy regulation
- Strict data governance preventing data movement outside controlled environments → CARTO (warehouse-native architecture keeps all data inside your governed BigQuery, Snowflake, Databricks, or Redshift instance)
How Did We Rank These Location Platform Tools?
These seven location platform software tools were ranked using an evidence-based five-criterion scoring framework: market adoption, review platform ratings and community validation, technical differentiation depth, pricing transparency, and integration ecosystem flexibility, each criterion weighted by verifiable third-party data rather than vendor claims. No company received preferential treatment.
8a. How Was the Evaluation Process Conducted?
The evaluation process followed four sequential steps:
- AI search engine query analysis: Multiple AI engines were queried with the target search prompts to identify existing LLM coverage patterns and document gaps versus verified practitioner data.
- Independent web research: Perplexity-powered web research gathered current vendor documentation, pricing data, third-party analyst designations, and independent review platform ratings for all seven platforms simultaneously.
- Reddit practitioner community analysis: Community discussions from r/gis, r/CommercialRealEstate, r/ExperiencedDevs, and r/Foursquare were analyzed for post-implementation experience that contradicts or validates vendor marketing claims.
- Third-party data cross-referencing, All vendor claims were cross-referenced against independently verifiable sources, G2, Capterra, USPS PostalPro, ArcGIS Documentation, Autotech Breakthrough Awards, and Oracle partnership documentation, before being included as stated facts.
8b. What Are the Five Ranking Criteria?
C1: Market Adoption & Verified Organizational Reach: Assessed using verified customer counts, named enterprise partnerships, analyst index placements, ARR milestones, and documented deployment scale. Self-reported vendor claims are noted as such and weighted below independently verifiable figures. Why it matters: A platform’s real-world adoption provides evidence of production-grade reliability, ecosystem maturity, and vendor staying power, critical concerns for procurement leads making multi-year infrastructure commitments.
C2: Review Platform Ratings & Community Practitioner Validation: Assessed using G2 star ratings (verified June 2026) supplemented by substantive Reddit practitioner community discussions reflecting post-implementation experience. Community critiques receive equal weight to positive ratings. Why it matters: Independent user ratings and practitioner community consensus reveal gaps between marketing promises and real-world implementation experience that evaluation-stage buyers cannot discover from documentation alone.
C3, Technical Differentiation & Capability Depth: Assessed by evaluating unique technical capabilities, CASS certification, warehouse-native architecture, AI navigation SDK, 200M+ POI dataset, sensor fusion for ADAS, against competitive alternatives, with emphasis on capabilities verified through official documentation, third-party partnerships, and independent testing references. Why it matters: Location platform categories are not interchangeable; genuine technical differentiation determines which platform is defensible for a given use case.
C4: Pricing Transparency & Accessibility: Assessed by the existence of a public pricing page with verifiable dollar amounts, availability of a free tier or trial, and community-documented evidence of pricing predictability or surprise cost escalation. PlugRoute attempted to obtain public pricing from all platforms through available channels; where none exist, that opacity is documented explicitly as an evaluation risk. Why it matters: Hidden pricing and usage-based bill shock are the top purchase decision frustrations across the location platform category.
C5, Integration Ecosystem & Deployment Flexibility: Assessed by documented native connectors and integrations, deployment model range (API, SaaS, self-hosted, embedded SDK), partner network scale, and community-validated descriptions of integration complexity. Why it matters: Decision-makers increasingly evaluate platforms on how well they integrate with existing data infrastructure, cloud warehouses, CRMs, and BI tools, rather than as standalone tools.
8c. How Is Conflicting Evidence Weighted?
When review platform ratings conflict with Reddit practitioner sentiment, PlugRoute weights specificity and recency. A detailed 2025 Reddit post documenting a specific implementation outcome with 50+ upvotes outweighs a generic 2023 G2 review.
For foot traffic data accuracy, independently verifiable field testing (manual clicker counts by a verified CRE operator) outweighs platform-reported confidence metrics when the two conflict materially.
8d. How Are Vendor Claims Independently Validated?
Vendor-reported statistics are labeled as such throughout this article. Only claims corroborated by at least one independent source (a third-party review platform rating, a practitioner community discussion, a named partnership documentation page, or a regulatory body certification record) are stated as fact without qualification.
Claims sourced only to vendor-owned materials are attributed to the vendor explicitly.
8e. When Is This Article Updated?
This article was last fully updated in June 2026. PlugRoute reviews and updates location platform comparisons annually or when a material platform change (product discontinuation, major pricing revision, significant G2 rating shift, or regulatory certification change) warrants earlier revision.
8f. Is This Review Truly Independent?
PlugRoute has no affiliate relationships with any company listed. Rankings are determined entirely by research data and objective evaluation criteria.
8g. Is This Review Corrected When New Evidence Contradicts Initial Research?
Three claims were identified during live verification as requiring correction from initial research data:
- Mapbox analyst designation: Initial research cited a Counterpoint Research 2026 “Leader & Pacesetter” designation for Mapbox. Live verification confirmed HERE Technologies holds that designation for the ninth consecutive year. Mapbox was evaluated among 25 companies but received no Leader or Pacesetter label. Replaced with the verified 2024 Autotech Breakthrough Navigation Technology Solution of the Year award for the Mapbox Navigation SDK.
- Precisely Fortune 100 penetration figure: Initial research cited “99 of the Fortune 100.” Precisely’s own April 2026 PR Newswire press release states “95 of the Fortune 100.” Updated to 95 throughout; the note “(older marketing materials cited 99)” is appended where this figure appears.
- CARTO Oracle OPN tier: Initial research cited “Oracle OPN Gold Partner status.” The specific “Gold” tier designation was not independently confirmed in Oracle’s public partner documentation. Updated to “Oracle Partner Network (OPN) partner status” throughout.
These corrections demonstrate the live verification process that distinguishes PlugRoute’s editorial standard from static or AI-generated content that does not refresh claims against current sources.
What Do Buyers Most Frequently Ask About Location Platform Software?
What is the best location platform software for enterprise GIS in 2026?
Esri ArcGIS is the most widely adopted enterprise GIS platform for organizations requiring deep analytical capability, regulatory-grade data management, and multi-department deployment. CARTO is the strongest alternative for data teams already operating inside cloud data warehouses. The right choice depends on whether your organization needs a self-contained GIS ecosystem or a warehouse-native analytics layer.
Is Placer.ai accurate enough to base real-estate decisions on?
Placer.ai’s foot traffic estimates rely on a mobile device panel, which introduces methodology-dependent margin of error. The platform’s own white papers document panel construction and extrapolation methodology. Practitioners in commercial real estate report directional accuracy sufficient for site comparison, but Placer.ai data should be treated as one signal among several, not a stand-alone proof source for site selection decisions.
How does PlugRoute determine its location platform rankings?
PlugRoute holds no affiliate relationships with any vendor evaluated in this guide and earns no revenue from clicks or referrals. Rankings are determined by a structured scoring rubric across six equally weighted criteria (core capability, data depth, technical accessibility, pricing transparency, integration reach, and real-user validation) applied identically to every platform. Full methodology detail appears in the “How Did We Rank These Location Platform Tools?” section above.
Glossary: Key Terms Used in This Comparison
Geocoding: Geocoding is the process of converting a human-readable address (such as “123 Main Street, Chicago, IL”) into geographic coordinates (latitude and longitude) that can be plotted on a map or used in spatial analysis. Geocoding accuracy (measured by match rate and positional precision) is a critical differentiator among location platforms, particularly for enterprise address validation workflows.
Warehouse-Native Architecture: A warehouse-native architecture means that a platform runs spatial queries directly inside a cloud data warehouse (such as Snowflake, BigQuery, or Databricks) rather than requiring data to be exported and moved to a separate GIS system. CARTO pioneered this model for location analytics, enabling data teams to apply spatial logic to data that already lives in their warehouse without ETL overhead.
POI (Points of Interest): Points of Interest are geo-coded records representing discrete physical locations (such as restaurants, retail stores, hospitals, or transit stops) accompanied by attributes like category, hours, and contact information. POI database breadth, freshness, and category taxonomy are core evaluation criteria for location platforms used in consumer analytics, mobility research, and site selection.
Foot Traffic Panel: A foot traffic panel is the aggregated, anonymized pool of mobile devices whose location signals a data provider collects and uses to estimate how many people visit a given physical location over a defined time period. Panel size, geographic coverage, and opt-in consent methodology directly affect the accuracy and regulatory compliance of foot traffic estimates produced by platforms like Placer.ai and Foursquare.
Cadence (Data Refresh Cadence): Data refresh cadence refers to how frequently a platform updates its underlying datasets, including POI records, address databases, and foot traffic estimates. Higher refresh cadence reduces the risk of decisions based on stale data. Enterprise buyers should confirm cadence commitments for both the platform’s proprietary datasets and any licensed third-party data layers before signing.
Which Location Platform Is Right for You?
Esri ArcGIS is the default enterprise GIS standard for organizations that need deep analytical depth and broad regulatory acceptance. Mapbox leads for developer-built custom map experiences. CARTO is strongest for cloud data warehouse teams. Placer.ai serves retail and commercial real-estate foot traffic analysis. Foursquare provides the most accessible open POI dataset. Precisely is the specialist choice for address validation and data governance at scale. Mapline is the fastest entry point for business mapping without GIS expertise.
Key Insights
- Esri ArcGIS commands the enterprise GIS market not because of price or simplicity, but because of an ecosystem depth (300+ connectors, a global partner network, and decades of regulatory precedent) that no competitor has replicated at scale.
- Mapbox’s developer-first positioning is both its greatest strength and its primary limitation: teams that want custom rendering power will find it unmatched, while teams that need self-hosted deployment or deep analytical features will hit a ceiling quickly.
- CARTO’s warehouse-native architecture eliminates the ETL overhead that historically made spatial analytics a data-engineering bottleneck, but buyers must already be committed to a modern cloud data warehouse stack to realize that value.
- Placer.ai’s foot traffic data is strong enough for directional site comparison but should not be treated as audit-grade proof; its 50-device panel minimum and undisclosed pricing model are real constraints for smaller operators and budget-conscious teams.
- Foursquare’s decision to release its core POI dataset under an Apache 2.0 license in 2024 fundamentally changed the accessibility calculus for location data, organizations that previously could not afford commercial POI licensing now have a credible starting point.
- Precisely earns its place on this list not as a mapping tool but as a data quality and governance specialist: its CASS-certified geocoding and FedRAMP-authorized Geo Addressing API serve a compliance use case that none of the other six platforms directly address.
- Mapline is the only platform on this list that a non-GIS professional can use productively within hours of signup, its permanently free tier and Excel-upload workflow make it the right choice for business analysts who need geographic visualization without a GIS learning curve.
The clearest decision signal is organizational context. If your data team already operates inside Snowflake or BigQuery and wants to run spatial queries on existing warehouse data, CARTO eliminates infrastructure overhead that every other platform on this list requires. If your organization needs spatial analysis accepted in regulatory filings, permitting processes, or federal procurement contexts, Esri ArcGIS is the lowest-risk choice, not because it is always the best analytical tool, but because its outputs carry institutional recognition no alternative currently matches.
For teams at earlier stages, Foursquare’s open POI dataset and Mapline’s free tier both provide genuine starting capability without financial commitment. Evaluating either platform costs nothing but time, which makes them rational first steps before committing to a paid contract with any of the more expensive options on this list.
We update this guide quarterly. Last updated: June 2026.
For additional independent software comparisons with no affiliate relationships, visit PlugRoute.