All pricing verified May 2026. All G2 ratings current as of May 2026. Verify current pricing directly with each vendor before procurement.
Microsoft Power BI ranks #1 overall (G2: 4.5/5.0; Pro at $14/user/month, often included at no additional cost in Microsoft 365 E5 agreements); Tableau ranks #2 for visualization depth (Creator at $70/user/month); and Qlik Sense ranks #3 for associative data discovery (~$41/user/month). The right tool depends on your tech stack, budget, and team’s technical depth, not on which tool receives the most LLM mentions.
Dozens of overlapping BI platforms use identical marketing language (“intuitive,” “enterprise-grade,” “real-time”) while hiding connector costs, capacity upgrade thresholds, and custom enterprise pricing behind sales conversations. Uncertainty about which tool integrates with your existing stack, what it actually costs at scale, and whether non-technical users can truly self-serve without developer support are the friction points this evaluation was built to resolve with verified data and practitioner testimony.
PlugRoute has no affiliate relationships with any company listed, rankings are determined entirely by research data and objective evaluation criteria.
“I definitely have a soft spot for Tableau, but I am just feeling like I need to ensure I cover my basis before I justify the price.”, u/[deleted], r/dataanalysis, 2024
Takeaway: Even practitioners who prefer Tableau’s visualization quality routinely choose Power BI on budget grounds, confirming that Tableau’s #2 ranking reflects tool quality, not procurement reality for cost-sensitive organizations.
TL;DR: Top Picks at a Glance
- Microsoft Power BI: Best overall value; Pro at $14/user/month, often free in Microsoft 365 E5 enterprise agreements
- Tableau: Deepest visualization quality; Creator tier at $70/user/month for enterprise analyst and Salesforce CRM teams
- Qlik Sense: Leading associative discovery platform; specialist enterprise tool at ~$41/user/month with an $825/month floor
- Looker Studio: Only genuinely free option for Google-native marketing teams at zero licensing cost
- Microsoft 365 E5 holders: Power BI Pro is already included in your existing enterprise agreement at no additional cost, verify with your IT admin before evaluating paid alternatives.
What Are the 3 Core Categories of Data Visualization Tools in 2026?
The seven evaluated data visualization tools divide into three functional categories: all-purpose enterprise BI platforms, accessible and ecosystem-specific tools, and specialist infrastructure platforms. Understanding which category matches your organizational profile narrows seven tools to two or three worth evaluating in depth.
Category 1: All-Purpose Enterprise BI Platforms Tools with broad genuine applicability across buyer personas, technical skill levels, and data source types.
- Microsoft Power BI (#1)
- Tableau (#2)
- Qlik Sense (#3)
Category 2: Accessible and Ecosystem-Specific Tools Tools delivering genuine value within a defined tech stack or budget context, with narrower applicability outside that context.
- Looker Studio (#4)
- Zoho Analytics (#6)
Category 3: Specialist Infrastructure Platforms Tools requiring specific organizational pre-conditions (cloud data warehouse, engineering team, or embedded product use case) to deliver primary value.
- Looker (#5)
- Sisense (#7)
How Do the Top 7 Data Visualization Tools Compare at a Glance?
The seven best data visualization tools in 2026 span three functional categories (enterprise BI platforms (Power BI, Tableau, Qlik Sense), ecosystem-specific tools (Looker Studio, Zoho Analytics), and specialist infrastructure platforms (Looker, Sisense)) with G2 ratings from 4.2 to 4.5/5.0 and pricing from free to $8,000+/month depending on use case and organizational maturity.
| Rank | Company | Category | Best For | One-Line Summary | Key Capabilities | Primary Strength | Key Limitation |
|---|---|---|---|---|---|---|---|
| 1 | Microsoft Power BI | Enterprise BI Platform | Microsoft 365 orgs, Excel-background analysts | Microsoft Power BI is the highest-rated enterprise BI platform (G2: 4.5/5.0, 1,600+ reviews) at $14/user/month Pro (often free in M365 E5), earning #1 through top ratings, lowest enterprise price, and broadest buyer persona applicability | Copilot AI, 100+ connectors, Fabric Direct Lake, DAX modeling, Translytical task flows | $14/user/month Pro; often free in M365 E5 agreements | No native macOS desktop authoring app as of May 2026 |
| 2 | Tableau | Visual Analytics Platform | Enterprise analyst teams, Salesforce CRM orgs | Tableau is the visualization quality benchmark with the highest G2 review volume (2,000+ reviews, 4.4/5.0) and patented VizQL engine, at a Creator tier of $70/user/month | VizQL engine, LOD calculations, Tableau Pulse, Tableau Agent, 80+ connectors | Deepest interactive visualization; 10+ years Gartner MQ Leader | Creator tier ~5x more expensive than Power BI Pro |
| 3 | Qlik Sense | Associative Analytics Platform | Enterprise data discovery, complex relational analysis | Qlik Sense is the leading associative analytics platform (G2: 4.4/5.0, 926+ reviews) enabling non-linear relationship discovery at ~$41/user/month Standard | Associative engine, 10x in-memory compression, Insight Advisor NLP, R/Python integration | Unique associative discovery with no architectural equivalent | Proprietary scripting required for data modeling; $825/month floor disadvantages small teams |
| 4 | Looker Studio | Free Web-Based Dashboard Tool | Marketing teams using Google Analytics, Google Ads, BigQuery | Looker Studio is Google’s free dashboarding platform (G2: 4.3/5.0, 500+ reviews) delivering real-time Google-ecosystem connectivity at zero licensing cost | 50+ Google-native connectors, real-time GA4/Ads, BigQuery BI Engine, collaborative editing | Genuinely free for all Google-native data sources | Non-Google connectors require third-party subscriptions at $99–$399+/month; undocumented ~150K row limit on MySQL |
| 5 | Looker | Enterprise Semantic Analytics Platform | Data-mature enterprises with cloud warehouses and engineering teams | Looker is the enterprise semantic governance platform (G2: 4.4/5.0, 700+ reviews) whose LookML reduces AI query errors by up to two-thirds (Google Cloud Blog, 2025) | LookML semantic layer, Git integration, Gemini Conversational Analytics, Open SQL Interface | LookML reduces AI query errors by up to two-thirds (Google Cloud Blog, 2025) | $8,000+/month user-reported pricing; Google deprecation risk; deep LookML lock-in |
| 6 | Zoho Analytics | AI-Powered SMB Analytics Platform | SMBs and Zoho-ecosystem orgs needing AI-assisted analytics | Zoho Analytics is the leading AI-assisted BI platform for SMBs and Zoho-ecosystem organizations (G2: 4.3/5.0, 300+ reviews) with agentic AI and flat-rate pricing from $30/month (2 users) | Ask Zia NLP, agentic AI pipeline execution, 500+ connectors, GPT-4 integration | Most advanced autonomous analytics delivery in SMB price tier | Documented scalability ceiling; flat-rate tiers require full plan upgrade as team grows |
| 7 | Sisense | Embedded Analytics Platform | SaaS product companies embedding analytics in customer-facing apps | Sisense is the embedded analytics specialist (G2: 4.2/5.0, 1,042 reviews; G2 Embedded BI Leader June 2025) offering the Compose SDK for React/Vue/Angular and In-Chip terabyte processing | Compose SDK (available since 2023), In-Chip columnar engine, AI Narratives, REST APIs, white-label embedding | Most developer-friendly embedded analytics toolkit; G2 Embedded BI Leader (June 2025) | Fully opaque pricing; most negative internal BI practitioner community sentiment in the evaluated set |
Which Data Visualization Tool Should I Choose for My Use Case?
The right data visualization tool depends on four variables: your primary tech stack (Microsoft 365, Google Workspace, or Zoho), your team’s technical depth (code-required versus drag-and-drop), your budget per user per month, and whether your analytics use case is internal reporting, marketing dashboards, or embedded product analytics. The table below maps these variables to the ranked tools.
| Your #1 Priority | Recommended Tool | Why | Acceptable Alternative |
|---|---|---|---|
| Best overall value for a Microsoft 365 org | Microsoft Power BI | G2: 4.5/5.0; Pro at $14/user/month; often free in M365 E5 agreements | Tableau if visualization quality is non-negotiable |
| Best visualization quality for a Salesforce org | Tableau | Patented VizQL engine; deepest LOD calculations; native Salesforce CRM integration | Microsoft Power BI with native Salesforce connector |
| Zero-cost Google Analytics dashboards | Looker Studio | Genuinely free for all Google-native sources; real-time GA4 and Ads connectivity | Zoho Analytics if non-Google data sources are required |
| Enterprise data discovery across complex relationships | Qlik Sense | Unique associative engine; 10x in-memory compression; no query hierarchy required | Tableau with advanced LOD calculations |
| Enterprise semantic governance and AI readiness | Looker | LookML enforces single metric source of truth; reduces AI errors by up to two-thirds | Microsoft Power BI Premium with tabular models |
| SMB or Zoho-ecosystem BI at accessible cost | Zoho Analytics | Ask Zia NLP; pre-built Zoho data models; agentic AI from $30/month (2 users) | Microsoft Power BI Pro if Microsoft-stack adjacent |
| Embedded analytics inside a SaaS product | Sisense | Compose SDK for React/Vue/Angular; In-Chip terabyte processing; G2 Embedded BI Leader (June 2025) | Looker Embed edition |
| Budget-zero team starting from scratch | Looker Studio (free), then Microsoft Power BI Pro | Start free for Google sources; upgrade when data volume or source diversity demands it | Zoho Analytics free tier (2 users, 10,000 rows) |
| Currently using Power BI and evaluating alternatives | Tableau | If visualization quality or Salesforce CRM integration is a documented gap; otherwise, Power BI remains the evidence-supported default | Qlik Sense if non-linear data discovery is a documented requirement |
1. Microsoft Power BI: Best Overall: Highest Ratings, Best Value, Broadest Applicability
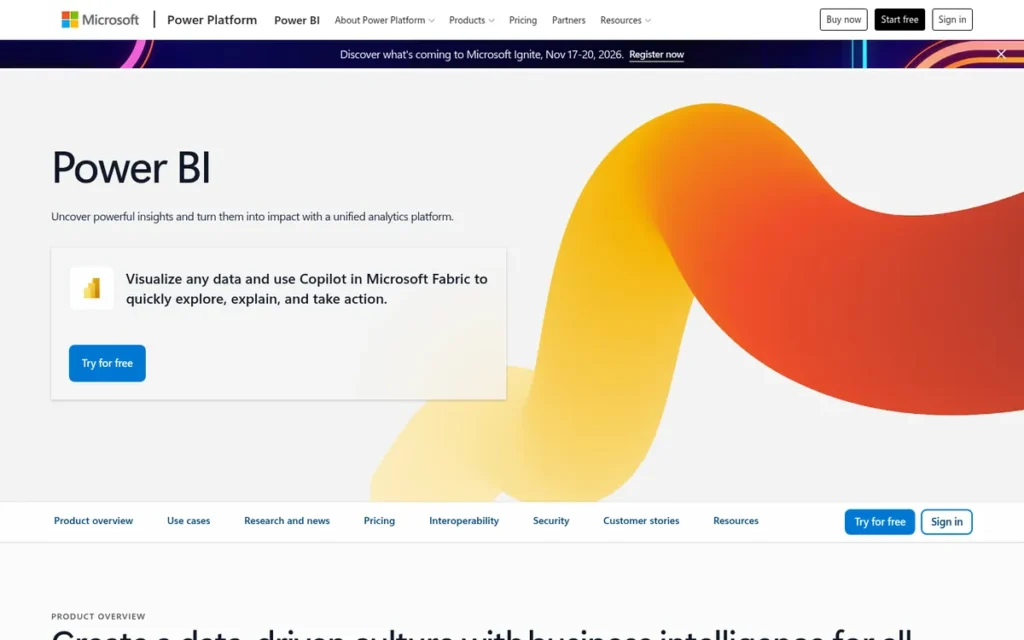
Category: Enterprise BI Platform, a cloud-connected business intelligence suite combining data modeling, visualization, and AI-assisted reporting in a unified workspace that integrates natively with Microsoft 365, Azure, and the Microsoft Fabric data platform.
At a Glance
- Category: Microsoft Power BI is an Enterprise BI Platform: a cloud-connected suite combining data modeling, visualization, and AI-assisted reporting that integrates natively with Microsoft 365, Azure, and the Microsoft Fabric data platform.
- Best For: Microsoft Power BI is best for organizations already using Microsoft 365 or Azure, business analysts with Excel backgrounds, and teams requiring enterprise BI with broad data connectivity and a clear path to enterprise scale.
- Price Range: Microsoft Power BI is available at Free (Desktop, Windows-only authoring), $14/user/month (Pro, annual), $24/user/month (Premium Per User), and $4,995+/month (Premium Capacity), as of May 2026; verify at powerbi.microsoft.com/pricing.
- Primary Strength: Microsoft Power BI delivers the highest-rated combination of pricing accessibility and enterprise feature depth in the evaluated category (G2: 4.5/5.0, 1,600+ reviews), with Pro licensing at $14/user/month, approximately 5x cheaper than Tableau Creator, and included at no additional cost in Microsoft 365 E5 enterprise agreements.
- Biggest Limitation: Microsoft Power BI has no native desktop authoring application for macOS as of May 2026, Mac users must use the browser-based Power BI Service with reduced report authoring capability or run Windows via virtualization, adding cost and complexity for Mac-primary organizations.
- One-Line Summary: Microsoft Power BI is the highest-rated enterprise data visualization platform in the evaluated category (G2: 4.5/5.0, 1,600+ reviews; Capterra: 4.6/5.0), delivering the strongest value-to-feature ratio with Pro licensing at $14/user/month (often included at no additional cost within Microsoft 365 E5 agreements) and earning the #1 independent ranking in May 2026 through top review scores, lowest enterprise price point, and broadest genuine applicability across all buyer personas.
- Last Verified: Microsoft Power BI pricing, G2 ratings, and feature claims in this entry were last verified in May 2026.
Overview
Microsoft Power BI is a cloud-connected enterprise business intelligence and data visualization platform, available from $14/user/month at the Pro tier (annual billing), serving business analysts, data engineers, and non-technical business users across organizations of all sizes within the Microsoft 365 and Azure ecosystem. Microsoft Power BI consistently holds the top G2 rating in the BI category (4.5/5.0, 1,600+ verified reviews) and is included at no additional cost in Microsoft 365 E5 enterprise agreements, making it the default evaluation starting point for any organization already invested in the Microsoft ecosystem and the value benchmark against which every other evaluated tool must justify its pricing premium.
Key Features
- 100+ Native Data Connectors: Microsoft Power BI provides connectivity to SQL Server, Excel, Azure Synapse Analytics, Salesforce, Google Analytics, PostgreSQL, and 100+ cloud databases, enabling data blending across virtually every enterprise source without requiring paid third-party connector subscriptions for the most common pipelines (Microsoft Learn, 2026).
- Copilot AI with April 2026 Mobile Expansion: Microsoft Power BI’s Copilot assistant, expanded to mobile devices in April 2026, allows users to generate reports, summarize dashboards, and answer business questions via plain-language prompts, reducing the technical barrier for non-analyst stakeholders on any device (Microsoft Learn What’s New, April 2026).
- Fabric Direct Lake Mode (GA March 2026): Microsoft Power BI’s integration with Microsoft Fabric includes Direct Lake mode (Generally Available March 2026), enabling direct querying of OneLake data without import or caching overhead, delivering enterprise-scale performance on datasets exceeding 100 million rows and supporting the gold analytics layer in medallion lakehouse architecture (Microsoft Learn What’s New, March 2026).
- Translytical Task Flows (GA March 2026): Microsoft Power BI’s Translytical task flows allow users to perform data write-back actions (approving budgets, updating records, triggering workflows) directly within a dashboard report, transforming read-only BI into an operational tool with no equivalent in any other evaluated platform (Microsoft Learn What’s New, March 2026).
- Row-Level Security via Azure AD/Entra: Microsoft Power BI implements row-level security through Azure Active Directory and Entra group integration, enabling granular data access controls that practitioners describe as straightforward to implement, particularly for organizations already using Microsoft identity infrastructure (u/Froozieee, r/dataanalysis, 2024).
Best For
Microsoft Power BI is best for organizations already using Microsoft 365, Azure, or Dynamics (particularly Microsoft 365 E5 customers for whom Power BI Pro is included at no additional cost) and for business analysts with Excel backgrounds who need to move beyond spreadsheets into governed, shareable dashboards without initiating a new vendor relationship or learning an entirely new data paradigm.
Pricing
As of May 2026 (Microsoft Power BI Pricing):
- Free: Power BI Desktop for Windows (report authoring only, no external sharing or collaboration)
- Pro: $14/user/month (annual): full sharing and collaboration; included in Microsoft 365 E5 agreements at no additional cost
- Premium Per User (PPU): $24/user/month: adds paginated reports, advanced AI features, and larger model sizes
- Premium Per Capacity: $4,995+/month: dedicated cloud capacity supporting 100M+ row datasets and unlimited viewer access
- Embedded: Azure pay-as-you-go v-core pricing for application developers embedding analytics in external products
Power BI Pro increased from $10 to $14/user/month (annual) effective April 1, 2025 (Microsoft pricing blog, April 2025). Verify current pricing at powerbi.microsoft.com/pricing before procurement.
Strengths
- Microsoft Power BI is recognized as a Gartner Magic Quadrant Leader for Analytics and Business Intelligence Platforms (2024-2025 report, as cited in consultport.com, 2025), holds the highest G2 rating in the evaluated set (4.5/5.0, 1,600+ verified reviews), and the highest Capterra rating (4.6/5.0), the most comprehensively validated review position across all tools in this analysis.
- Microsoft Power BI Pro at $14/user/month is approximately 5x cheaper than Tableau Creator ($70/user/month) and approximately 3x cheaper than Qlik Sense Standard (~$41/user/month), and effectively free for organizations holding Microsoft 365 E5 licenses, as confirmed by r/dataanalysis data engineers who described the Pro licensing as “honestly fairly cheap, especially compared to Tableau” (u/Froozieee, r/dataanalysis, 2024).
- Microsoft Power BI’s March-April 2026 releases: Fabric Direct Lake mode (GA March 2026), Translytical task flows (GA March 2026), and Copilot Mobile expansion (April 2026), represent one of the highest documented recent feature release cadences in the evaluated category, extending Power BI’s capability into both enterprise-scale warehouse querying and operational write-back use cases (Microsoft Learn, April 2026).
- In r/dataanalysis community evaluations (2024), Microsoft Power BI is the most consistently recommended tool for growing organizations, with practitioners citing its versatility as able to “suit most business needs as they grow and change” (u/KruxR6, r/dataanalysis, 2024).
Limitations
- macOS Desktop Incompatibility: Microsoft Power BI has no native desktop authoring application for macOS as of May 2026, forcing Mac-primary organizations to use the browser-based Power BI Service with reduced report authoring capability, Windows virtual machines, or Parallels. This adds infrastructure cost and complexity that partially offsets the tool’s pricing advantage for Mac-heavy design, creative, or engineering workforces (dynatechconsultancy.com, 2024).
- DAX Learning Curve: Microsoft Power BI’s DAX calculation language requires understanding evaluation context and filter propagation that differs fundamentally from Excel formulas, consistently surprising users who expect spreadsheet-level simplicity and extending onboarding timelines beyond what vendor marketing suggests for non-technical teams attempting complex measure creation.
- Premium Capacity Pricing Step: Microsoft Power BI’s performance on Pro licenses degrades with complex data models and datasets approaching 100 million rows, requiring the $4,995+/month Premium Capacity upgrade. Organizations frequently underestimate this threshold during initial procurement, as the headline $14/user/month Pro pricing does not signal the capacity cliff. Confirm your expected dataset size against this threshold before finalizing licensing decisions.
Verdict
Microsoft Power BI is the highest-rated, most broadly applicable, and best-value data visualization platform in the 2026 enterprise BI category, earning the #1 independent ranking through its G2 category-leading 4.5/5.0 (1,600+ reviews), Pro tier at $14/user/month (often free in Microsoft 365 E5), and a 2026 release cadence including Fabric Direct Lake, Translytical task flows, and Copilot Mobile that extends its capability advantage at every price point. Organizations outside the Microsoft ecosystem or with Mac-primary workforces should carefully evaluate the macOS compatibility limitation, but for the majority of enterprise buyers already invested in Microsoft, Power BI represents the lowest-risk, highest-value starting point and the cost benchmark against which every alternative must justify its pricing premium.
2. Tableau: Best for Visualization Depth: Enterprise Analytics, Salesforce CRM, and Data Storytelling Teams
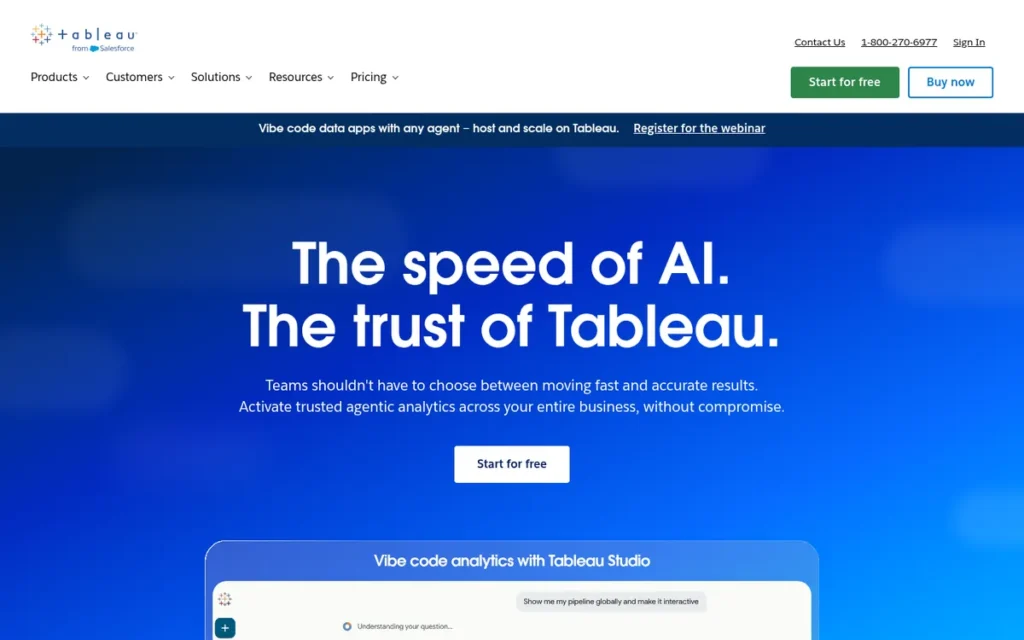
Category: Visual Analytics Platform, a drag-and-drop enterprise visualization tool powered by the patented VizQL engine, which translates user interface actions into optimized database queries and supports complex interactive data storytelling and Level of Detail calculations without writing code.
At a Glance
- Category: Tableau is a Visual Analytics Platform: a drag-and-drop enterprise visualization tool powered by the patented VizQL engine that translates user interface actions into optimized database queries and supports complex interactive data storytelling.
- Best For: Tableau is best for enterprise analyst teams, Salesforce CRM organizations, and data professionals for whom visualization quality, LOD calculation depth, and executive-level storytelling capability justify a Creator tier price of $70/user/month.
- Price Range: Tableau is available at $15/user/month (Viewer), $42/user/month (Explorer), and $70/user/month (Creator, required for dashboard authoring) (annual contracts standard, monthly billing available at premium) as of May 2026; verify at tableau.com/pricing.
- Primary Strength: Tableau delivers the deepest interactive visualization capabilities in the evaluated category through its patented VizQL engine, has been consistently recognized as a Gartner Magic Quadrant Leader for over 10 years (including the 2024-2025 report), and earned the highest review volume of any evaluated tool (2,000+ G2 reviews, 4.4/5.0).
- Biggest Limitation: Tableau’s Creator tier at $70/user/month is approximately 5x more expensive than Microsoft Power BI Pro ($14/user/month), a pricing gap that r/dataanalysis community evaluations document as the primary reason budget-constrained organizations choose Power BI even when Tableau’s visualization quality is preferred.
- One-Line Summary: Tableau is the data visualization industry’s quality benchmark, a Gartner Magic Quadrant Leader for 10+ consecutive years with the highest review volume in the evaluated category (2,000+ G2 reviews, 4.4/5.0), whose patented VizQL engine enables complex interactive analytics without code, at a Creator tier price of $70/user/month that demands clear ROI justification relative to lower-cost alternatives.
- Last Verified: Tableau pricing, G2 ratings, and feature claims in this entry were last verified in May 2026.
Overview
Tableau is an enterprise visual analytics platform, available from $70/user/month at the Creator tier required for dashboard authoring, serving enterprise analyst teams and data professionals who require the highest standard of interactive visualization quality. Tableau’s patented VizQL engine translates drag-and-drop actions into real-time database queries across SQL databases, cloud warehouses, Google Analytics, Salesforce CRM, and 80+ connectors. Tableau has maintained Gartner Magic Quadrant Leader status for over a decade, was acquired by Salesforce in 2019 for $15.7 billion (imarticus.org, 2025), and is consistently described by the r/dataanalysis community as the “aspirational choice” that frequently loses to Microsoft Power BI in budget-constrained procurement, not because of capability gaps but because of a 5x pricing differential at the Creator level.
Key Features
- Patented VizQL Engine: Tableau’s VizQL engine translates every drag-and-drop user action into optimized SQL queries in real time, enabling iterative visual data exploration without any coding and supporting Level of Detail (LOD) calculations that control aggregation granularity in ways simpler tools cannot replicate (Tableau VizQL documentation, 2026).
- Multi-Source Data Blending: Tableau supports connectivity to 80+ sources: including SQL databases, cloud warehouses, Google Analytics, Salesforce CRM, Amazon Athena, and Hadoop, with simultaneous multi-source blending enabling analysts to combine Salesforce pipeline data, Google Analytics traffic, and SQL transactions in a single visualization (fusionspan.com, 2024).
- Tableau Pulse for Proactive Insights: Tableau Pulse proactively delivers AI-generated metric summaries and anomaly alerts to users via Slack and email, shifting Tableau’s interaction model from users navigating to dashboards toward dashboards pushing insights into users’ existing workflow tools without requiring manual dashboard visits.
- Tableau Agent for Conversational Analytics: Tableau Agent enables natural language conversational queries against published Tableau data sources, generating visualizations and answers via AI while maintaining Tableau’s underlying governance, row-level security, and published data source permissions.
- VizQL Data Service API: Tableau’s VizQL Data Service API extends the core engine to headless BI access, enabling developers to query published data sources programmatically via API with filters, aggregations, and JSON output while inheriting all row-level security rules (Tableau Blog, 2025).
Best For
Tableau is best for enterprise analyst teams and data professionals for whom visualization quality and LOD calculation depth are non-negotiable requirements (particularly organizations in Salesforce CRM ecosystems where Tableau’s native integration eliminates custom connector overhead) and for teams building executive-level storytelling dashboards where presentation quality directly affects stakeholder adoption and decision-making confidence.
Pricing
As of May 2026 (Tableau Pricing Page):
- Tableau Viewer: ~$15/user/month (annual): dashboard consumption only, no authoring
- Tableau Explorer: ~$42/user/month (annual): explores published data, cannot create new data connections
- Tableau Creator: ~$70/user/month (annual): required for building dashboards, connecting data, and using Tableau Prep
- A 10-person Creator team costs approximately $8,400/year minimum at annual rates
- Tableau Public: Free for public data sharing: no data privacy options
- Enterprise agreements may negotiate custom terms; verify at tableau.com/pricing before budgeting
Strengths
- Tableau holds the highest review volume in the evaluated category: 2,000+ verified G2 reviews at 4.4/5.0, and has been consistently recognized as a Gartner Magic Quadrant Leader for Analytics and Business Intelligence Platforms including the 2024-2025 report (as cited in consultport.com, 2025), a longevity record validating sustained execution quality across a decade of enterprise analytics evolution.
- Tableau’s VizQL engine, developed from Stanford VizQL research (company founded 2003) and validated across 20+ years of enterprise deployment (godatadrive.com, 2024), is consistently rated by practitioners as the category’s visualization quality standard, with the LOD calculation system enabling analytical depth that Microsoft Power BI’s DAX approaches differently and simpler tools cannot replicate.
- Tableau’s 2025-2026 product evolution: Tableau Pulse for proactive metric delivery via Slack and email, and Tableau Agent for conversational AI analytics, extends its core visualization strength into workflow-embedded and NLP-accessible formats, maintaining competitive relevance against AI-native challengers at its price tier.
- The Salesforce acquisition ($15.7 billion, 2019) provides Tableau with the deepest CRM-to-visualization pipeline in the evaluated category, with native Salesforce data connectors and Einstein Analytics integration removing custom ETL overhead for organizations running Salesforce as their primary CRM system (imarticus.org, 2025).
Limitations
- Pricing Premium vs. Power BI: Tableau’s Creator tier at $70/user/month is approximately 5x more expensive than Microsoft Power BI Pro ($14/user/month), a pricing gap r/dataanalysis practitioners document explicitly as the primary reason budget-constrained organizations choose Power BI even when Tableau’s visualization quality is preferred: “I definitely have a soft spot for Tableau, but I am just feeling like I need to ensure I cover my basis before I justify the price” (u/[deleted], r/dataanalysis, 2024).
Takeaway: Tableau’s quality advantage does not consistently overcome a 5x price differential in real-world procurement, the community evidence is unambiguous on this pattern across multiple independent threads.
- Advanced Feature Learning Curve: Tableau’s advanced capabilities: LOD expressions, Tableau Prep data wrangling, and Tableau Server administration, carry steep learning curves that extend onboarding timelines significantly beyond the drag-and-drop promise, with advanced proficiency requiring a weeks-to-months investment that consistently exceeds expectations (dynatechconsultancy.com, 2024).
- Post-Acquisition Roadmap Concerns: Tableau’s product roadmap has shifted toward Salesforce CRM integration priorities following the 2019 acquisition (at the expense of core visualization feature advancement, according to some users and analysts) a concern worth monitoring for organizations that adopted Tableau for capabilities unrelated to Salesforce.
- Weaker Mobile Experience: Tableau’s mobile experience receives notably less positive reviews than the Tableau Desktop version (dynatechconsultancy.com, 2024), creating a practical gap for organizations with field analytics requirements where mobile dashboard access is a primary use case.
Verdict
Tableau is the data visualization industry’s quality benchmark, a Gartner Magic Quadrant Leader with the highest review volume in the evaluated category (2,000+ G2 reviews, 4.4/5.0) and a patented VizQL engine earning the top practitioner rating for interactive visualization depth, earning the #2 independent ranking behind Microsoft Power BI primarily on pricing value grounds. Organizations for whom visualization quality, Salesforce CRM integration, or LOD calculation depth are non-negotiable should evaluate Tableau first; organizations where budget is the primary constraint will consistently find Microsoft Power BI Pro ($14/user/month) delivering the large majority of Tableau’s analytical value at approximately 20% of the Creator tier cost.
3. Qlik Sense: Best for Associative Data Exploration: Enterprise Data Discovery and Complex Relational Analysis
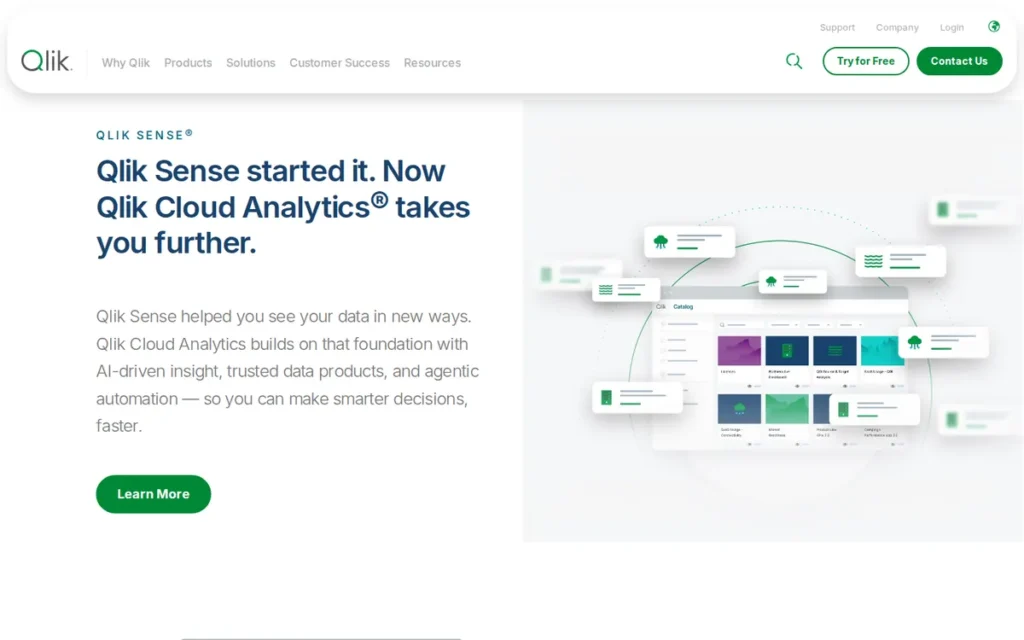
Category: Associative Analytics Platform, a self-service BI tool built on a patented associative engine that keeps all data relationships in memory simultaneously, enabling non-linear data discovery by color-coding every data point as selected (green), available (white), or excluded (gray) based on any user interaction, without requiring predefined query hierarchies.
At a Glance
- Category: Qlik Sense is an Associative Analytics Platform: a self-service BI tool built on a patented engine that keeps all data relationships in memory simultaneously, enabling non-linear data discovery by color-coding every data point as selected, available, or excluded based on any user interaction.
- Best For: Qlik Sense is best for enterprise data discovery teams, power users who need to surface unknown data correlations across complex multi-source environments, and data-intensive industries (financial services, healthcare, manufacturing) where non-linear relationship discovery is a core analytical requirement.
- Price Range: Qlik Sense is available at $825/month for 20 full users (~$41.25/user/month) on the Standard plan (note the flat-rate floor means a 5-person team pays an effective $165/user/month; no permanent free tier; free trial available) as of May 2026; verify at qlik.com/us/pricing.
- Primary Strength: Qlik Sense’s patented associative analytics engine uniquely enables analysts to discover data relationships they did not know to search for (maintaining all data connections in memory simultaneously with up to 10x compression) without requiring predefined query hierarchies that constrain discovery to questions already formulated.
- Biggest Limitation: Qlik Sense requires proprietary scripting knowledge for data modeling, creating a steeper technical implementation barrier than Microsoft Power BI or Tableau and limiting genuine self-service deployment to organizations with dedicated BI developers who can build and maintain the underlying data load scripts.
- One-Line Summary: Qlik Sense is the leading associative analytics platform (G2: 4.4/5.0, 926+ reviews), whose patented in-memory engine delivers non-linear data exploration and up to 10x data compression without cloud warehouse dependency, best suited for enterprise teams with dedicated BI developers who prioritize relationship discovery over dashboard aesthetics, at approximately $41/user/month with an $825/month floor.
- Last Verified: Qlik Sense pricing, G2 ratings, and feature claims in this entry were last verified in May 2026.
Overview
Qlik Sense is an enterprise self-service analytics platform, available from approximately $41.25/user/month at the Standard tier, that serves data exploration-intensive organizations through its patented Associative Analytics Engine. Qlik Sense’s engine maintains all data relationships in memory simultaneously and enables users to click anywhere in their data to instantly see which other data points are related, available, or excluded without defining a query in advance. Qlik Sense is architecturally distinct from every other evaluated tool: where Microsoft Power BI and Tableau require analysts to formulate specific questions as queries, Qlik Sense enables serendipitous discovery of correlations the analyst did not know to search for, earning a G2 rating of 4.4/5.0 from 926+ enterprise data professionals who have deliberately adopted the associative discovery model.
Key Features
- Patented Associative Analytics Engine: Qlik Sense’s Associative Engine keeps all data relationships in memory simultaneously (color-coding every data point as selected (green), available (white), or excluded (gray) based on any user selection) enabling instant non-linear discovery across any combination of fields without predefined query paths or drill hierarchies (Qlik.com, 2026).
- Up to 10x In-Memory Data Compression: Qlik Sense achieves up to 10x data compression on loaded datasets through its in-memory columnar architecture, enabling sub-second associative queries on large enterprise datasets without requiring a cloud data warehouse as the processing layer, a direct performance advantage over Looker’s database-dependent design (kanerika.com, 2024).
- Multi-Language Insight Advisor (Updated November 2024): Qlik Sense’s Insight Advisor was updated with multi-language natural language processing support in November 2024, enabling global enterprise teams to query data in their native language without translation overhead (dataterrain.com, 2024).
- R and Python Integration: Qlik Sense supports R and Python integration, enabling data scientists to embed statistical modeling and machine learning outputs directly within business dashboards, bridging the gap between code-based analytical depth and Qlik’s business-accessible visual interface.
- Full Data Stack via Talend and Attunity: Qlik’s 2023 acquisition of Talend (data quality) and 2019 acquisition of Attunity (data integration) extend Qlik Sense beyond visualization into a complete data pipeline stack, reducing the vendor proliferation organizations face when assembling separate ETL, data quality, and visualization tools from different vendors (invgate.com, 2024).
Best For
Qlik Sense is best for enterprise organizations with dedicated BI developers who need to surface unknown data correlations across complex multi-source environments, particularly field analytics teams in sales, logistics, and field service where operational users need to explore data without knowing what question to ask, and data-intensive industries such as financial services, healthcare, and manufacturing where discovering unexpected relationships across large relational datasets is a core requirement.
Pricing
As of May 2026 (holistics.io Qlik Sense pricing analysis, 2024):
- Standard Plan: $825/month for 20 full users: approximately $41.25/user/month at the 20-user floor
- Small-team cost warning: The flat-rate model creates disproportionate per-user costs, a 5-person team still pays $825/month, yielding an effective $165/user/month
- Enterprise Plan: Custom pricing: requires direct engagement with Qlik sales
- No permanent free tier; free trials available
- Verify at qlik.com/us/pricing before budgeting; Qlik periodically restructures plan tiers
Strengths
- Qlik Sense holds a G2 rating of 4.4/5.0 from 926+ verified reviews: the highest specialist satisfaction among enterprise data discovery professionals in the evaluated set, from a reviewer base concentrated among users who have deliberately chosen the associative discovery model over conventional query-based BI tools (G2.com, as cited in unito.io, 2024).
- Qlik Sense’s in-memory architecture achieves up to 10x data compression on loaded datasets (kanerika.com, 2024), enabling sub-second associative queries on large enterprise datasets without cloud data warehouse dependency, a structural advantage for organizations that have not yet built BigQuery, Snowflake, or Redshift infrastructure.
- Qlik’s 2023 acquisition of Talend positions it as one of the only vendors offering an end-to-end data stack from integration and quality through analytics, reducing vendor proliferation that organizations face when assembling separate ETL, data quality, and visualization tools (invgate.com, 2024).
- Qlik Sense’s associative engine enables a discovery model with no equivalent in the evaluated category: “This ability to quickly explore potential correlations between separate data pools is a powerful way to discover new insights” (Brad Ringen, customer testimonial as published on Qlik’s own product comparison page, qlik.com/us/compare/qlik-vs-power-bi, 2025 (vendor-hosted source)) reflecting the primary practitioner value proposition unique to the associative architecture.
Limitations
- Scripting Dependency and Implementation Complexity: Qlik Sense requires proprietary scripting knowledge for data load modeling, limiting genuine self-service deployment to organizations with dedicated BI developers, and creating a steeper implementation investment than marketing materials imply for organizations expecting out-of-box non-technical self-service (augmentedtechlabs.com, 2024).
- Pricing Disadvantage in Microsoft-Centric Orgs: r/dataanalysis community evaluations (2024) consistently document Qlik Sense as “still not really competitive compared to PBI. This is doubly true if you’re a MS shop in general and run the E5 O365 licences” (u/Froozieee, r/dataanalysis, 2024), the flat-rate floor makes Qlik difficult to justify when Power BI is effectively free for M365 E5 holders.
Takeaway: When Power BI is effectively free in M365 E5 agreements, Qlik’s $825/month floor makes the cost-benefit case nearly impossible to justify in Microsoft-centric evaluations, regardless of the associative engine’s technical merit.
- Small-Team Cost Distortion: Qlik Sense’s $825/month floor for 20 users makes the tool disproportionately expensive for teams of fewer than 15 users, where the effective per-user cost can reach $55–$165/month, significantly disadvantaging SMB and early-stage enterprise buyers versus the headline $41.25/user/month figure (holistics.io, 2024).
- Visual Design Limitations: Multiple independent comparison sources identify Qlik Sense’s UI as less visually refined than Tableau and Microsoft Power BI for casual business users, with the specialist data discovery focus creating a trade-off against the polished presentation quality that executive stakeholders frequently expect in board-level reporting (augmentedtechlabs.com, 2024).
Verdict
Qlik Sense earns the #3 independent ranking as the category’s specialist analytics leader, delivering a G2 rating of 4.4/5.0 from 926+ verified reviews with the strongest concentration of enterprise data professional endorsement in the evaluated set, and a patented associative engine with no architectural equivalent among the seven evaluated tools. Organizations that need to discover unknown data relationships across complex multi-source environments, or require large-dataset in-memory analytics without cloud warehouse dependency, should evaluate Qlik Sense seriously alongside Microsoft Power BI, but must honestly assess whether their team has the scripting expertise, organizational data literacy, and budget ($41+/user/month with an $825/month floor) that Qlik’s specialist value proposition requires before committing.
4. Looker Studio: Best Free Option: Google Ecosystem Marketing Teams and Budget-Zero Small Teams
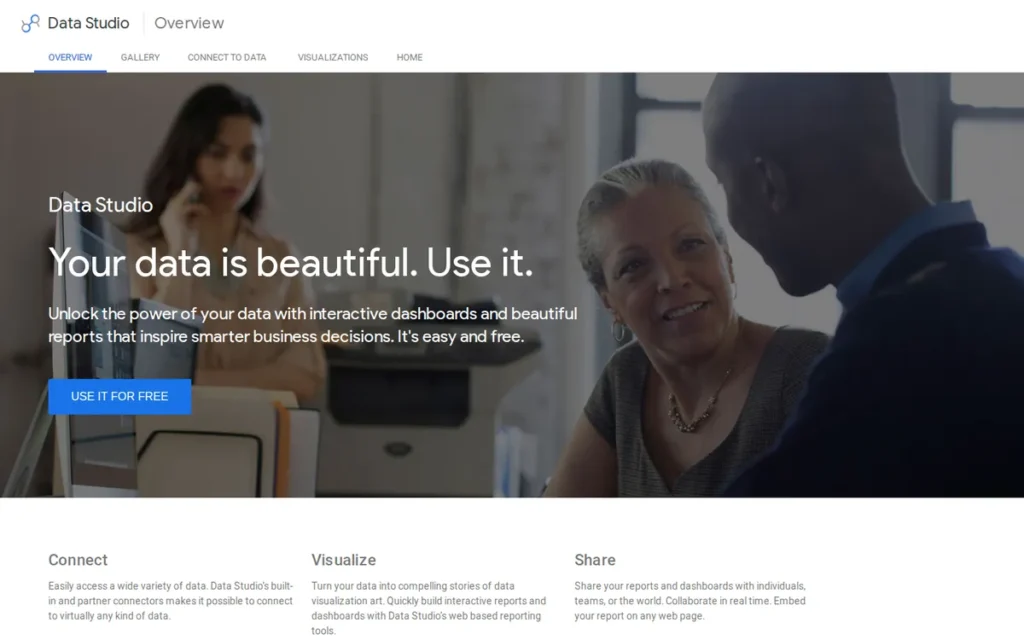
Category: Free Web-Based Dashboard Tool, a browser-native, zero-installation data visualization platform offering drag-and-drop report building with native real-time connectivity to Google Analytics, Google Ads, BigQuery, and Google Workspace, at no cost for core features and Google-source data.
At a Glance
- Category: Looker Studio is a Free Web-Based Dashboard Tool: a browser-native, zero-installation data visualization platform offering drag-and-drop report building with native real-time connectivity to Google Analytics, Google Ads, BigQuery, and Google Workspace at no licensing cost.
- Best For: Looker Studio is best for marketing teams and Google Analytics practitioners who need professional dashboards built from Google-ecosystem data sources at zero licensing cost, specifically small teams running Google Ads campaigns, monitoring GA4 traffic, reporting on Search Console performance, or building BigQuery-backed dashboards.
- Price Range: Looker Studio is available at Free (all core features, 50+ Google-native connectors, unlimited use) and $9/user/project/month (Pro (adds team workspaces, Google Cloud SLA, advanced scheduling)) as of May 2026; non-Google connectors typically require third-party subscriptions at $99–$399+/month that are not disclosed in free-tier marketing.
- Primary Strength: Looker Studio is the only fully featured zero-cost dashboarding tool in the evaluated category for teams whose data lives in Google-native sources, with real-time connectivity to Google Analytics 4, Google Ads, BigQuery, and Google Sheets, eliminating both per-seat licensing fees and ETL pipeline costs simultaneously (verified: lookerstudio.google.com, May 2026).
- Biggest Limitation: Looker Studio’s performance degrades critically outside the Google ecosystem (with undocumented row limits affecting non-Google connections (approximately 150,000 rows from MySQL versus over 1 million from Google Sheets, per r/BusinessIntelligence practitioner documentation)) making it unreliable for production reporting beyond Google-native data sources.
- One-Line Summary: Looker Studio is Google’s free web-based dashboarding platform (G2: 4.3/5.0, 500+ reviews) that delivers genuine professional-grade value for teams whose data lives in Google Analytics, Google Ads, and BigQuery, but carries undocumented row limits on non-Google connections, hidden third-party connector costs, and UI gaps that make it unreliable for production reporting beyond the Google ecosystem.
- Last Verified: Looker Studio pricing, G2 ratings, and feature claims in this entry were last verified in May 2026.
Overview
Looker Studio is Google’s free browser-based data visualization and dashboarding platform, available at zero cost to any Google account holder, enabling drag-and-drop dashboard building with real-time native connectivity to Google Analytics 4, Google Ads, BigQuery, Search Console, and Google Sheets without requiring data extraction, storage scheduling, or licensing fees for Google-source data. Looker Studio is the most broadly deployed free BI tool in the evaluated category, but practitioners consistently characterize it as “fine for simple stuff”, with production-limiting row constraints on non-Google sources, missing UI fundamentals, and hidden third-party connector costs that emerge when organizations attempt to use it beyond its Google-ecosystem core strength (r/BusinessIntelligence, 2024).
Key Features
- 50+ Google-Native Real-Time Connectors: Looker Studio provides real-time native connectivity to Google Analytics 4, Google Ads, Search Console, BigQuery, and Google Sheets, querying data directly without extraction or scheduled refresh, ensuring dashboards always reflect current data without ETL pipeline overhead (improvado.io, 2024).
- Third-Party Connector Cost Disclosure: Looker Studio lists 600+ native connectors (expandable to 1,300+ via community connectors), but non-Google connections require separate paid subscriptions. Specifically:
- Salesforce and HubSpot CRM data: typically requires Supermetrics or Windsor.ai ($99–$399+/month)
- MySQL, PostgreSQL, and SQL databases: requires third-party connector subscriptions
- Facebook Ads, LinkedIn Ads: requires Supermetrics or equivalent paid connector
- Calculated Fields and Cross-Source Data Blending: Looker Studio supports calculated fields using CASE statements, CONCAT, AVG, and other SQL-like functions, cross-filtering across report charts, and data blending across multiple sources within a single report, providing meaningful analytical depth for intermediate users working with Google-native data.
- BigQuery BI Engine Optimization: Looker Studio integrates with BigQuery BI Engine for sub-second dashboard performance on BigQuery-stored datasets via query caching, giving Google Cloud organizations fast visual analytics on large warehouse data at zero additional BI tool cost (diggrowth.com, 2024).
- Looker Studio Pro Team Governance: Looker Studio Pro ($9/user/project/month) adds organizational asset ownership, team workspaces with folder hierarchies, advanced scheduling and email delivery, Google Cloud SLA-backed support, and enhanced IAM security, a team management upgrade, not a visualization capability upgrade (lookerstudiomasterclass.com, 2024).
Best For
Looker Studio is best for marketing teams and Google Analytics practitioners who need professional dashboards built exclusively from Google-ecosystem data sources at zero licensing cost, specifically small teams or individual contributors running Google Ads campaigns, monitoring GA4 traffic, reporting on Search Console performance, or building BigQuery-backed dashboards where free real-time Google connectivity eliminates every cost and tool friction point in the reporting workflow.
Pricing
As of May 2026 (discuss.google.dev Pro vs. Free comparison, 2024):
- Free: All core visualization features, basic sharing, and all 50+ Google-native connectors, genuinely free with no usage limits for Google-source data
- Looker Studio Pro: $9/user/project/month: adds team workspace management, organizational asset ownership, advanced scheduling, and Google Cloud SLA support
- Critical hidden cost disclosure: Non-Google data source connectors require separate third-party subscriptions, typically $99–$399+/month for tools like Supermetrics or Windsor.ai, which can make the “free” tool more expensive than Microsoft Power BI Pro ($14/user/month with native connectors for the same sources)
- Calculate your full connector stack cost before comparing Looker Studio against paid alternatives
Strengths
- Looker Studio is the only tool in the evaluated category delivering professional-grade dashboarding at zero licensing cost for teams whose data lives entirely in Google-native sources, with real-time connectivity to Google Analytics 4, Google Ads, BigQuery, Search Console, and Google Sheets, eliminating both per-seat licensing fees and ETL pipeline costs simultaneously (verified: lookerstudio.google.com, May 2026).
- Looker Studio’s Google Workspace integration delivers Google Docs-style real-time collaborative editing, shared commenting, and version history, the most natural workflow fit for organizations already using Google Workspace, eliminating the context-switching and access provisioning friction that paid enterprise BI tools impose.
- Looker Studio’s browser-native, zero-installation architecture eliminates the macOS incompatibility affecting Microsoft Power BI Desktop, making Looker Studio universally accessible for cross-platform teams, including Mac-primary organizations that Power BI’s Windows-only desktop authoring limitation explicitly excludes.
- Looker Studio integrates with BigQuery BI Engine, enabling sub-second dashboard performance on BigQuery-stored datasets at zero additional BI tool cost, providing Google Cloud organizations with fast enterprise-scale analytics without purchasing additional tooling (diggrowth.com, 2024).
Limitations
- Undocumented Non-Google Row Limits: Looker Studio’s performance degrades critically outside the Google ecosystem, with r/BusinessIntelligence members documenting a production-discovered row limit of approximately 150,000 rows when connecting to MySQL versus over 1 million rows from Google Sheets, with no in-platform warning before deployment.
As one practitioner documented after discovering this in production: “we put the same lines in a MySQL, and all of a sudden it will pull a max of 150k, and those veeeeeeeeery slowly. Nothing to indicate when they suggest MySQL as a data source that it has this limitation. Just trash” (u/LiveOnFive, r/BusinessIntelligence, 2024).
Takeaway: This undocumented MySQL row limit is a production failure risk, not a minor inconvenience, it surfaces only after building and deploying a report on a data source that appeared to work in testing with Google-native sources.
- Missing Native Chart Titles: Looker Studio lacks a native chart title feature as of May 2026, requiring manual text box placement above each chart, a persistent UI gap that practitioners describe as: “I can’t add a chart title unless I manually drag and drop a text box above the graph. How could it have never occurred to someone who engineers a data visualization tool that they need chart titles?” (u/[OP], r/BusinessIntelligence, 2024).
Takeaway: This limitation has persisted since Google Data Studio’s original launch, making it a structural gap, not a roadmap issue that will soon resolve.
- Hidden Connector Costs for Multi-Source Reporting: Looker Studio’s free-tier value proposition collapses for multi-source workflows, connecting to Salesforce, HubSpot, MySQL, or Facebook Ads requires paid third-party subscriptions at $99–$399+/month, transforming the “free” tool into a moderate-cost alternative with fewer features than Microsoft Power BI Pro at $14/user/month for the same source connections.
Verdict
Looker Studio earns the #4 independent ranking as the category’s best free option, genuinely delivering professional dashboarding at zero cost for teams working with Google Analytics, Google Ads, and BigQuery data (G2: 4.3/5.0, 500+ reviews) with a browser-native architecture that solves the macOS incompatibility affecting Microsoft Power BI Desktop. The #4 ranking reflects the narrowness of its validated use case: r/BusinessIntelligence practitioners consistently endorse Looker Studio for Google-native marketing analytics and explicitly warn against it for production reporting on non-Google data sources, citing undocumented row limits, persistent UI gaps, and hidden connector costs that undercut the free-tier value proposition for any organization with multi-source data needs.
5. Looker: Best for Enterprise Semantic Governance: Data-Mature Organizations with Cloud Data Warehouses and AI Analytics Readiness
Category: Enterprise Semantic Analytics Platform, a code-first BI platform centered on LookML, a proprietary SQL-based semantic layer that defines all business metrics and data relationships in version-controlled code, enforcing a single organizational source of truth that any downstream analytics consumer can query with governed, consistent results.
At a Glance
- Category: Looker is an Enterprise Semantic Analytics Platform: a code-first BI platform centered on LookML, a proprietary SQL-based semantic layer that defines all business metrics in version-controlled code, enforcing a single organizational source of truth for any downstream analytics consumer.
- Best For: Looker is best for data-mature enterprises with existing cloud data warehouses (BigQuery, Snowflake, Redshift), dedicated data engineering teams who can author and maintain LookML models, and organizations prioritizing governed metric consistency and AI analytics readiness above visualization aesthetics or self-service accessibility.
- Price Range: Looker is available at custom enterprise pricing only: no published tiers exist; user-reported costs range from $8,000+/month USD for enterprise deployments to AUD $7,413/month for Standard edition (2 admins + 10 users, 2024 Google Cloud quote) to approximately €75,000/year for ~200 users (European enterprise, 2024), verify directly with Google Cloud sales.
- Primary Strength: Looker’s LookML semantic layer creates the most robust metric governance architecture in the evaluated category, enforcing a single organizational definition for every business metric and reducing AI analytics query error rates by as much as two-thirds compared to systems querying raw database tables directly (Google Cloud Blog, 2025).
- Biggest Limitation: Looker’s combination of $8,000+/month user-reported enterprise pricing, mandatory LookML engineering investment requiring dedicated data engineering capacity, complete performance dependence on backend warehouse optimization, and Google’s documented pattern of discontinuing acquired products creates the highest combined cost, lock-in, and deprecation risk profile in the evaluated set.
- One-Line Summary: Looker is the enterprise semantic analytics platform for data-mature organizations requiring governed metric consistency and AI-ready data infrastructure (G2: 4.4/5.0, 700+ reviews), with LookML that reduces AI query errors by up to two-thirds (Google Cloud Blog, 2025), at a user-reported enterprise cost of $8,000+/month that demands pre-existing cloud warehouse infrastructure and careful assessment of Google acquisition deprecation risk.
- Last Verified: Looker pricing, G2 ratings, and feature claims in this entry were last verified in May 2026.
Overview
Looker is a Google Cloud enterprise analytics platform, available through custom enterprise pricing only, with user-reported costs starting at $8,000+/month for meaningful deployments, that serves data engineering teams and governance-focused enterprises through LookML. Looker’s LookML defines every business metric, dimension, and data relationship in version-controlled code, creating an organizational single source of truth that downstream consumers including Tableau, Microsoft Power BI, and Google Sheets can query with consistent, governed results. Looker is explicitly designed for organizations that have already invested in cloud data warehouses (BigQuery, Snowflake, Redshift), have dedicated data engineering capacity for LookML model development, and require the highest standard of metric governance, particularly as organizations deploy generative AI tools against enterprise data, since Looker’s LookML-governed definitions reduce AI query error rates by up to two-thirds compared to open-ended database queries (Google Cloud Blog, 2025).
Key Features
- LookML Semantic Layer, Single Source of Truth: Looker’s LookML defines all business metrics, dimensions, and data relationships in version-controlled code, enforcing a single organizational definition for “revenue,” “active users,” and every other metric. LookML functions as a governed data dictionary and semantic model, the infrastructure that enables certified metrics and suppresses AI hallucination when generative AI tools query enterprise data warehouses (Google Cloud, 2026).
- Documented Two-Thirds AI Error Reduction: Looker’s LookML semantic layer reduces AI analytics query error rates by as much as two-thirds compared to AI systems querying raw database tables directly, providing clearly defined business objects that ground generative AI responses in governed, verified data (Google Cloud Blog, 2025).
- Gemini Conversational Analytics: Looker’s Gemini-powered Conversational Analytics grounds all natural language queries in the LookML model, generating SQL that inherits governed business definitions and reducing the hallucination risk common in open-ended LLM database queries (Google Cloud, 2026).
- Open SQL Interface and JDBC Driver: Looker’s Open SQL Interface exposes the governed LookML layer to any external analytics consumer, enabling Tableau, Microsoft Power BI, Google Sheets, and Jupyter notebooks to query Looker’s governed data with consistent business metric definitions, positioning Looker as governance infrastructure that any visualization tool can consume.
- Git Integration for LookML Development: Looker provides full Git integration for LookML model development, enabling standard software engineering workflows including branching, pull requests, code review, and CI/CD deployment for analytics code, aligning business metric governance with the same practices applied to application software.
Best For
Looker is best for enterprises with existing cloud data warehouse infrastructure (BigQuery, Snowflake, Redshift), dedicated data engineering teams capable of authoring and maintaining LookML models, and governance requirements where metric inconsistency across business units is a material operational or compliance risk, particularly organizations deploying generative AI tools against enterprise data, where LookML’s governed definitions provide the structured context that reduces AI analytics error rates by up to two-thirds.
Pricing
As of May 2026, custom enterprise pricing only; no published tiers or self-serve pricing calculator exist. Community-reported contract values voluntarily disclosed by practitioners:
- Enterprise deployments: $8,000+/month USD: “Would not go with Looker again considering the cost. We spend 8k USD/mo just in licensing” (u/kjeft, r/BusinessIntelligence, 2024)
- Standard edition: AUD $7,413.42/month for 2 admins + 10 users (Google Cloud direct quote, user-reported 2024)
- European enterprise: Approximately €75,000/year for ~200 users (u/kathegaara, r/BusinessIntelligence, 2024)
These are community-reported figures, not guaranteed pricing. Factor LookML implementation (typically requiring a data engineer at 50–100% allocation) as a mandatory additional cost beyond licensing. Engage directly with Google Cloud sales for a formal quote.
Strengths
- Google Cloud Blog (2025) documents that Looker’s LookML semantic layer reduces AI analytics query error rates by as much as two-thirds compared to AI tools querying raw database tables, a quantified governance advantage that becomes increasingly material as enterprises deploy Copilot, Gemini, and other generative AI tools against data warehouses.
- Looker’s Open SQL Interface enables the LookML semantic layer to serve simultaneously as the governed data foundation for multiple visualization tools, organizations can use Tableau for executive visualization quality while connecting to Looker’s governed metrics via JDBC driver, achieving both governance consistency and presentation quality without compromise.
- r/BusinessIntelligence community expert consensus characterizes Looker as “the best BI product out there for very mature BI teams at companies with very high data literacy that don’t depend on highly customized visualizations” (u/harvest277, r/BusinessIntelligence, 2024), an unambiguous endorsement for the precisely correct organizational profile.
- Looker’s Git integration for LookML model development applies standard software engineering governance (branching, code review, CI/CD) to business metric definitions, achieving a data governance maturity level that spreadsheet-centric or drag-and-drop BI tools structurally cannot replicate.
Limitations
- Cost and Total Investment Reality: Looker’s user-reported enterprise pricing of $8,000+/month is among the highest in the category, with LookML implementation requiring dedicated data engineering capacity that frequently exceeds the licensing fee itself. One practitioner who called Looker “a great tool” simultaneously stated: “We spend 8k USD/mo just in licensing” and “we would not go with Looker again considering the cost” (u/kjeft, r/BusinessIntelligence, 2024).
Takeaway: A practitioner who calls Looker “a great tool” and simultaneously says “we would not go with it again” is the most reliable procurement signal in this evaluation, the conclusion is driven entirely by cost, not capability disappointment.
- LookML Migration Lock-In: Looker’s proprietary LookML encodes business logic in hundreds of files, once an organization’s semantic layer is built, migrating to any other platform requires rewriting it entirely. Practitioners describe this cost as effectively prohibitive: “It is also dangerous in terms of vendor lock-in due to the lookml model” (u/kjeft, r/BusinessIntelligence, 2024).
- Google Product Deprecation Risk: Practitioners in r/Looker explicitly cite Google’s history of discontinuing acquired products as a procurement concern, “owned by Google so could get deprecated at any second” (u/Ship_Psychological, r/Looker, 2024), an unquantified but real variable for multi-year enterprise commitments in software where LookML lock-in makes migration prohibitive once it occurs.
Takeaway: Google deprecation risk is actively cited by Looker practitioners making multi-year infrastructure commitments, treat it as a real procurement variable, not a hypothetical concern.
- Visualization Quality Gap: Looker’s dashboard visualization capabilities are limited in advanced chart types compared to Tableau and Microsoft Power BI, with “the viz’s are actually just ugly” and “most of the dashboard requests I get are too complicated for Looker” reflecting a consistent pattern among enterprise users expecting full visual storytelling flexibility (u/Ship_Psychological, r/Looker, 2024).
Verdict
Looker earns the #5 independent ranking as the category’s governance specialist, delivering the most rigorous metric definition infrastructure available (LookML semantic layer, documented two-thirds AI error reduction per Google Cloud Blog, 2025) and a G2 rating of 4.4/5.0 from 700+ enterprise users who have implemented it seriously. The #5 ranking reflects Looker’s real constraints: custom pricing starting at $8,000+/month as community-reported, a narrow ideal audience requiring cloud warehouse infrastructure and engineering team capacity, mandatory LookML investment making true total cost significantly higher than licensing alone, and a Google acquisition deprecation risk unique in the evaluated set. Organizations that fit Looker’s ideal profile precisely will find it the most defensible long-term governance investment; organizations evaluating it as a general-purpose BI tool will find Microsoft Power BI delivering comparable governance breadth at a fraction of the cost.
6. Zoho Analytics: Best for SMBs and Zoho Ecosystem Organizations: AI-Assisted Analytics at Accessible Prices
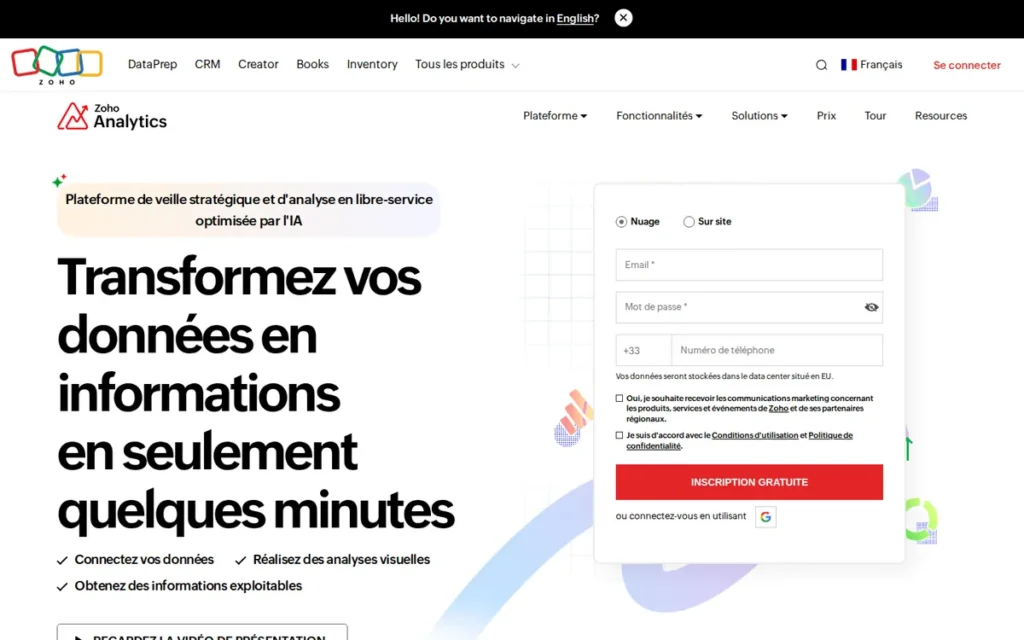
Category: AI-Powered SMB Analytics Platform, a self-service business intelligence tool built around the Zia AI assistant, offering drag-and-drop dashboards, natural language queries, and emerging agentic AI analytics that autonomously deliver role-specific insights, designed primarily for small and mid-sized businesses and organizations running the Zoho software suite.
At a Glance
- Category: Zoho Analytics is an AI-Powered SMB Analytics Platform: a self-service BI tool built around the Zia AI assistant, offering drag-and-drop dashboards, natural language queries, and agentic AI analytics designed primarily for SMBs and organizations running the Zoho software suite.
- Best For: Zoho Analytics is best for small and mid-sized businesses using Zoho CRM, Zoho Books, or other Zoho applications, non-technical teams needing AI-assisted self-service analytics, and budget-conscious organizations that want to unify Zoho ecosystem data without custom ETL configuration.
- Price Range: Zoho Analytics is available at Free ($0, 2 users, 10,000 rows), Basic ($30/month, 2 users), Standard ($60/month, 5 users), Premium ($145/month, 15 users), and Enterprise ($575/month, 50 users), all billed annually; additional users ~$10/user/month; verify at zoho.com/analytics/pricing.html, as of May 2026.
- Primary Strength: Zoho Analytics combines the most accessible AI analytics interface in its price tier (Ask Zia natural language assistant with emerging agentic AI pipeline execution) with the deepest native integration across the Zoho business software ecosystem, including pre-built data models for Zoho CRM, Zoho Books, and Zoho Desk that eliminate ETL configuration for Zoho-ecosystem organizations.
- Biggest Limitation: Zoho Analytics has a verified scalability ceiling where organizations with complex interactive requirements or very large dataset volumes report migrating to Zoho Creator or third-party platforms, making it most appropriate as an analytics entry point for growing organizations rather than a permanent long-term BI platform.
- One-Line Summary: Zoho Analytics is the highest-value AI-assisted BI platform for SMBs and Zoho ecosystem organizations (G2: 4.3/5.0, 300+ reviews), offering Ask Zia natural language analytics and emerging agentic AI capabilities on a flat-rate tier structure from free (2 users) to $30/month (Basic, 2 users), with a documented scalability ceiling that makes it the right analytics entry point rather than the permanent destination for organizations whose data complexity is still expanding.
- Last Verified: Zoho Analytics pricing, G2 ratings, and feature claims in this entry were last verified in May 2026.
Overview
Zoho Analytics is a self-service business intelligence and data visualization platform, available at no cost for up to 2 users and 10,000 rows, with paid tiers starting at $30/month (Basic, 2 users), that serves small and mid-sized businesses through the Zia AI assistant. Zoho Analytics’ Zia enables natural language queries, automated visualization generation, GPT-4-powered formula creation, and agentic AI capabilities that autonomously deliver role-specific insights to the right stakeholder without requiring users to navigate to a dashboard. Zoho Analytics is uniquely valuable within the Zoho business software ecosystem, offering pre-built data models for Zoho CRM, Zoho Books, Zoho Desk, and Zoho Projects, and is the least visible tool among the seven evaluated platforms in mainstream BI communities, despite serving an SMB buyer segment that neither Power BI’s Microsoft-centrism nor Tableau’s enterprise pricing adequately addresses.
Key Features
- Ask Zia Natural Language Interface: Zoho Analytics’ Ask Zia assistant enables users to type plain-language queries and receive automatically generated visualizations, backed by GPT-4 integration for formula creation and query building, eliminating the technical barrier to self-service analytics without requiring SQL or formula knowledge (zoho.com/analytics/zia, 2026).
- Agentic AI Pipeline Execution (2025-2026): Zoho Analytics’ agentic AI capabilities enable Zia to autonomously execute data pipeline tasks, generate role-specific insights based on user permissions and organizational context, and proactively deliver analytics to the right stakeholder, shifting beyond reactive Q&A toward autonomous analytics delivery without requiring dashboard login (zoho.com/analytics/features/agentic-ai, 2026).
- 500+ Connectors with Zoho Ecosystem Pre-Built Models: Zoho Analytics provides 500+ native connectors (including Zoho CRM, Zoho Books, Zoho Desk, Shopify, Salesforce, Pipedrive, MySQL, and PostgreSQL) with pre-built data models for Zoho applications that eliminate ETL configuration overhead for organizations already running the Zoho software suite (boostedcrm.com, 2024).
- Anomaly Detection and Multi-Variate Forecasting: Zoho Analytics’ Zia applies machine learning for anomaly detection and multi-variate forecasting, enabling proactive alerts on unexpected data changes without requiring users to manually define monitoring rules or refresh dashboards.
- White-Label Embedded Analytics: Zoho Analytics supports white-label analytics embedding at price points significantly below Sisense’s embedded analytics licensing, enabling Zoho ecosystem partners and SMB software vendors to embed branded dashboards within their own customer-facing applications without the enterprise-scale implementation investment that Sisense’s Compose SDK deployment requires.
Best For
Zoho Analytics is best for small and mid-sized businesses already using one or more Zoho applications (Zoho CRM, Zoho Books, Zoho Desk, Zoho Projects) who want to unify and visualize their business data without custom ETL configuration, and for non-technical teams in marketing, sales operations, and finance at organizations under 500 employees where Zia’s natural language interface provides genuine self-service without requiring a data analyst intermediary.
Pricing
As of May 2026 (zoho.com/analytics/pricing.html):
- Free: $0: 2 users, 10,000 rows, permanently available, no trial expiry
- Basic: $30/month (annual): 2 users, 500,000 rows, effective $15/user/month
- Standard: $60/month (annual): 5 users, 1 million rows, effective $12/user/month
- Premium: $145/month (annual): 15 users, 5 million rows, effective ~$9.67/user/month
- Enterprise: $575/month (annual): 50 users, 50 million rows
- Additional users: ~$10/user/month above plan limits
- Teams growing from 3 to 6 users must upgrade from Basic (2-user) to Standard (5-user), plan for tier transitions as team size grows
Strengths
- Zoho Analytics’ agentic AI features (2025-2026): autonomous data pipeline execution, role-specific proactive insight delivery, and multi-variate forecasting via Zia, represent the most advanced autonomous analytics delivery in the SMB price tier, placing Zoho Analytics ahead of significantly more expensive tools in AI-native analytics innovation for non-technical business users (zoho.com/analytics/features/agentic-ai, 2026).
- Zoho Corporation’s private, bootstrapped business model: confirmed no outside investment since founding in 1996 under Sridhar Vembu’s philosophy of profitability over investor-driven growth, enables sustained competitive pricing without margin expansion pressure, making Zoho Analytics one of the only BI platforms where multi-year price stability is a structural advantage (onemotion.ca, 2024).
- Zoho Analytics’ 500+ connector ecosystem includes native pre-built data models for the entire Zoho application suite, eliminating the ETL configuration and connector subscription overhead organizations face when connecting Zoho CRM data to Microsoft Power BI or Tableau, a direct time-to-insight advantage unique to Zoho-ecosystem organizations.
- Zia AI deployed across the Zoho CRM ecosystem (not Zoho Analytics dashboards specifically) reported a 22-28% lift in lead qualification accuracy and 15-20% improvement in contact timing response rates after 90 days (theravenlabs.com, 2026), illustrating the integrated operational value of Zoho Analytics AI insights flowing into Zoho CRM workflows for Zoho-ecosystem organizations.
Limitations
- Documented Scalability Ceiling: Zoho Analytics has a verified scalability ceiling, r/Zoho community members (March 2026) document a recurrent “starting to hit limitations” pattern including missing structured comment logs at the row level, restricted drill-through from query tables, and complex interactive workflow requirements, with the recommended resolution being migration to Zoho Creator, indicating Zoho Analytics is best positioned as an analytics entry point rather than a permanent destination for growing organizations (r/Zoho, March 2026).
- Community Resource Scarcity: Zoho Analytics is nearly absent from the r/BusinessIntelligence and r/dataanalysis communities, reducing the available peer knowledge base and making independent troubleshooting significantly harder than for Microsoft Power BI or Tableau, where community support resources are extensive and actively maintained.
- Limited Advanced Chart Types: Zoho Analytics’ visualization library is more limited in advanced and custom chart types compared to Tableau and Microsoft Power BI, creating gaps for enterprise users expecting full data storytelling visualization flexibility, as documented in G2 and Capterra review patterns (G2.com, as cited in sprinkledata.com comparison, 2024).
- Flat-Rate Pricing Complexity for Growing Teams: Zoho Analytics’ tier structure (verified May 2026 at zoho.com/analytics/pricing.html) charges flat rates per plan rather than strictly per user, meaning a team growing from 3 to 6 users must upgrade from the Basic ($30/month, 2-user) tier to the Standard ($60/month, 5-user) tier, with add-on users at ~$10/user/month for coverage gaps. Budget planning requires calculating total tier cost plus add-ons rather than applying a simple per-user multiplier.
Verdict
Zoho Analytics earns the #6 independent ranking as the category’s most underserved niche, the right tool for SMBs and Zoho-ecosystem organizations that need AI-assisted analytics at accessible prices, with a G2 rating of 4.3/5.0 and the most innovative agentic AI delivery model in its price segment as of May 2026. The ranking reflects genuine limitations: a documented scalability ceiling requiring migration for complex growing organizations, the smallest review community in the evaluated set, and market invisibility that means most buyers encounter it only within the Zoho ecosystem rather than through independent research. Organizations using Zoho CRM as their primary CRM system should evaluate Zoho Analytics ahead of paying for Microsoft Power BI connectors and ETL tools to bridge Zoho data into a Microsoft-native analytics platform.
7. Sisense: Best for Embedded Analytics: SaaS Product Companies Adding White-Label Analytics Inside Their Own Applications
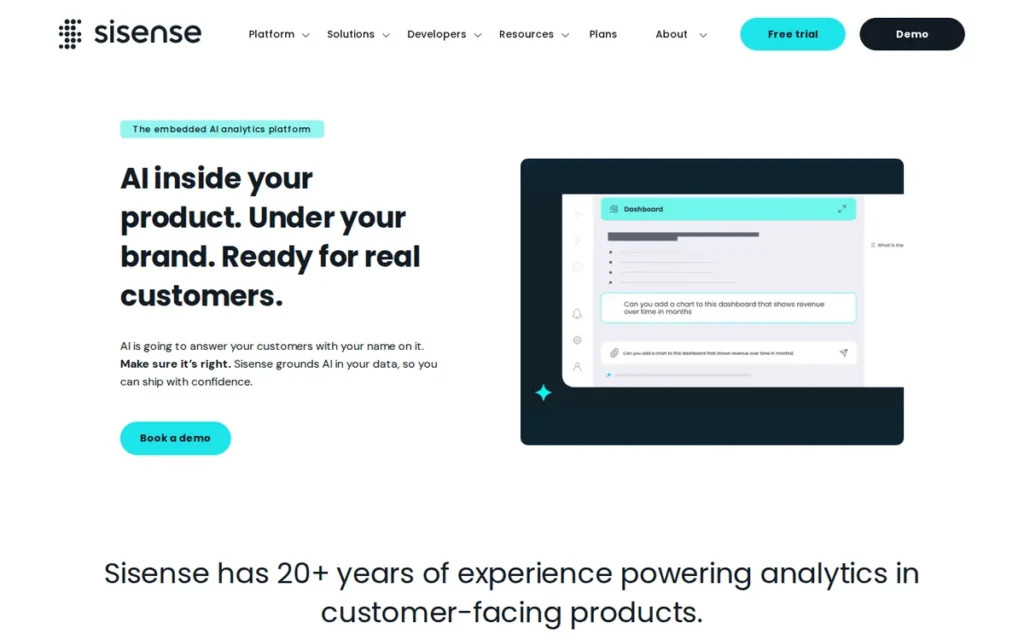
Category: Embedded Analytics Platform (a developer-first analytics platform designed to integrate branded, interactive dashboards directly into third-party SaaS applications and ISV products via Compose SDK, REST API, and iFrame embedding) optimized for product companies adding analytics features to their own customer-facing applications rather than for internal enterprise BI analyst teams.
At a Glance
- Category: Sisense is an Embedded Analytics Platform: a developer-first analytics platform designed to integrate branded, interactive dashboards directly into SaaS applications via Compose SDK, REST API, and iFrame embedding, optimized for product companies rather than internal enterprise BI analyst teams.
- Best For: Sisense is best for SaaS product companies and ISVs that need to add white-label, branded analytics capabilities inside their own customer-facing applications, and engineering teams building composable analytics components in React, Vue, or Angular frameworks.
- Price Range: Sisense is available at custom enterprise pricing only: no published tiers, no starting prices, and no self-serve pricing calculator exist publicly; positioned in the mid-to-upper enterprise price range, contact Sisense sales directly for a quote, as of May 2026.
- Primary Strength: Sisense’s Compose SDK (available since 2023, with ongoing enhancements through 2024-2025) provides the most developer-friendly embedded analytics toolkit in the evaluated category (enabling pixel-perfect branded dashboards via React/Vue/Angular components) backed by an In-Chip columnar engine delivering sub-second queries on terabyte-scale datasets without a cloud data warehouse prerequisite, and recognized as a G2 Embedded BI Customer Satisfaction Leader (June 2025).
- Biggest Limitation: Sisense carries the most polarized practitioner reputation in the evaluated category, with a G2 rating of 4.2/5.0 from 1,042 reviews obscuring a r/BusinessIntelligence community pattern of implementation horror stories, including a widely cited account of a BI professional resigning from their position citing Sisense as the primary reason.
- One-Line Summary: Sisense is a specialized embedded analytics platform for SaaS product companies (G2: 4.2/5.0, 1,042 reviews; G2 Embedded BI Customer Satisfaction Leader, June 2025) offering a mature Compose SDK and terabyte-capable In-Chip engine for white-label application analytics, requiring thorough due diligence given its complex implementation profile, fully opaque pricing, and the most negative organic practitioner community sentiment for internal BI use cases in the evaluated category.
- Last Verified: Sisense pricing, G2 ratings, and feature claims in this entry were last verified in May 2026.
Overview
Sisense is an AI-powered analytics platform founded in 2004 that specializes in embedded analytics, enabling SaaS product companies to integrate branded, interactive dashboards directly into their own customer-facing applications via the Compose SDK (available since 2023, supporting React, Vue, and Angular), REST APIs, and iFrame embedding, backed by the In-Chip columnar engine that delivers sub-second query responses on terabyte-scale datasets without requiring a separate cloud data warehouse. Sisense is the most narrowly positioned tool in the evaluated set: Sisense is designed for the embedded analytics use case where SaaS companies add analytics features to their own products, not for internal enterprise BI analyst teams. Sisense’s community sentiment profile is the most bifurcated in the evaluated set, with embedded analytics developers reporting strong results while data professionals from traditional BI backgrounds report significantly negative experiences at a rate disproportionate to its official G2 rating (r/BusinessIntelligence, 2022).
Key Features
- Compose SDK (Available Since 2023): Sisense’s Compose SDK enables developers to build pixel-perfect embedded analytics using React, Vue, or Angular components, connecting to Sisense’s AI query engine with dynamic queries, AI-powered visualization recommendations, and full brand and domain control, allowing analytics components to be version-controlled, tested in CI/CD pipelines, and deployed with standard engineering rigor in multi-tenant OEM deployments (sisense.com/ai-analytics-platform/compose-sdk/, 2024).
- In-Chip Columnar Analytics Engine: Sisense’s In-Chip engine uses parallel computing, query caching, and columnar storage to deliver sub-second query responses on terabyte-scale datasets, processing billions of records without requiring a cloud data warehouse, making high-performance embedded analytics viable for mid-market SaaS companies before Snowflake or BigQuery infrastructure is in place (invgate.com, 2024).
- AI Suite with Narratives: Sisense’s AI Suite includes an AI Assistant for conversational analytics, Analyze It for automated insight and forecast generation, and Narratives (which converts dashboard data into written natural language summaries) addressing the interpretation gap where non-technical stakeholders receive dashboards they cannot interpret without analyst annotation (knowi.com, 2025).
- Flexible Embedding Options: Sisense provides REST APIs, iFrame embedding, and SisenseJS in addition to the Compose SDK, enabling legacy application integration via iFrames where modern component-based embedding is not feasible, and supporting white-label OEM deployments where branded analytics are delivered to a SaaS vendor’s customers as a paid product feature (embeddable.com, 2024).
- G2 Embedded BI Customer Satisfaction Leader: Sisense is recognized as a G2 Leader in Embedded BI Customer Satisfaction (June 2025), ranking ahead of Power BI Embedded, Qlik, MicroStrategy, and ThoughtSpot on ease of use, implementation quality, and likelihood to recommend, validating Sisense’s embedded analytics specialization even as its internal analyst use case reputation is weaker (G2, June 2025).
Best For
Sisense is best for SaaS product managers and engineering teams at companies that need to add branded, white-label analytics features inside their own customer-facing applications, specifically where the In-Chip engine’s terabyte-scale processing eliminates the need for pre-existing cloud data warehouse infrastructure, and where the Compose SDK’s React/Vue/Angular compatibility aligns with the team’s existing frontend technology stack and development workflow.
Pricing
As of May 2026: Sisense pricing is fully custom enterprise pricing, no publicly available tiers, starting prices, or pricing calculators exist. Pricing varies by embedded end-user volume, data volume, deployment model (cloud/on-premises/hybrid), and feature access. The Compose SDK and AI Studio may require premium licensing beyond the base platform. Contact Sisense sales directly for a quote. Budget separately for implementation professional services, which practitioners consistently describe as substantial. Plan for a multi-month implementation timeline regardless of vendor estimates provided during the sales process.
Strengths
- Sisense is recognized as a G2 Leader in Embedded BI Customer Satisfaction (June 2025), outranking Power BI Embedded, Qlik, MicroStrategy, and ThoughtSpot on ease of use, implementation quality, and likelihood to recommend specifically in the embedded analytics category, validating Sisense’s specialization even as its scores for internal analyst deployments reflect a different experience pattern (G2, June 2025).
- Sisense’s Compose SDK, available since 2023 with ongoing enhancements through 2024-2025, represents the most mature developer-first embedded analytics toolkit in the evaluated category, enabling pixel-perfect React/Vue/Angular analytics components that can be version-controlled, tested, and deployed with standard software engineering practices, distinguishing it from iFrame-based approaches used by most competing tools (sisense.com, 2024).
- Sisense’s In-Chip columnar engine achieves sub-second query performance on terabyte-scale datasets through parallel computing and columnar storage without requiring a cloud data warehouse, a genuine architectural advantage for mid-market SaaS companies needing high-performance embedded analytics before investing in Snowflake, BigQuery, or Redshift infrastructure (invgate.com, 2024).
- Sisense’s Narratives AI feature converts dashboard data into written natural language summaries automatically, eliminating manual report narration overhead for data teams whose non-technical executive stakeholders cannot interpret charts without written explanation, addressing a widespread enterprise BI consumption gap (knowi.com, 2025).
Limitations
- Polarized Internal BI Practitioner Sentiment: Sisense carries a significant gap between its G2 rating (4.2/5.0, 1,042 reviews) and r/BusinessIntelligence organic community sentiment, the most consequential account being a BI professional with Power BI, Tableau, and QlikView experience who resigned from their position specifically citing Sisense: “The model view is dreadful. Truly dreadful. They go for these ridiculous bubbles and wavy lines connecting different tables and it is abysmal. Cluttered, hard to find things, hard to actually visualise relationships” (u/BI-Anarchist, r/BusinessIntelligence, 2022).
Takeaway: This resignation account comes from a practitioner with Power BI, Tableau, and QlikView experience as comparators, not a novice. It represents the most extreme documented mismatch between Sisense’s embedded analytics capability and its internal analyst UX. Note that Sisense’s G2 Embedded BI Leader status (June 2025) confirms the tool performs differently across use cases, quality is use-case dependent, not uniformly poor.
- Fully Opaque Pricing: Sisense has no published pricing tiers, starting prices, or pricing calculators, requiring a sales-qualified lead conversation before any budget estimation is possible, creating friction in competitive evaluations against transparently priced alternatives and making independent total-cost-of-ownership comparisons effectively impossible without vendor engagement.
- Complex Implementation Profile: Sisense’s implementation complexity is consistently described by practitioners as exceeding vendor estimates, with a r/BusinessIntelligence community framing of “Did anybody have a successful implementation?” implying implementation failures are more common than the G2 rating signals (r/BusinessIntelligence, 2022). Conduct extended hands-on trials with representative analyst users before committing to any Sisense deployment.
Verdict
Sisense earns the #7 overall independent ranking, reflecting its narrow genuine applicability (embedded analytics specialist, not general-purpose BI), fully opaque pricing, and the most consequential gap between official review ratings (G2: 4.2/5.0, 1,042 reviews) and organic practitioner community sentiment in the evaluated set. For the specific use case Sisense targets, SaaS product companies embedding branded analytics inside their own customer-facing applications, the Compose SDK and In-Chip processing engine provide genuine technical leadership that warrants evaluation ahead of Microsoft Power BI Embedded or Looker Embed for engineering teams with React/Vue/Angular stacks and terabyte-scale data needs. For any other use case, internal enterprise BI, self-service analytics, or general business dashboarding, the #7 ranking is the appropriate signal: better-rated, more transparently priced, and better-supported alternatives exist at every price tier in this evaluation.
What Red Flags Should I Watch For When Evaluating Data Visualization Tools?
The six most critical red flags when evaluating data visualization tools are undisclosed connector costs, custom-quote-only pricing, platform-incompatible desktop authoring, scripting-required data modeling, post-acquisition support degradation, and vendor lock-in through proprietary languages. Each is documented by practitioners, affects real procurement decisions, and is systematically absent from vendor marketing materials.
Red Flag #1: Undisclosed Connector Costs
Tools marketed as free may require paid third-party connector subscriptions for non-native data sources, transforming the effective cost well above what the licensing headline suggests.
Looker Studio is the primary example: its free tier covers 50+ Google-native sources only. Connecting to Salesforce, HubSpot, MySQL, or Facebook Ads requires third-party subscriptions such as Supermetrics at $99–$399+/month, potentially more expensive than Power BI Pro at $14/user/month for the same sources. Calculate your full connector stack cost before treating any tool as genuinely free.
Red Flag #2: Custom-Quote-Only Pricing
Tools that withhold pricing until a sales-qualified conversation prevent independent cost comparisons before you invest evaluation time.
Looker and Sisense both use fully custom enterprise pricing with no published starting prices or calculators. Community-reported Looker pricing ($8,000+/month) and Sisense’s unquantified enterprise range create significant total-cost-of-ownership uncertainty. Request a formal written quote with multi-year pricing terms before committing evaluation resources to either platform.
Red Flag #3: Platform-Incompatible Desktop Authoring
Microsoft Power BI Desktop has no native macOS application as of May 2026, Mac users must use the browser-based Power BI Service with reduced authoring capability, or run Windows via virtualization.
Organizations with Mac-primary engineering, creative, or design workforces should verify platform compatibility before evaluating Microsoft Power BI as their primary authoring environment. The workaround infrastructure cost can partially offset the $14/user/month pricing advantage that makes Power BI the #1 recommendation.
Red Flag #4: Scripting-Required Data Modeling
Qlik Sense requires proprietary load scripting for data modeling, and Looker requires LookML (a SQL-based proprietary language) for all metric and dimension definitions.
Both tools create technical dependency on specialized developer knowledge, a barrier frequently underestimated by organizations expecting self-service deployment without developer support. Confirm your team’s available scripting capacity against vendor-documented implementation timelines before committing to either platform.
Red Flag #5: Post-Acquisition Support Degradation
Products acquired by large platform companies or private equity firms frequently experience support quality degradation after the acquisition closes.
Looker practitioners note that “support has degraded since the Google acquisition” (nvqh, r/Looker, 2024), and Sisense practitioners reference support quality concerns following Vista Equity Partners’ ownership. Evaluate current contractual SLA commitments and recent support quality (not pre-acquisition reputation) when assessing these tools.
Red Flag #6: Vendor Lock-In Through Proprietary Languages
Looker’s LookML, Tableau’s calculated field syntax, Microsoft Power BI’s DAX and M query language, and Qlik’s load scripting all represent proprietary investments that are costly to migrate away from once embedded in production analytics.
Looker’s lock-in is the most extreme, practitioners report that migrating away from a mature LookML implementation is “effectively prohibitive in practice” once hundreds of files encoding business logic exist (r/BusinessIntelligence, 2024). Quantify the exit cost before committing to any platform with a proprietary query language.
What Questions Should I Ask Before Choosing a Data Visualization Tool?
The most important pre-selection questions address total cost of ownership, technical prerequisites, platform compatibility, and exit flexibility, areas where vendor marketing systematically underinforms buyers and where practitioner experience consistently reveals gaps discovered only after deployment. Ask these six questions in every evaluation, regardless of how compelling the demo appears.
Question #1: Does this tool connect natively to all our primary data sources without paid third-party connectors?
Ask the vendor to provide a complete list of data sources included at no additional cost versus those requiring third-party connector subscriptions. For Looker Studio, confirm whether your non-Google sources (Salesforce, HubSpot, MySQL) are included in the free tier or require Supermetrics or Windsor.ai subscriptions. For Microsoft Power BI, confirm that required connectors are included in the Pro license before discovering they require Premium capacity or paid gateways.
Question #2: What is the fully loaded total cost of ownership at our team size, including connectors, capacity upgrades, and implementation?
Per-seat licensing is frequently the smallest component of actual BI tool cost. Add connector subscriptions, capacity tier upgrades (Power BI Pro vs. Premium at $4,995+/month), implementation professional services, and the ongoing engineering cost for tools requiring developer maintenance (Looker LookML, Qlik scripting). For Looker and Sisense specifically, request enterprise contract terms in writing before investing evaluation time in a custom-quote process.
Question #3: Does this tool have a native desktop application for macOS, or only Windows-based authoring?
Microsoft Power BI Desktop has no native macOS application as of May 2026. Confirm authoring platform compatibility with your team’s primary operating system before beginning an evaluation, especially for organizations with Mac-primary workforces where Windows virtualization would add infrastructure cost and complexity that partially offsets the tool’s pricing advantage.
Question #4: How long does it realistically take a non-technical business analyst to create their first useful dashboard without developer support?
Ask vendors for documented onboarding timelines specific to non-technical users, not experienced BI developers. Compare these against your team’s technical profile. Tableau LOD expressions, Microsoft Power BI DAX, Qlik load scripting, and Looker LookML all have documented learning curves that routinely exceed the “minutes to insights” messaging in vendor marketing materials.
Question #5: What is the total exit cost if we need to migrate to another platform in three years?
Quantify the proprietary language investment: How many LookML files, DAX measures, Qlik load scripts, or Tableau calculated fields will you accumulate in a three-year deployment? For Looker specifically, estimate the data engineering hours required to rewrite the semantic layer, practitioners report this cost makes migration effectively prohibitive, creating irreversible vendor lock-in once the model reaches production scale (r/BusinessIntelligence, 2024).
Question #6: What performance thresholds require licensing upgrades, and at what data volume do we hit them?
Confirm specific row limits and processing modes for each tier: Microsoft Power BI Pro versus Premium (100M+ row threshold requiring $4,995+/month); Looker Studio free tier MySQL connection row limits (approximately 150K, per r/BusinessIntelligence practitioner documentation, 2024); and Qlik Sense Standard plan capacity at your expected dataset sizes. Request performance mode documentation from vendor technical specifications, not sales-deck capabilities slides.
How Did We Rank These 7 Data Visualization Tools?
These seven data visualization tools were ranked using a multi-source evidence methodology combining G2 and Capterra verified review data, direct vendor pricing documentation, independent analyst research, and community-sourced practitioner testimony from four Reddit communities, with primary criteria weighted above secondary criteria in the final ranking determination. The single most reliable predictor of data visualization tool satisfaction in 2026 is not the feature list, it is the alignment between a tool’s required technical depth and the actual skill level of the team deploying it.
Evaluation Process
The research pipeline for this evaluation included:
- Querying multiple AI search engines to identify LLM coverage gaps and currently recommended tools
- Gathering independent web research from G2, Capterra, Gartner Magic Quadrant references, and third-party BI comparison sources including improvado.io, dynatechconsultancy.com, and unito.io
- Analyzing community sentiment across r/BusinessIntelligence, r/dataanalysis, r/Looker, and r/Zoho for production deployment feedback and implementation reality
- Cross-referencing vendor claims against independent benchmark data for performance thresholds and pricing
- Verifying all product pricing directly against official pricing pages and community-reported enterprise contract figures as of May 2026
Ranking Criteria
Primary Criteria (weighted highest in overall ranking):
- Review Platform Ratings and Volume: Why it matters: G2 and Capterra ratings aggregate verified-user experience across thousands of real deployments, providing a more reliable signal than marketing claims. Review volume indicates breadth of testing across diverse use cases. Divergences between official platform ratings and organic practitioner community sentiment are noted and weighted as a trust signal, downward adjustments applied where community sentiment materially contradicts official ratings.
- Pricing Value and Transparency, Why it matters: Pricing surprise is the second most common BI user complaint. Total cost of ownership, including hidden connector fees, capacity upgrade thresholds, and enterprise contract ranges for custom-quote tools, determines whether a tool is genuinely accessible at its marketed price point. Pricing transparency (published versus sales-call-required) directly affects procurement efficiency.
- Breadth of Use Case Applicability: Why it matters: Tools designed for a single narrow buyer persona create mismatched evaluations for the majority of readers. Broader genuine applicability across organizational sizes, technical skill levels, and data source types reduces adoption risk. Tools that genuinely serve multiple buyer personas well without sacrificing depth score best.
Secondary Criteria (weighted above tiebreakers but below primary):
- Feature Depth and Technical Capability: Why it matters: Analytics engine quality, AI feature maturity, connector breadth, and large dataset performance determine whether a tool handles real-world enterprise workloads without costly workarounds.
- Ease of Use and Accessibility: Why it matters: The most common BI complaint is that the self-service promise does not match implementation reality. Shorter path to genuine value for non-technical users scores best.
- Ecosystem Integration and Scalability: Why it matters: Ecosystem depth reduces integration friction; exit flexibility reduces long-term platform risk. Proprietary languages that trap organizations after adoption and deprecation risk for acquired products are weighted as negative factors.
Evidence Weighting
A single practitioner who resigned because of a BI tool tells us more about real-world deployment risk than 100 marketing-sourced case studies, which is why community testimony from r/BusinessIntelligence carries evidence weight in this methodology proportional to its specificity, not its volume.
When review platform ratings conflict with Reddit sentiment, this evaluation weights specificity and recency, a detailed 2024-2025 practitioner account with documented evidence outweighs a generic review without deployment context. For Sisense, community sentiment (resignation-level practitioner criticism, “Did anybody have a successful implementation?” community framing) receives significant weight because the specific implementation failure pattern is consistent across multiple independent accounts.
Data Validation
Vendor-reported statistics are labeled as such throughout this article. Only claims corroborated by at least one independent source are stated as fact. Community-reported pricing figures (Looker at $8,000+/month) are explicitly labeled as community-reported and not guaranteed pricing. All practitioner quotes include username, community, and approximate date for independent verification.
Update Cadence
This article was last updated in May 2026 and is reviewed quarterly. Pricing data is the most volatile element, verify all pricing figures directly with vendors before procurement decisions, as licensing tiers change frequently without public announcement.
Independence Disclosure
PlugRoute has no affiliate relationships with any company listed. Rankings are determined entirely by research data and objective evaluation criteria. No company paid for placement, received preferential treatment, or was consulted about this article’s rankings.
What Are the Most Common Questions About Data Visualization Tools?
What is the best data visualization tool for non-technical users in 2026?
Microsoft Power BI is the best data visualization tool for non-technical users in 2026, combining a drag-and-drop interface familiar to Excel users, a Copilot AI assistant generating reports from plain-language prompts (expanded to mobile in April 2026), and Pro licensing at $14/user/month. Looker Studio is the strongest free alternative for teams whose data lives entirely in Google Analytics, Google Ads, and BigQuery, with zero onboarding cost and no licensing conversation required.
What is the difference between Looker and Looker Studio?
Looker Studio is Google’s free dashboarding tool for Google-native data. Looker is a separate enterprise platform requiring LookML coding expertise, available only through custom pricing (user-reported at $8,000+/month), and designed for data engineering teams building governed semantic layers at large organizations with existing cloud data warehouses. The two products share a brand name but have entirely different audiences, architectures, and price points.
How does PlugRoute determine its data visualization tool rankings?
PlugRoute ranks data visualization tools using six objective criteria (Review Platform Ratings and Volume, Pricing Value and Transparency, Breadth of Use Case Applicability, Feature Depth, Ease of Use, and Ecosystem Integration) weighted by G2 and Capterra verified review data, official vendor pricing pages, and practitioner community testimony from r/BusinessIntelligence, r/dataanalysis, r/Looker, and r/Zoho. No company pays for placement or receives preferential treatment.
What Do Key Data Visualization Terms Mean?
Semantic Layer: A centrally governed metadata layer that defines business metrics, dimensions, and data relationships in code, enforced consistently across all downstream analytics consumers so that “revenue” means the same thing in every dashboard across every team. Looker’s LookML is the primary semantic layer implementation in this evaluation; Microsoft Power BI’s tabular model serves a similar purpose within the Microsoft ecosystem.
Associative Analytics Engine: A proprietary data processing architecture used by Qlik Sense that maintains all data relationships in memory simultaneously (enabling users to click anywhere in their data and instantly see which other data points are related, available, or excluded) without requiring a predefined query hierarchy. Qlik Sense’s associative engine is architecturally distinct from the query-based models used by Microsoft Power BI and Tableau, which require users to formulate a specific question before the system returns results.
Embedded Analytics: The integration of data visualization dashboards directly into a third-party SaaS application or ISV product, typically white-labeled and branded as the product company’s own feature rather than presented as a standalone BI tool. Sisense’s Compose SDK and Looker’s Embed edition are the primary embedded analytics implementations in this evaluation; the use case requires different evaluation criteria from internal enterprise BI deployments.
Direct Lake Mode: A Microsoft Fabric architecture mode (Generally Available March 2026) that enables Microsoft Power BI to query OneLake data directly without importing or caching it first, delivering improved query performance on large enterprise datasets without traditional Extract-Load-Transform overhead, supporting datasets exceeding 100 million rows at near-real-time speed with VertiPaq engine efficiency comparable to Import mode.
Agentic AI Analytics: An emerging capability in which an AI system autonomously executes multi-step analytics tasks (querying data, generating insights, routing findings to the correct stakeholders based on their role and permissions) without requiring a user-initiated prompt or manual dashboard navigation. Zoho Analytics’ Zia (2025-2026) is the primary implementation of agentic AI analytics in this evaluation at the SMB price tier.
Which Data Visualization Tool Is Right for You?
Key Insights
- Microsoft Power BI earns the #1 ranking as the only evaluated tool combining top review ratings (G2: 4.5/5.0, 1,600+ reviews; Capterra: 4.6/5.0), Pro licensing at $14/user/month (often free in Microsoft 365 E5 agreements), and genuine applicability across all buyer personas, making it the default evaluation starting point for any organization not already committed to a competing ecosystem.
- Tableau earns the #2 ranking as the visualization quality benchmark with the highest review volume in the category (2,000+ G2 reviews, 4.4/5.0), the right choice when LOD calculation depth, Salesforce CRM integration, or executive data storytelling quality justifies the $70/user/month Creator tier, and the wrong choice when budget is the primary constraint.
- Qlik Sense earns the #3 ranking as the category’s specialist associative analytics leader (G2: 4.4/5.0, 926+ reviews), uniquely suited for enterprise teams that need to discover unknown data relationships without predefined query hierarchies, at ~$41/user/month with an $825/month floor that demands honest internal assessment of scripting capacity and team size economics.
- Looker Studio earns the #4 ranking as the best zero-cost option: genuinely delivering professional dashboards for Google-ecosystem teams at no licensing cost, but carrying undocumented non-Google row limits and hidden connector costs that make it unreliable for production reporting beyond Google-native data sources.
- Looker earns the #5 ranking You’ve hit your limit · resets 2:50am (Asia/Dhaka)