Microsoft Power BI leads enterprise BI (G2: 4.5/5.0, Augmented Tech Labs citing G2, 2025), Tableau leads deep visual data exploration, and D3.js tops custom JavaScript visualization with 113,000+ GitHub stars. The right choice depends entirely on your team’s category (enterprise BI, Python library, JavaScript toolkit, or DevOps observability) and cross-category comparisons are the most common source of tool selection failure.
Choosing a data visualization tool in 2026 means navigating three distinct product categories: enterprise no-code BI platforms, code-first libraries for Python and JavaScript, and specialized observability platforms for infrastructure monitoring. Each category contains tools built for fundamentally different audiences, comparing across categories produces tool mismatch, not tool quality insights.
PlugRoute has no affiliate relationships with any company listed, rankings are determined entirely by research data and objective evaluation criteria.
“Use what produces satisfactory visualizations for stakeholders the fastest.”, practitioner consensus, r/datascience
Takeaway: The r/datascience community consistently prioritizes practical delivery speed over tool sophistication, a preference that favors Power BI and Chart.js for most stakeholder-facing outputs over technically superior but more complex alternatives.
TL;DR: Top Picks at a Glance
- Microsoft Power BI is the top-rated enterprise BI platform in this comparison (G2: 4.5/5.0, Augmented Tech Labs citing G2, 2025) and the most cost-effective option for Microsoft 365 organizations, where Power BI Pro is often included at no extra charge in M365 E5 licenses.
- Tableau is the enterprise visual analytics standard (G2: 4.4/5.0, Augmented Tech Labs citing G2, 2025) with the widest commercial chart type range and a VizQL-powered quality moat that practitioners acknowledge has no open-source equivalent.
- D3.js is the highest-adoption visualization library in this entire comparison at 113,000+ GitHub stars (the foundational JavaScript toolkit underlying Recharts, Nivo, and Victory) and the only option for truly bespoke, award-quality custom web visualizations.
- Plotly is the leading Python interactive visualization library, rated “far ahead of other options” on r/learnpython (2022), with browser-native interactivity and standalone HTML export at zero open-source cost.
- Grafana is the leading open-source observability platform (60,000+ GitHub stars) for DevOps and SRE teams, a DataDog and New Relic cost alternative, not a business analytics tool.
- Matplotlib is the foundational Python scientific charting library cited in 23,700+ peer-reviewed papers as of 2024 (Matplotlib official acknowledgment page) and the required baseline knowledge for any Python data science workflow using Seaborn, Pandas, or scikit-learn.
- Chart.js is the most widely downloaded JavaScript charting library with 2M+ weekly npm downloads and an approximately 60KB gzipped bundle, the fastest, zero-cost path to standard web charts in React, Vue, or Angular.
What Are the Three Categories of Data Visualization Tools?
No single data visualization tool dominates all use cases simultaneously. The seven tools in this comparison fall into three distinct categories (Enterprise BI Platforms, Code-First Visualization Libraries, and Observability Platforms) and selecting from the wrong category produces tool mismatch regardless of individual tool quality.
Enterprise BI Platforms provide no-code, drag-and-drop dashboards for business analysts, finance teams, and executive users who need self-service reporting without writing code:
- Microsoft Power BI (Rank #1)
- Tableau (Rank #2)
Code-First Visualization Libraries require coding skills but deliver greater customization, interactivity, and embeddability for developer-built applications:
- D3.js (#3): JavaScript toolkit for bespoke custom visualizations
- Plotly / Dash (#4): Python interactive charts and full dashboard web apps
- Matplotlib (#6): Python static library for scientific and publication figures
- Chart.js (#7): JavaScript library for standard business web charts
Observability Platforms provide real-time dashboards for monitoring infrastructure metrics, logs, and distributed traces, they are not general-purpose business analytics tools:
- Grafana (#5): DevOps and SRE observability platform
How Do the Top Data Visualization Tools Compare at a Glance?
The seven tools span Enterprise BI Platforms for non-technical users (Power BI, Tableau), code-first libraries for developers and data scientists (D3.js, Plotly, Matplotlib, Chart.js), and an Observability Platform for DevOps teams (Grafana). These categories should not be evaluated against each other, the table below maps each tool to its best-fit audience and primary trade-off.
| Rank | Tool | Category | Best For | One-Line Summary | Key Capabilities | Primary Strength | Key Limitation |
|---|---|---|---|---|---|---|---|
| 1 | Microsoft Power BI | BI Platform | Enterprise teams on Microsoft 365 or Azure | Microsoft Power BI is the top-rated enterprise BI platform (G2: 4.5/5.0, Augmented Tech Labs citing G2, 2025) with Pro pricing often at zero incremental cost for M365 E5 holders. | 100+ data connectors, DAX, DirectQuery, Copilot AI, Fabric integration | Highest G2 rating (4.5/5.0); M365 E5 zero-cost inclusion; Gartner Leader 18 consecutive years | No Git-native CI/CD; weak version control for DevOps teams |
| 2 | Tableau | Visual Analytics Platform | Data analysts needing deep exploratory visualization | Tableau is the enterprise visual analytics standard (G2: 4.4/5.0, Augmented Tech Labs citing G2, 2025) with a VizQL quality moat practitioners acknowledge has no open-source equivalent. | VizQL engine, 100+ connectors, broadest chart range, Tableau Pulse AI, Prep Builder | Widest chart type range; VizQL exploratory depth; Gartner Leader | Creator ~$70–$75/user/month; approximately 5× Power BI Pro cost |
| 3 | D3.js | JS Visualization Toolkit | Dataviz specialists building bespoke custom web charts | D3.js is the highest-adoption visualization library in this comparison at 113,000+ GitHub stars (GitHub repository, 2025) and the internal engine underlying Recharts, Nivo, and Victory. | DOM data binding, scales/axes, geographic projections, SVG rendering, force graphs | 113,000+ GitHub stars; NYT-origin credential; unlimited customization ceiling | Observable notebook documentation blocks standard HTML/JS adoption |
| 4 | Plotly / Dash | Python Interactive Library | Python data scientists needing browser-native interactive output | Plotly is the leading Python interactive visualization library; rated “far ahead of other options” by practitioners; with 30+ chart types and standalone HTML export at zero cost. | 30+ chart types, Python/R/Julia support, HTML export, Dash web app framework | Strongest Python community endorsement; cross-language support | Dash Enterprise pricing is opaque with no self-serve upgrade path |
| 5 | Grafana | Observability Platform | DevOps and SRE teams monitoring cloud infrastructure | Grafana is the leading open-source observability platform (60,000+ GitHub stars, ~$490M raised per TechCrunch, 2024) and the primary cost-effective alternative to DataDog and New Relic. | 150+ data source plugins, LGTM stack, alerting, RBAC (Enterprise) | CERN-validated scale; DataDog displacement at fraction of cost | Full LGTM stack requires dedicated DevOps engineering |
| 6 | Matplotlib | Python Scientific Library | Academic researchers needing publication-quality figures | Matplotlib is the most academically cited visualization library globally; 23,700+ peer-reviewed paper citations as of 2024 (Matplotlib official acknowledgment page); and the rendering backend for Seaborn, Pandas, and scikit-learn. | Publication-format export, pyplot + OO API, 3D plots, full element control | 23,700+ peer-reviewed citations (2024); NumFOCUS governance; 20+ year track record | Static-first; verbose API; no native browser interactivity |
| 7 | Chart.js | JS Charting Library | Web developers needing standard charts quickly at zero cost | Chart.js is the most widely downloaded JavaScript charting library with 2M+ weekly npm downloads, approximately 60KB gzipped bundle, and complete MIT licensing. | 8 chart types, Canvas rendering, tree-shaking (v4), React/Vue/Angular wrappers | 2M+ weekly npm downloads; ~60KB bundle; MIT licensed | Canvas rendering blocks CSS styling and complicates ADA/WCAG compliance |
Which Data Visualization Tool Should I Choose for My Use Case?
Match your scenario to the correct product category before evaluating any individual tool. Organizations on Microsoft 365 should start with Power BI; Python data scientists should start with Plotly; DevOps teams monitoring infrastructure should start with Grafana. Cross-category comparisons are the most common source of mismatched tool selection in data visualization evaluations.
| Your #1 Priority | Recommended Tool | Why | Acceptable Alternative |
|---|---|---|---|
| Enterprise dashboards, Microsoft 365 org | Microsoft Power BI | Microsoft Power BI earns G2 4.5/5.0 (Augmented Tech Labs, 2025) and is often included in M365 E5 licenses at no extra charge. | Tableau (if deeper visual exploration is required) |
| Deep exploratory visual analytics | Tableau | Tableau’s VizQL engine and Gartner Leader status make it the deepest exploratory analytics option at any price point. | Power BI (at approximately 5× lower per-seat cost) |
| Bespoke custom web visualizations | D3.js | D3.js provides 113,000+ GitHub stars confirming it as the highest-adoption toolkit for any conceivable custom visualization. | Recharts or Nivo (D3-based, React-native components) |
| Python interactive charts and dashboards | Plotly / Dash | Plotly earns the strongest Python community endorsement and supports Python, R, and Julia from one library. | Altair or Bokeh for grammar-of-graphics EDA |
| DevOps / infrastructure monitoring | Grafana | Grafana provides CERN-validated scale, 150+ plugins, and documented DataDog cost displacement. | Prometheus + OpenTelemetry stack |
| Publication-quality scientific figures | Matplotlib | Matplotlib’s 23,700+ peer-reviewed citations (2024) confirm it as the global academic publication standard. | Seaborn (higher-level API built on Matplotlib) |
| Standard web charts, fast and free | Chart.js | Chart.js delivers 2M+ weekly npm downloads, ~60KB gzipped bundle, and MIT license with zero commercial restrictions. | Recharts (React-native, SVG rendering for accessibility) |
| ADA/WCAG-compliant accessible charts | D3.js or Recharts | D3.js and Recharts provide SVG rendering that gives each chart element native DOM accessibility. | Nivo (React-native, SVG-based, accessibility-first) |
| Embedded analytics in a SaaS product | D3.js or Plotly / Dash | D3.js provides full rendering control (ISC license); Dash enables Python-native embedded dashboard architecture. | Chart.js for simpler embedded standard charts |
| Mixed-language team (Python + R + Julia) | Plotly / Dash | Plotly is the only library in this comparison with native API support for all three leading data science languages from one architecture. | Matplotlib (lower interactivity but universal Python/R compatibility) |
Most readers of this article need only one or two of these tools. If your use case is clearly identified in the framework above, skip directly to that entry, reading all seven is only necessary if your organization spans multiple use cases or you are building a comprehensive tooling strategy.
1. Microsoft Power BI: Best Overall: Best for Enterprise and Microsoft-Ecosystem Organizations
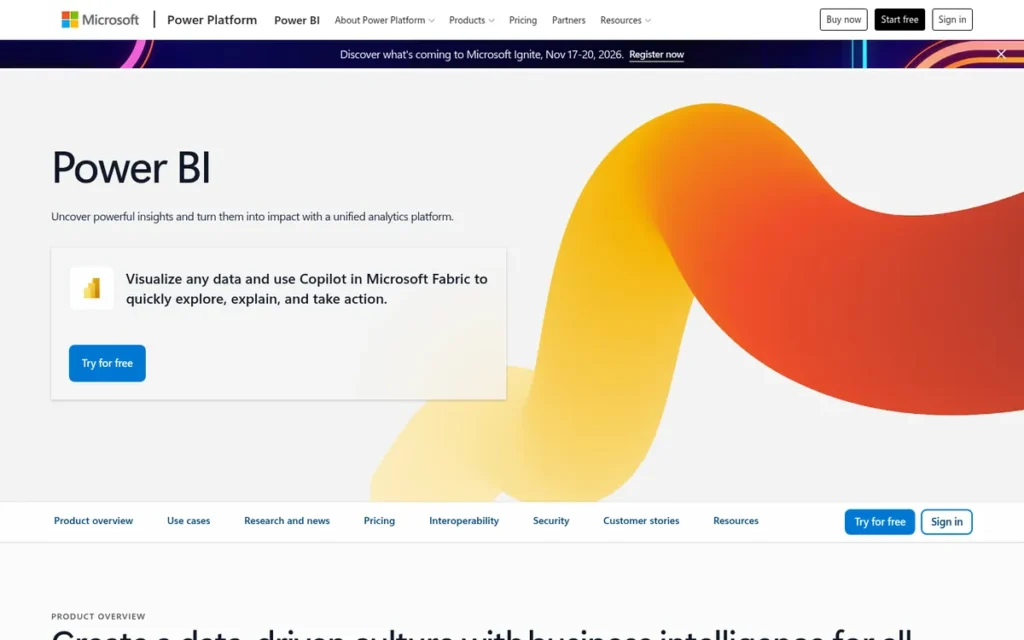
Category: BI Platform, cloud and desktop software for building enterprise dashboards and self-service reports through drag-and-drop interfaces without writing visualization code.
At a Glance
- Category: BI Platform
- Best For: Business analysts and enterprise teams running Microsoft 365, Azure, or Excel who need self-service dashboards without writing code
- Price Range: Free (limited); $14/user/month Pro; $24/user/month Premium Per User, often $0 incremental cost in Microsoft 365 E5 licenses (verified June 2026)
- Primary Strength: Microsoft Power BI earns the highest G2 rating (4.5/5.0, Augmented Tech Labs citing G2, 2025) in this comparison and integrates natively with Excel, Teams, SharePoint, and Azure Synapse.
- Biggest Limitation: Microsoft Power BI lacks Git-native CI/CD pipeline support and IP whitelisting controls, making it a poor fit for DevOps-mature engineering teams that require programmatic dashboard deployment.
- One-Line Summary: Microsoft Power BI is the top-rated enterprise BI platform (G2: 4.5/5.0, Augmented Tech Labs citing G2, 2025) with Pro pricing at $14/user/month that is often zero incremental cost for Microsoft 365 E5 license holders.
- Last Verified: June 2026
Overview
Microsoft Power BI is a full-stack enterprise BI platform from Microsoft Corporation that enables business analysts and non-technical users to build interactive dashboards and self-service reports through drag-and-drop interfaces (connecting to 100+ data sources including Excel, Azure Synapse, Salesforce, and SAP) without writing code.
Microsoft Power BI is available in Desktop (report authoring), Service (web-based collaboration), and Mobile deployment modes, and is now part of Microsoft Fabric, Microsoft’s unified analytics platform spanning data engineering, warehousing, real-time intelligence, and business intelligence. Microsoft Power BI is rated 4.5/5.0 by Augmented Tech Labs in their independent analysis of G2 data (2025) and has been named a Gartner Magic Quadrant Leader for Analytics and Business Intelligence Platforms for the 18th consecutive year as of 2025, ranked highest on Ability to Execute for the seventh consecutive year (Microsoft Fabric community blog, 2025).
Key Features
- 100+ Data Source Connectors: Microsoft Power BI connects to over 100 data sources (including Excel, SQL Server, Azure Synapse, Salesforce, Google Analytics, and SAP) via Power Query, handling ETL and data preparation without requiring SQL or coding skills from the report author.
- DirectQuery Mode: Microsoft Power BI’s DirectQuery capability enables live database connections without importing data, so Power BI dashboards reflect real-time changes without scheduled refresh cycles, critical for operational reporting on frequently updated enterprise datasets.
- DAX Formula Language: Microsoft Power BI’s DAX (Data Analysis Expressions) language powers complex calculated measures, time intelligence functions, and semantic data models, providing analytical depth well beyond basic drag-and-drop aggregation for power users who need custom business calculations.
- Microsoft Copilot AI: Microsoft Power BI embeds Microsoft Copilot for generating natural-language report summaries, creating visuals from plain-English prompts, and providing the Key Influencers visual for automated factor analysis, lowering the analytics skill floor for non-technical self-service deployment (TTMS Power BI features, 2024).
- Microsoft Fabric Integration: Microsoft Power BI’s integration with Microsoft Fabric unifies the platform within a single governance, licensing, and analytics layer spanning data engineering, data warehousing, real-time intelligence, and business reporting.
Best For
Microsoft Power BI is best for business analysts, finance teams, and enterprise data teams whose organizations run Microsoft 365 or Azure, particularly where M365 E5 licensing makes Power BI Pro effectively free, which fundamentally changes the Power BI versus Tableau cost comparison for large enterprises.
Pricing
Before evaluating Power BI’s pricing tiers, answer one question: does your organization hold Microsoft 365 E5 licenses? If yes, Power BI Pro is likely already included at no extra charge, verify with your IT licensing manager. This single question can resolve the entire Power BI versus Tableau cost comparison before that comparison begins.
- Power BI Free: $0/user/month: limited sharing, no collaboration features
- Power BI Pro: $14.00/user/month ($168/user/year billed annually)
- Power BI Premium Per User (PPU): $24.00/user/month
- Power BI Premium Per Capacity: Contact Microsoft for current quote
Microsoft 365 E5 license holders receive Power BI Pro at no incremental cost. Microsoft 365 E3 license holders must purchase Power BI Pro as a separate add-on. Source: Microsoft Power BI Pricing Page, verified June 2026.
Strengths
- Microsoft Power BI is rated 4.5/5.0 by Augmented Tech Labs in their independent analysis of G2 data (2025) (the highest verified user satisfaction score among all enterprise BI platforms in this comparison) and has been named a Gartner Magic Quadrant Leader for the 18th consecutive year as of 2025, ranked highest on Ability to Execute for the seventh consecutive year (Microsoft Fabric community blog, 2025).
- Microsoft Power BI Pro is included at no incremental charge in Microsoft 365 E5 licenses, confirmed by multiple independent comparison sources including Improvado (2024) and Jade Global (2024), a TCO advantage that no competing BI platform can match for organizations already holding M365 E5 agreements, where the licensing cost comparison with Tableau becomes effectively irrelevant.
- Microsoft Power BI’s Copilot AI integration enables non-technical users to generate reports from natural-language prompts and receive automated insight summaries, documented in TTMS Power BI features (2024), extending self-service analytics to the entire business organization, not just trained analysts.
- Microsoft Power BI’s native integration with Excel, Teams, SharePoint, and Azure Synapse eliminates the integration overhead that competing BI tools face in Microsoft-stack organizations, giving Power BI a deployment speed advantage that purely technical feature comparisons consistently underestimate.
Limitations
- CI/CD and Version Control Gap: Microsoft Power BI lacks Git-native deployment workflows and IP whitelisting controls, with production engineering teams in an r/MicrosoftFabric thread (2024, 17 upvotes) reporting these absences as deployment blockers for DevOps-mature organizations requiring programmatic report deployment and code-review processes for dashboard changes.
Users on r/PowerBI noted the practical impact of this gap:
“My opinion on it, I don’t think that’s going to change anytime soon, and I also think there are other tools that fill these gaps when needed, and Power BI is not really for these kinds of applications. In my company we use Power BI and Shiny via RStudio Connect. Power BI we use for straight forward and self-servicing reports. Anything that relies on more business-critical and tight source control and review processes, and full blown CI/CD, we use RStudio Connect for both python and R tools: Dash, Shiny, FlexDashboard, etc. Since these are R and python projects, git source control and CI/CD come naturally.” Posted by u/timeddilation
Takeaway: Power BI’s self-service design philosophy makes it genuinely unsuitable for DevOps-mature engineering teams who require Git-native deployment workflows, practitioners treat the CI/CD gap as a categorical mismatch rather than a feature request to wait on.
- Citizen BI Design Ceiling: Microsoft Power BI is optimized for “citizen BI” users (one r/MicrosoftFabric commenter (2024) noted it is “not ready yet for fully fledged devs” in SaaS configuration contexts) meaning ISV partners and platform engineering teams who need infrastructure-level control will hit a meaningful ceiling that standard BI use cases never expose.
- Microsoft Ecosystem Lock-In: Microsoft Power BI’s deep integration with Microsoft products (its primary competitive strength for M365 organizations) simultaneously creates material switching costs and dependency on Microsoft’s licensing decisions, making Power BI a poor fit for organizations running AWS-native, Google Cloud, or non-Microsoft data stacks.
Verdict
Microsoft Power BI ranks first in this comparison over Tableau because its G2 rating (4.5/5.0, Augmented Tech Labs citing G2, 2025) exceeds Tableau’s (4.4/5.0), its addressable audience covers all Microsoft 365 organizations, and its Pro pricing ($14/user/month, often $0 in M365 E5) is approximately five times lower than Tableau Creator ($70–$75/user/month). Microsoft Power BI’s native Copilot AI, 100+ data connectors, and Excel-familiar drag-and-drop interface deliver a low-friction onboarding path for non-technical business users in the Microsoft ecosystem. Engineering teams with DevOps-native deployment requirements, or organizations outside the Microsoft stack, should evaluate Tableau, Grafana, or code-first libraries before committing to Power BI’s ecosystem dependencies.
2. Tableau: Best for Deep Visual Data Exploration and Enterprise Analytics Storytelling
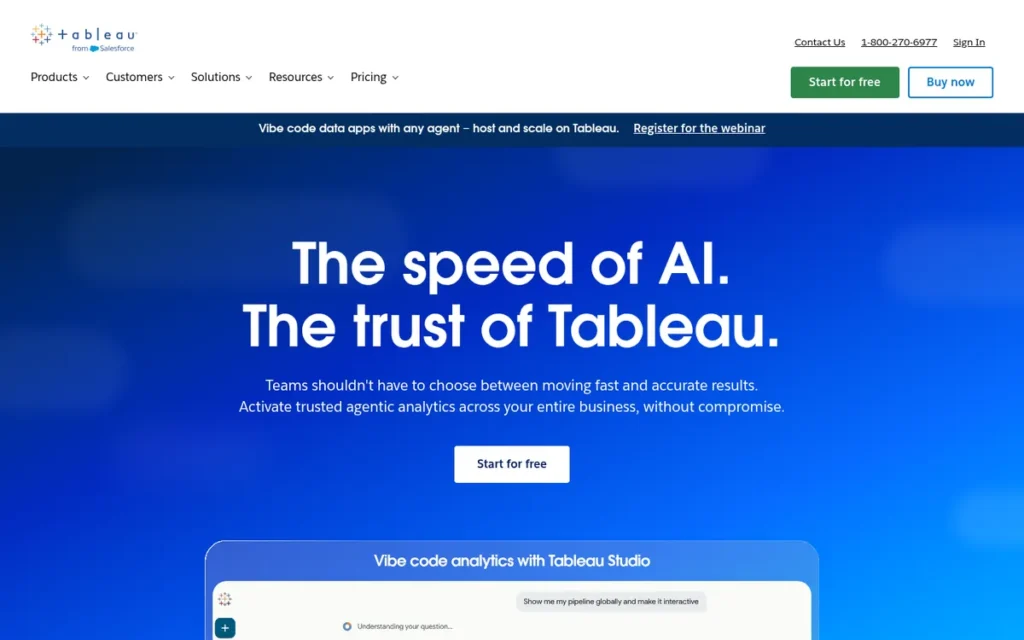
Category: Visual Analytics Platform, enterprise drag-and-drop software for exploring, analyzing, and presenting complex data through interactive dashboards, with a wider chart type range and deeper exploratory analytics capability than standard BI platforms.
At a Glance
- Category: Visual Analytics Platform
- Best For: Data analysts and BI teams needing deep visual exploration, complex analytical storytelling, and the widest available chart type range, particularly in Salesforce-ecosystem organizations
- Price Range: Public: Free (public data only). Viewer: ~$15/user/month. Explorer: ~$42/user/month. Creator: ~$70–$75/user/month. Server (self-hosted): enterprise quote required. (Verified June 2026)
- Primary Strength: Tableau’s proprietary VizQL engine translates drag-and-drop visual exploration into live database queries, enabling deeper analytical investigation than any other enterprise BI platform, with the broadest chart type range and a visual quality standard that even Tableau critics acknowledge has no open-source equivalent.
- Biggest Limitation: Tableau Creator at approximately $70–$75/user/month is roughly five times more expensive than Microsoft Power BI Pro, creating substantial budget pressure at organizational scale and a documented sunk-cost renewal dynamic in enterprise deployments.
- One-Line Summary: Tableau is the enterprise visual analytics platform with the deepest exploratory data analysis capabilities, earning a G2 rating of 4.4/5.0 (Augmented Tech Labs citing G2, 2025) and Gartner Magic Quadrant Leader status, with a VizQL quality moat practitioners acknowledge has no open-source equivalent.
- Last Verified: June 2026
Overview
Tableau is a visual analytics platform owned by Salesforce (acquired in 2019 for $15.7 billion, per Jade Global, 2024) that enables enterprise analysts to explore complex datasets through drag-and-drop interactions powered by its proprietary VizQL (Visual Query Language) engine, automatically translating visual actions into optimized database queries without requiring SQL.
Tableau supports the broadest chart type range in the commercial BI category, including treemaps, choropleth maps, motion charts, Gantt charts, and box plots, alongside live and in-memory data connections to 100+ sources spanning legacy on-premises warehouses and modern cloud data stacks including Snowflake, Google Sheets, and Amazon Athena. Tableau is rated 4.4/5.0 by Augmented Tech Labs in their independent analysis of G2 data (2025) and has held Gartner Magic Quadrant Leader status for Analytics and Business Intelligence Platforms alongside Microsoft Power BI for multiple consecutive years, one of only two commercial tools occupying the top analyst tier.
Key Features
- VizQL Engine: Tableau’s VizQL (Visual Query Language) engine automatically translates drag-and-drop visual exploration into optimized database queries, enabling non-SQL users to navigate complex, multi-dimensional datasets and perform analytical drill-downs without writing any code, the patented foundation of Tableau’s competitive quality moat, documented on the Tableau official VizQL page.
- Broadest Chart Type Range: Tableau supports the widest chart type variety in the commercial BI category (including treemaps, choropleth and flow maps, motion charts, Gantt charts, box plots, and bullet charts) plus live query connections to Presto, Google Analytics, Hadoop, Amazon Athena, Snowflake, and Salesforce (FusionSpan, 2024).
- Tableau Prep Builder: Tableau’s dedicated visual ETL interface cleans and reshapes data upstream of dashboard creation, reducing dependence on separate data engineering pipelines for analyst-driven data preparation workflows.
- Tableau Pulse AI: Tableau’s AI-powered metric insights feature automatically detects anomalies, generates natural-language narratives, and surfaces trend summaries, extending Tableau’s analytics from manual exploration to automated insight discovery embedded in the Salesforce ecosystem.
- Salesforce and Einstein AI Integration: Tableau’s native Salesforce data connectivity and Einstein AI trust layer enable direct CRM visualization with enterprise-grade AI governance for regulated industries within Salesforce’s security and compliance framework.
Best For
Tableau is best for data analysts, analytics engineers, and business intelligence teams where deep visual data exploration, complex analytical storytelling, and the widest available chart type variety justify the premium cost, particularly in Salesforce CRM-ecosystem organizations where native data connectivity creates immediate analytical value.
Pricing
- Tableau Public: Free: public datasets only, no data privacy protection
- Tableau Viewer: ~$15/user/month: view-only access on Tableau Cloud
- Tableau Explorer: ~$42/user/month: limited authoring on Tableau Cloud
- Tableau Creator: ~$70–$75/user/month: includes Tableau Desktop, Prep Builder, and Cloud authoring (verified range from baserow.io and valiotti.com, 2025–2026)
- Tableau Server (self-hosted): Role-based or core-based licensing requiring enterprise quote
Tableau Creator at approximately $70–$75/user/month is roughly five times more expensive than Power BI Pro ($14/user/month). At 50 users, Tableau Creator costs approximately $42,000–$45,000/year versus Power BI Pro at approximately $8,400/year, a gap that demands explicit justification based on actual use case requirements before procurement. Source: Tableau Pricing Page, verified June 2026.
Strengths
- Tableau is rated 4.4/5.0 by Augmented Tech Labs in their independent analysis of G2 data (2025) and has held Gartner Magic Quadrant Leader status for Analytics and Business Intelligence Platforms for multiple consecutive years, one of only two commercial BI tools occupying the top Gartner tier alongside Microsoft Power BI.
- Tableau’s VizQL engine holds a genuine, patented technological moat: even vocal Tableau critics on r/datascience (2022) state “I find no open-source alternatives that rival the visual fidelity and enterprise-readiness of Tableau”, confirming that Tableau’s quality position for demanding visual analytics contexts has no free or open-source substitute.
- Tableau supports the widest chart type range of any commercial BI platform in this comparison (including Gantt, motion charts, choropleth maps, treemaps, and box plots) plus 100+ live and extract data source connections covering both legacy on-premises and modern cloud-native data architectures (FusionSpan, 2024).
- Tableau’s $15.7 billion acquisition by Salesforce in 2019 (Jade Global, 2024) provides CRM ecosystem distribution and Einstein AI governance infrastructure, a combination of commercial scale and AI compliance capability unavailable from any other BI vendor in this comparison.
Limitations
- Pricing Multiplier: Tableau Creator at approximately $70–$75/user/month is roughly five times the cost of Microsoft Power BI Pro ($14/user/month), with an r/datascience commenter (2022) describing it as “an invitation to having a sunk cost mentality when your management decided to purchase Tableau for a year.”
Users on r/tableau shared how the competitive landscape has shifted:
“5-8 years ago, Tableau was far ahead of the competition in features and ease of use. Now it’s much closer on the visualization/report building side of things and Tableau lags to provide capabilities to clean data well. The cost was justified when Tableau had a massive lead, but the playing field is more even on features and the cost difference is harder to sell vs the competition.” Posted by u/mplsbro
Takeaway: Tableau’s pricing premium has become structurally harder to defend as Power BI and other competitors have closed the feature gap, practitioners who tracked the market over multiple years report that internal cost justification has grown meaningfully more difficult.
- Depth-as-Overkill Paradox: Tableau’s analytical depth is genuinely underutilized by organizations whose primary use case is straightforward executive dashboards (the same outcome achievable with Power BI at approximately one-fifth the cost) with practitioners on r/datascience (2022) noting that most business stakeholders only need simple charts that do not require Tableau’s full exploratory capability.
- No Git-Native CI/CD: Tableau lacks the Git-native CI/CD integration that DevOps-oriented teams require for programmatic report deployment, a limitation shared with Power BI that is a genuine production concern for engineering-led analytics organizations building dashboard-as-code workflows.
Verdict
Tableau is the enterprise visual analytics standard for organizations requiring the deepest available exploratory data analysis capabilities, earning a G2 rating of 4.4/5.0 (Augmented Tech Labs citing G2, 2025) and Gartner Magic Quadrant Leader status, with a VizQL technological moat that even Tableau critics acknowledge has no open-source equivalent. Tableau is the clear choice when visualization depth, data storytelling quality, and complex analytical exploration justify the approximately five-times premium over Power BI, particularly for Salesforce-ecosystem organizations where native CRM integration delivers immediate analytical value. Organizations primarily running Microsoft 365 should evaluate Power BI Pro first, where equivalent self-service reporting is available at approximately one-fifth the per-seat cost and often at zero incremental charge under M365 E5 licensing.
3. D3.js: Best for Bespoke, Award-Quality Custom Web Visualizations
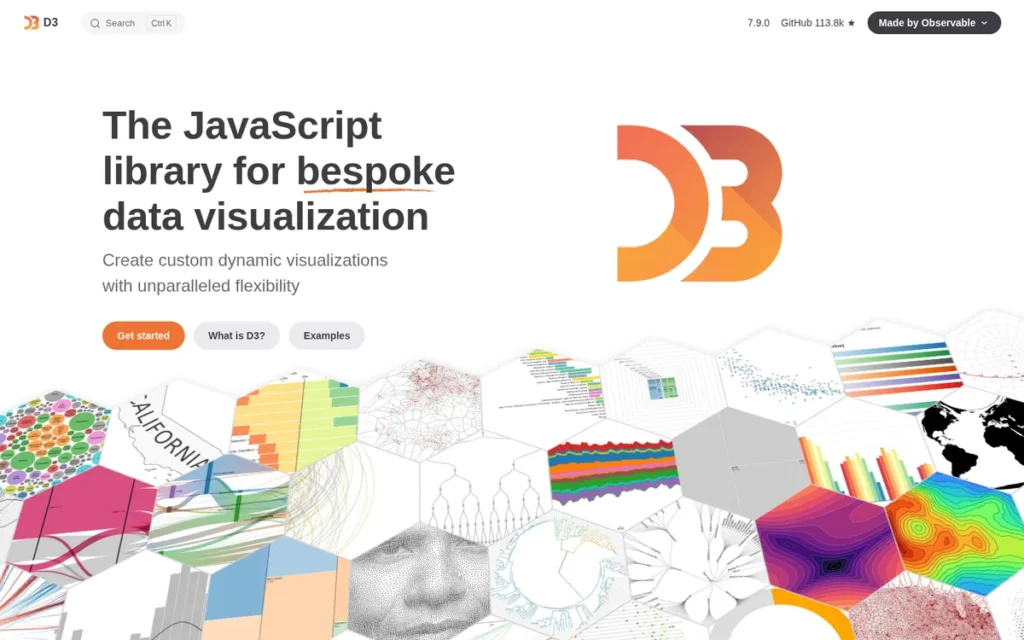
Category: JavaScript Visualization Toolkit, a low-level library of data-binding and mathematical primitives for building fully custom web visualizations from scratch, not a library of pre-built chart components.
At a Glance
- Category: JavaScript Visualization Toolkit
- Best For: Frontend developers and dataviz specialists building bespoke, one-of-a-kind interactive web visualizations where standard chart templates are insufficient, and developers who want foundational JavaScript visualization knowledge
- Price Range: Free: open source under ISC license, no commercial licensing required at any scale
- Primary Strength: D3.js has accumulated 113,000+ GitHub stars (GitHub repository, 2025) (the highest adoption metric of any tool in this comparison) and serves as the internal engine underlying Recharts, Nivo, Victory, and most major JavaScript charting frameworks.
- Biggest Limitation: D3.js’s official documentation and all current examples have migrated to Observable notebook format, creating a documented adoption barrier for production web developers who need standard HTML/JavaScript implementations.
- One-Line Summary: D3.js is the most capable JavaScript toolkit for bespoke custom web visualizations (with 113,000+ GitHub stars (GitHub repository, 2025) confirming the highest adoption of any library in this comparison) and the foundational internal engine of Recharts, Nivo, and Victory.
- Last Verified: June 2026
Overview
D3.js (Data-Driven Documents) is a free, open-source JavaScript library created by Mike Bostock in 2011 during his work with The New York Times Graphics team (FusionCharts JS library comparison, 2024) that binds data to DOM elements and provides scales, axes, geographic projections, layout algorithms, force simulations, and transition primitives for building completely custom interactive visualizations, not from pre-built chart templates.
D3.js has accumulated 113,000+ GitHub stars (GitHub repository, 2025), the highest community adoption metric of any visualization library or software in this entire comparison, including commercial BI platforms. D3.js is the internal dependency underlying most major JavaScript charting frameworks including Recharts, Nivo, and Victory, with r/Angular2 developers confirming in 2024 that “most of the other libraries are D3 wrappers.”
Key Features
- DOM Data Binding: D3.js provides data-join functions that bind arbitrary datasets to DOM elements and enable reactive updates re-rendering only changed elements when underlying data changes, the foundational pattern underlying Recharts, Nivo, and Victory throughout the JavaScript visualization ecosystem.
- Complete Scale and Axis System: D3.js includes linear, logarithmic, ordinal, time, and band scale functions plus automatic axis generators handling tick placement, number formatting, and domain-to-range mapping for any chart type, mathematical primitives unavailable in pre-built chart libraries at any price tier.
- 12+ Geographic Projections: D3.js supports Mercator, Albers, orthographic, stereographic, and 12+ additional geographic projection types with full GeoJSON and TopoJSON rendering, making D3.js the only free library with production-ready choropleth mapping and globe-projection visualization for web applications.
- Advanced Layout Algorithms: D3.js provides force simulation, tree layout, cluster layout, partition layout, and Voronoi diagram generators, enabling network graphs, organizational hierarchies, and spatial distribution charts that no pre-built chart library offers at any price tier.
- SVG Rendering and Accessibility: D3.js renders SVG output by default, giving every chart element full CSS styleability, DOM-level event handling, and screen-reader accessibility, structural advantages over Canvas-based libraries that are critical for ADA/WCAG-regulated applications.
Best For
D3.js is best for frontend developers, dataviz specialists, and data journalism teams who require full creative and technical control over visualization design, where standard chart templates cannot achieve the required bespoke appearance, interaction model, geographic complexity, or animation quality.
Here is the most consequential fact about the JavaScript visualization ecosystem: if you use Recharts, Nivo, or Victory in your React application, you are already running D3.js under the hood. D3.js is not a competing alternative to those libraries, it is their internal engine. Learning D3.js is not only about using D3.js directly; it is about understanding why every other JavaScript chart library behaves the way it does.
Pricing
D3.js is completely free under the ISC license (a permissive BSD-style open-source license) with no commercial licensing tiers, premium features, or official paid support at any scale. The real total cost of ownership is developer time: productive D3.js competence typically requires 40–100+ hours of learning investment, making human capital the primary cost calculation. (D3.js official site, verified June 2026)
Strengths
- D3.js has accumulated 113,000+ GitHub stars (GitHub repository, 2025): the highest community adoption metric of any visualization tool in this entire comparison, including commercial BI platforms, reflecting 15 years of sustained production use across multiple JavaScript ecosystem generations.
- D3.js was created by Mike Bostock in 2011 during his work with The New York Times Graphics team and is used by the NYT, Washington Post, Bloomberg, and FiveThirtyEight for award-winning editorial data journalism (FusionCharts, 2024; CreateWithData, 2024), a production credential confirming D3.js’s capability ceiling for the most demanding visual storytelling contexts in existence.
- D3.js is the internal dependency for most major JavaScript React charting libraries (including Recharts, Nivo, and Victory) with r/Angular2 community developers confirming in 2024 that “most of the other libraries are D3 wrappers,” meaning D3.js knowledge is foundational to understanding the entire JavaScript visualization ecosystem.
- D3.js’s SVG rendering architecture gives each visual element full CSS styleability and native DOM accessibility, with a developer on r/webdev (2022) citing SVG as “basically the only reason I moved to D3” from Chart.js, a critical structural advantage for ADA/WCAG compliance requirements in public-sector deployments.
Limitations
- Observable Documentation Lock-In: D3.js’s official documentation and all current examples have migrated to Observable notebook format (a documented adoption barrier for production web developers) with a data visualization educator on r/d3js (2023) concluding after years of teaching D3 that in its current form “it’s just not viable” for standard HTML/JavaScript development contexts where every official page and manual entry assumes the Observable runtime.
- Steep Learning Curve: D3.js requires 40–100+ hours to reach productive competence (a prohibitive investment for teams needing standard charts on a delivery timeline) while Chart.js, Recharts, and Plotly.js provide equivalent standard chart output in a fraction of that time for teams whose use cases are covered by standard chart types.
- No Pre-Built Chart Components: D3.js deliberately provides no ready-made bar charts, line charts, or pie chart components (developers must construct all chart types from mathematical primitives) adding significant development overhead relative to all other libraries in this comparison for teams whose visualization needs are covered by standard chart templates.
This aligns with community sentiment on r/datascience:
“If you want to learn it as primary visualisation tool, I think it is bad idea. Python libraries and Tableau is much better for fast prototyping and visualisation of the basic graphs, even if you need web version it will be more appropriate to use library on top of d3 where you’ll need to push data to method and you’ll receive immediate ready-to-use output. But if you need to create something impressive and much more complex than Tableau – then you’ll probably need d3js. But in most everyday use-cases it will be just a burden.” Posted by u/Dracontis
Takeaway: Experienced data practitioners consistently recommend D3.js only for genuinely complex bespoke visualization requirements, teams whose use cases can be met by Plotly, Chart.js, or D3 wrapper libraries should not absorb D3’s learning investment.
Verdict
D3.js ranks third in this comparison, above all other code-first libraries, because its 113,000+ GitHub stars represent the highest community adoption signal of any visualization tool in this comparison, including commercial BI platforms, and its foundational role as the internal dependency of Recharts, Nivo, and Victory reflects ecosystem influence beyond its direct user count. D3.js remains the ceiling of what is achievable in JavaScript data visualization, the library that defines the outer limit of custom chart design for the web, with 113,000+ GitHub stars confirming it has not been superseded despite 15 years of competing alternatives. Developers who need standard bar, line, or pie charts should start with Chart.js or Recharts, both built on D3.js internals, returning to D3.js only when pre-built component limits are genuinely reached.
4. Plotly / Dash: Best for Python Developers Building Interactive Charts and Full Dashboards
Category: Python Interactive Charting Library, an open-source library for creating browser-native interactive charts from Python, R, or Julia, with Dash as an optional web application framework for building full analytics dashboards without JavaScript expertise.
At a Glance
- Category: Python Interactive Charting Library
- Best For: Python data scientists and analytics teams needing browser-native interactive charts and dashboard apps without writing JavaScript, and mixed-language data teams spanning Python, R, and Julia
- Price Range: Plotly library and Dash open source: Free (MIT license). Dash Enterprise: Contact sales, pricing not publicly listed (verified June 2026)
- Primary Strength: Plotly produces browser-native interactive charts from Python with hover tooltips, zoom, and standalone HTML export without requiring any JavaScript knowledge, rated “far ahead of other options” by practitioners on r/learnpython (2022).
- Biggest Limitation: Plotly Dash Enterprise has opaque pricing with no self-serve upgrade path, creating architectural commitment risk for teams building on free Dash open source before validating production deployment costs.
- One-Line Summary: Plotly is the leading Python interactive visualization library (rated “far ahead of other options” on r/learnpython (2022)) with 30+ chart types across Python, R, and Julia, browser-native interactivity, and standalone HTML export at zero open-source cost.
- Last Verified: June 2026
Overview
Plotly is an interactive data visualization ecosystem founded in Montreal, Canada in 2013, comprising Plotly Python (and equivalent libraries for R and Julia), Plotly.js (the JavaScript rendering engine), Plotly Express (a high-level one-line Python API), and Dash (a Python web application framework for building analytics dashboards without writing JavaScript).
Plotly’s architecture serializes Python figure specifications to JSON, which Plotly.js renders in the browser, giving Python data scientists full browser-native interactivity including hover tooltips, zoom, pan, and crossfilters without writing any JavaScript code. Plotly supports 30+ chart types spanning standard statistical charts, 3D scientific visualizations, financial charts, and choropleth maps (PyPI Plotly package, 2025), and exports self-contained interactive HTML files that preserve all interactivity without requiring any server infrastructure.
Key Features
- Browser-Native Interactivity from Python: Plotly generates hover tooltips, zoom controls, pan, legend toggling, and axis selection directly from Python, R, or Julia code, with Plotly.js handling all browser rendering so developers write zero JavaScript to achieve client-side interactivity.
- Plotly Express One-Line API: Plotly Express provides a high-level Python API that produces fully interactive animated charts, sunburst diagrams, and choropleth maps from pandas DataFrames in a single line of Python code, making complex visualization types accessible without configuration overhead.
- 30+ Scientific Chart Types: Plotly supports 30+ chart types including 3D surface plots, contour charts, ternary diagrams, polar charts, violin plots, and financial OHLC charts (PyPI Plotly package, 2025), covering scientific visualization needs well beyond what any commercial BI platform in this comparison provides.
- Standalone HTML Export: Plotly exports self-contained interactive HTML files preserving all zoom, hover, filter, and export interactivity without requiring server infrastructure, validated in production by a practitioner plotting 75 HVAC sensors at 1-second intervals in an r/Python thread (u/Cynyr36, 2022).
- Dash Web Application Framework: Dash extends Plotly into a full Python web application framework, enabling multi-page analytics dashboards with dropdowns, sliders, date pickers, and server-side callback logic, all written entirely in Python with no JavaScript required for standard dashboard functionality.
Best For
Plotly/Dash is best for Python data scientists, data engineers, and analytics teams who need interactive, browser-shareable chart output from Python workflows, and for teams building internal analytics web applications who want to avoid JavaScript development through Dash’s Python-only component framework with server-side callback architecture.
Pricing
- Plotly Python / R / Julia library: Free, open source (MIT license)
- Dash open source: Free, open source
- Chart Studio Cloud: Free tier for public charts; paid tiers for private charts and team features
- Dash Enterprise: Commercial license: pricing not publicly listed; contact Plotly sales for quote
The jump from free Dash open source to Dash Enterprise is a documented community concern, multiple users on the Plotly community forum (2024) flag the absence of a transparent self-serve upgrade path as a decision barrier when evaluating production deployment. Teams building on free Dash should initiate pricing conversations with Plotly before making architectural commitments. (Verified June 2026, Plotly Pricing Page)
Strengths
- Plotly earned the strongest community endorsement among Python visualization libraries in this comparison: u/Ralwus on r/learnpython (17 upvotes, 2022) stated “Plotly is so far ahead of the other options (easier to use, just as customizable, and offers interactivity if you want to show it on a website”) a sentiment consistently replicated across r/datascience and r/Python.
- Plotly’s standalone HTML export was validated in a documented production use case on r/Python (u/Cynyr36, 2022): 75 sensors from HVAC equipment at 1-second intervals were plotted and exported as a shareable interactive HTML file, confirming practical time-series performance without requiring any server infrastructure for distribution.
- Plotly provides cross-language chart API support across Python, R, and Julia from a single unified library architecture (Plotly official documentation, 2025), the only visualization library in this comparison enabling consistent interactive output across all three leading data science languages, reducing tool sprawl for mixed-language data teams.
- Dash, Plotly’s web application framework, enables full multi-page analytics dashboards with interactive components and server-side callbacks built entirely in Python without JavaScript, confirmed as a production framework across data science and ML deployment workflows (Plotly community forum, 2024).
Limitations
- Dash Enterprise Pricing Opacity: Plotly’s most consequential trade-off is the absence of a transparent upgrade path from free Dash to commercial production deployment, multiple Plotly community forum discussions (2024) confirm teams face a significant pricing gap with no self-serve commercial option, requiring sales engagement before understanding total cost and creating architectural commitment risk for teams building on the free version.
- Large Dataset Performance Ceiling: Plotly handles typical data science datasets efficiently, but extremely large datasets (tens of millions of data points) require server-side aggregation, WebGL rendering configurations, or data decimation strategies, adding architectural complexity beyond Plotly’s out-of-box defaults that teams should plan for before production deployment.
- Mismatch for Static Publication Use Cases: Plotly’s interactive-first design is overkill for teams whose primary output is static publication figures for academic journals, where Matplotlib provides more precise print-format DPI control, zero deployment considerations, and direct support for every peer-reviewed journal format requirement.
Verdict
Plotly is the leading interactive visualization library for Python data scientists (earning the strongest community endorsement of any Python charting tool in this comparison) and the Dash framework extends it to full analytics web applications at zero open-source licensing cost. Plotly is the recommended choice for any Python workflow producing chart output intended for browser viewing, stakeholder sharing, or web embedding, where Matplotlib’s static-first design or Seaborn’s EDA focus are insufficient. Teams requiring production Dash deployment with authentication, multi-page architecture, and enterprise governance should initiate Dash Enterprise pricing conversations with Plotly before making architectural commitments on the free open-source version.
5. Grafana: Best for DevOps and SRE Teams Monitoring Infrastructure and Operational Systems
Category: Observability Platform, open-source and cloud-managed software for real-time monitoring of infrastructure metrics, application logs, distributed traces, and system health.
Important: Grafana is an observability platform, not a business intelligence tool. If your goal is building financial reports, executive dashboards, or self-service analytics for non-technical users, evaluate Microsoft Power BI (#1) or Tableau (#2) instead. Grafana monitors infrastructure, not business operations.
At a Glance
- Category: Observability Platform
- Best For: DevOps engineers and SREs monitoring cloud infrastructure and application performance, especially teams migrating from DataDog or New Relic where per-host licensing cost is a primary concern
- Price Range: OSS: Free (self-hosted). Cloud Free: $0 (usage-limited). Cloud Pro: $8/active user/month + usage-based charges. Enterprise Plugins: $55/user/month. (Verified June 2026)
- Primary Strength: Grafana’s 150+ data source plugins combine metrics, logs, and traces from any infrastructure backend into a single real-time observability dashboard, validated at CERN scale monitoring the world’s largest computer grid (Grafana Labs blog, January 2025; GrafanaCon 2024).
- Biggest Limitation: Grafana’s full LGTM observability stack (Loki, Mimir, Tempo, Prometheus) requires dedicated DevOps engineering resources to configure and maintain at production scale, making “simple free alternative” framing misleading for teams without infrastructure operations expertise.
- One-Line Summary: Grafana is the default infrastructure observability platform for DevOps and SRE teams (validated at CERN’s planetary-scale computing grid, with 60,000+ GitHub stars and approximately $490M in funding (TechCrunch, August 2024)) and the primary community-recommended cost alternative to DataDog and New Relic.
- Last Verified: June 2026
Overview
Grafana is an open-source observability and visualization platform developed by Grafana Labs (founded 2014, Stockholm; Velodb, 2024) that enables DevOps engineers and SRE teams to build real-time dashboards for monitoring infrastructure metrics, application logs, distributed traces, and system health across any combination of data backends.
Grafana’s LGTM stack (Loki (logs), Grafana (visualization), Tempo (traces), and Mimir (metrics)) provides a unified, self-hosted observability pipeline competing directly with DataDog and New Relic at dramatically lower cost. Grafana has accumulated 60,000+ GitHub stars (Velodb, 2024; Softteco, 2024), raised approximately $490M in total funding across its Series C ($220M, 2021, at a $3B valuation) and Series D extension ($270M, 2024, at a $6B valuation) (TechCrunch, August 2024), and serves 5,000+ paying enterprise customers including NASA, Goldman Sachs, Bloomberg, and CERN (TechCrunch, 2024).
Key Features
- 150+ Data Source Plugins: Grafana supports 150+ data source plugins: including Prometheus, Loki, InfluxDB, Elasticsearch, and AWS CloudWatch, plus Enterprise tier connectors for Datadog, Snowflake, ServiceNow, and New Relic, enabling single-pane-of-glass dashboards combining heterogeneous infrastructure backends in a single panel.
- LGTM Observability Stack: Grafana’s LGTM stack provides a complete self-hosted observability pipeline: Loki handles log aggregation, Mimir handles metrics storage at Prometheus-compatible scale, Tempo handles distributed tracing, and Grafana provides unified visualization and alerting across all three observability data types (logs, metrics, and traces).
- Alerting and Incident Response: Grafana’s alerting system enables automated threshold-based notifications across Slack, PagerDuty, email, and OpsGenie, converting Grafana dashboards from passive reporting surfaces into active incident detection and response systems.
- Grafana Cloud Managed SaaS: Grafana Cloud provides a fully managed SaaS deployment with usage-based pricing, a free tier with meaningful observability limits, and enterprise SLA options, eliminating infrastructure management overhead for teams that prefer not to self-host the LGTM stack.
- Enterprise Governance: Grafana Enterprise adds role-based access control (RBAC), audit logging, data source permissions, PDF reporting, and 24/7 commercial support, governance capabilities required for regulated enterprise deployments in financial services, healthcare, and government sectors.
Best For
Grafana is best for DevOps engineers, site reliability engineers, and platform engineering teams who need real-time visibility into cloud infrastructure, application performance, and distributed system health, particularly organizations evaluating or actively migrating from DataDog or New Relic where per-host or per-metric licensing cost is a primary driver.
Pricing
- Grafana OSS: Free, fully featured, self-hosted: no usage limits, no paid tier required for any feature
- Grafana Cloud Free: $0/month with usage limits on included metrics series, log volume, and trace data
- Grafana Cloud Pro: $8/active user/month above free tier thresholds, plus usage-based charges: metrics ($6.50/1,000 active series), logs ($0.05/GB processing; $0.40/GB write; $0.10/GB retention)
- Grafana Enterprise Plugins: $55/user/month for commercial data source connectors
Teams evaluating Grafana Cloud should model expected Prometheus-compatible active series counts and test node_exporter cardinality before committing, high-cardinality Prometheus metric streams are the most common source of unexpected DPM cost escalation reported in r/devops and r/grafana. Source: Grafana Pricing, verified June 2026.
Strengths
- CERN uses Grafana and Mimir to monitor the world’s largest computer grid: confirmed by both a Grafana Labs blog post (January 2025) and a GrafanaCon 2024 presentation, validating Grafana’s production scale ceiling for any commercial infrastructure environment on Earth.
- Grafana Labs raised approximately $490M in total funding, reaching a $6B valuation in its 2024 Series D extension (TechCrunch, August 2024), with 5,000+ paying enterprise customers including NASA, Goldman Sachs, Bloomberg, and DigitalOcean, confirming commercial viability and long-term maintenance investment well beyond typical open-source project governance.
- Grafana’s 60,000+ GitHub stars (Velodb, 2024) reflect sustained developer adoption, and a documented production deployment on r/devops (u/sewerneck, 2025) processes 25TB of logs per day and 30 million in-memory metrics series on a self-hosted LGTM stack managed by one engineer, confirming extreme scale is achievable at open-source operating cost.
- Grafana Cloud Pro at $8/user/month provides managed observability that community members directly compare as “cheaper than DataDog by a country mile” (u/tobylh, r/grafana, 2023), validated by active production migrations from DataDog pricing documented in the same thread.
Limitations
- LGTM Infrastructure Complexity: Grafana’s most consequential trade-off is that “simple and free” framing misrepresents the full operational investment (as documented by u/zsh_n_chips on r/devops (2025): “it’s the backend data sources that are not fun or cheap) there are quite a few moving parts that become quite complex to deal with over time.” Teams should staff for backend observability engineering, not just dashboard configuration.
Users on r/sre documented how this staffing dependency plays out in production:
“Depends who creates the dashboards. In a 1000 person company we used Grafana originally but very few of the wider teams created dashboards themselves as they found it too hard. Eventually, the 2 guys looking after the LGTM stack left and the company moved to DataDog. With zero training, the uptake of the tool by all teams has been night and day difference, dashboards (quality ones) for every teams and self service. I love how powerful Grafana is but for end user ease of use, DataDog no question.” Posted by u/andyr8939
Takeaway: Grafana’s power-user ceiling creates institutional fragility, when the engineers who configured the LGTM stack depart, organizations routinely migrate to fully managed alternatives rather than rebuild that institutional knowledge from scratch.
- Grafana Cloud DPM Cost Escalation: Grafana Cloud’s usage-based pricing for active Prometheus metrics series and DPM (data points per minute) can escalate unexpectedly when teams enable high-cardinality exporters, with community members in r/devops and r/grafana reporting budget surprises after enabling node_exporter, making pre-deployment active series cost modeling essential before committing to Grafana Cloud.
- Categorical Mismatch for BI Use Cases: Grafana is an observability and operational monitoring tool (not a business analytics, financial reporting, or executive dashboard platform) and placing Grafana in the same evaluation as Power BI or Tableau is a systematic category error that leads both DevOps engineers and business analysts to incorrect conclusions about its capabilities and fit.
Verdict
Grafana is the default infrastructure observability platform for DevOps and SRE teams in 2026, the only tool in this comparison validated at CERN’s planetary-scale computing grid and the primary community-recommended cost alternative to DataDog and New Relic, with 5,000+ paying enterprise customers (TechCrunch, August 2024) confirming commercial viability at production scale. Grafana ranks fifth in this comparison, above Matplotlib and Chart.js, because its $490M in verified funding, 5,000+ enterprise customers, and CERN-validated scale represent stronger institutional backing than any open-source library in this analysis, and its 60,000+ GitHub stars confirm broad adoption in a commercially critical DevOps/SRE segment. Teams whose primary need is business analytics dashboards, executive reporting, or financial analysis should evaluate Microsoft Power BI or Tableau rather than Grafana, regardless of Grafana’s open-source cost appeal.
6. Matplotlib: Best for Scientific Research, Academic Publication, and Python Visualization Fundamentals
Category: Python Scientific Charting Library, a foundational Python plotting library for creating static, animated, and publication-quality charts, and the rendering backend underlying Seaborn, Pandas, and scikit-learn visualization utilities.
At a Glance
- Category: Python Scientific Charting Library
- Best For: Academic researchers needing publication-quality figures for peer-reviewed journals, and any Python developer using Seaborn, Pandas, or scikit-learn, where Matplotlib foundation knowledge is required to customize and debug visualization behavior
- Price Range: Free: open source under BSD-compatible license, no commercial tiers at any scale (verified June 2026)
- Primary Strength: Matplotlib has been cited in over 23,700 peer-reviewed papers as of 2024 (Matplotlib official acknowledgment page, matplotlib.org/stable/project/citing.html) (the most cited scientific visualization library globally) and serves as the rendering backend for Seaborn, Pandas .plot(), and scikit-learn.
- Biggest Limitation: Matplotlib’s static-first design and verbose API require significantly more code than Seaborn or Plotly for equivalent visual output, with no browser-native interactivity for web-facing or stakeholder-sharing use cases.
- One-Line Summary: Matplotlib is the most academically validated visualization library in existence (cited in 23,700+ peer-reviewed papers as of 2024 (Matplotlib official acknowledgment page)) backed by NumFOCUS alongside NumPy and Pandas, and the rendering engine underlying Seaborn, Pandas .plot(), and scikit-learn.
- Last Verified: June 2026
Overview
Matplotlib is the foundational Python data visualization library, a free, open-source, NumFOCUS-sponsored project created by John D. Hunter in 2003, that produces static, animated, and interactive charts with complete programmatic control over every visual element, and serves as the underlying rendering backend for Seaborn, Pandas .plot(), and scikit-learn’s visualization utilities.
Matplotlib supports two API styles: the MATLAB-compatible pyplot interface for quick interactive plotting and the explicit object-oriented API for precise, reproducible figure construction, both exporting to all standard publication formats including PNG, PDF, SVG, EPS, and TIFF at any DPI resolution. Matplotlib has been cited in over 23,700 peer-reviewed papers as of 2024 (Matplotlib official acknowledgment page, matplotlib.org/stable/project/citing.html), is used by NASA, CERN, and scientific research institutions worldwide, and has maintained continuous active development under NumFOCUS governance for 20+ years, the longest institutional track record of any tool in this comparison.
Key Features
- Dual API Architecture: Matplotlib provides both the MATLAB-compatible pyplot interface for rapid interactive plotting and the explicit object-oriented API for programmatic figure composition, enabling both quick exploratory analysis scripts and rigorous, reproducible publication-quality figures within the same library.
- Publication-Format Export: Matplotlib exports to all major print and web formats (PNG, PDF, SVG, EPS, TIFF, and WebP) at any target DPI resolution, meeting the figure submission requirements of any peer-reviewed academic journal without requiring external format conversion tools.
- Complete Visual Element Control: Matplotlib’s Axes and Figure object model provides programmatic control over tick placement, font sizes, axis limits, color schemes, legend positioning, annotation placement, and multi-panel subplot grids, enabling the precision styling that research publishing and technical reporting demand.
- Foundation for the Python Visualization Stack: Matplotlib serves as the rendering backend for Seaborn, Pandas .plot(), and scikit-learn’s model diagnostic utilities, meaning Matplotlib knowledge directly unlocks customization and debugging proficiency across all downstream Python visualization libraries built on top of it.
- 3D Plots and Animations: Matplotlib supports 3D plotting via mpl_toolkits.mplot3d and frame-by-frame animations via FuncAnimation, extending Matplotlib’s capability beyond static publication figures for specialized scientific visualization contexts including simulation output and experimental data display.
Best For
Matplotlib is best for academic researchers, PhD students, and scientific computing teams who need publication-quality figures meeting peer-reviewed journal format standards, and for any Python developer who uses Seaborn, Pandas, or scikit-learn, where foundational Matplotlib knowledge is required to understand, debug, and customize the rendering behavior of all higher-level Python visualization libraries.
Pricing
Matplotlib is completely free under a BSD-compatible open-source license with no paid tiers, commercial licenses, or premium feature sets at any scale. Matplotlib is included with Anaconda and the standard scientific Python distribution, meaning it is pre-installed in most Python data science environments at zero additional cost. No pricing page exists or is required. (Matplotlib official site, verified June 2026)
Strengths
- Matplotlib has been cited in over 23,700 peer-reviewed scientific papers as of 2024 (Matplotlib official acknowledgment page, matplotlib.org/stable/project/citing.html) (the most cited scientific software visualization tool globally) a citation record that no other visualization library or BI platform in this comparison approaches, confirming Matplotlib as the academic publication standard across physics, biology, astronomy, and engineering.
- Matplotlib is sponsored by NumFOCUS: the same institutional foundation governing NumPy, SciPy, Pandas, Jupyter, and Scikit-learn (Matplotlib official site, 2025), providing formal governance stability and fiscal sponsorship that positions Matplotlib among the most sustainably maintained scientific Python tools, independent of any single company’s commercial interests.
- Matplotlib has maintained continuous active development for 20+ years since John D. Hunter created it in 2003 (the longest continuous maintenance track record of any tool in this comparison) providing maximum long-term stability for research institutions where visualization infrastructure disruption carries high cost.
- Matplotlib serves as the rendering backend for Seaborn, Pandas .plot(), and scikit-learn, with a practitioner confirming on r/datascience (u/Drakkur, 2022): “you should have a basic understanding of Matplotlib since almost every Python model/function that needs to plot uses it as a default”, making Matplotlib knowledge foundational regardless of which higher-level library a developer primarily uses.
Limitations
- Verbose API and Static-First Design: Matplotlib’s explicit object-oriented API requires significantly more lines of code than Seaborn or Plotly for equivalent visual output (with u/Rockmonde on r/datascience (6 upvotes, 2022) stating “I hate Matplotlib) it makes me feel like a noob when I want to customize a plot,” reflecting a genuinely steep customization learning curve that even experienced Python developers encounter.
- Limited Native Browser Interactivity: Matplotlib produces static charts by default with no browser-native hover tooltips, zoom, or interactive filtering without significant additional backend configuration, making Matplotlib unsuitable as a standalone tool for browser-facing outputs or web analytics contexts where stakeholders expect interactive chart exploration.
- Inferior Default Aesthetics: Matplotlib’s default styling is consistently described by practitioners as “ugly by default” compared to Seaborn, Plotly, and modern alternatives, requiring manual theme configuration to achieve presentation-quality results for stakeholder-facing outputs, adding overhead that offsets Matplotlib’s precision advantage in non-academic contexts.
Verdict
Matplotlib is the most academically validated visualization library in existence, cited in 23,700+ peer-reviewed papers as of 2024 (Matplotlib official acknowledgment page), making it the publication standard for scientific figures and foundational knowledge for virtually any Python data science workflow. Any Python developer who uses Seaborn, Pandas, or scikit-learn is already using Matplotlib as a rendering backend, making Matplotlib knowledge a structural requirement of the Python data science stack, not an optional addition. Practitioners needing interactive browser output should use Plotly; those needing quick statistical EDA with better visual defaults should use Seaborn, both of which build on Matplotlib and reward practitioners who understand what they are built on.
7. Chart.js: Best for Web Developers Needing Simple, Fast, Free Charts for Standard Business Use Cases
Category: JavaScript Charting Library, a Canvas-based library for adding standard interactive charts to web applications with minimal configuration and zero licensing cost at any deployment scale.
At a Glance
- Category: JavaScript Charting Library
- Best For: Web developers building standard bar, line, and pie charts in React, Vue, Angular, or vanilla JavaScript who need simplicity, zero licensing cost, and the smallest possible bundle footprint
- Price Range: Free: MIT licensed, no commercial tiers, no paid features at any scale (verified June 2026)
- Primary Strength: Chart.js delivers 2M+ weekly npm downloads and approximately 60KB gzipped bundle, the highest web adoption rate and smallest bundle footprint of any JavaScript charting library in this comparison.
- Biggest Limitation: Chart.js renders to HTML5 Canvas rather than SVG, preventing CSS styling of individual chart elements and requiring custom workarounds to approach ADA/WCAG accessibility standards for public-facing web applications.
- One-Line Summary: Chart.js is the most widely downloaded JavaScript charting library with 2M+ weekly npm downloads, approximately 60KB gzipped bundle, and complete MIT licensing, making it the zero-cost path to production-ready standard web charts in any JavaScript framework.
- Last Verified: June 2026
Overview
Chart.js is a free, open-source JavaScript charting library created by Nick Downie in 2013 that renders 8 standard chart types (bar, line, pie, doughnut, radar, polar area, bubble, and scatter) to HTML5 Canvas, and self-describes as “currently the most popular” JavaScript charting library based on GitHub stars and npm downloads (Chart.js official documentation, 2025).
Chart.js provides a responsive, animated, plugin-extensible configuration API that produces a fully interactive bar chart in approximately 10 lines of JavaScript, with actively maintained framework wrappers for React (react-chartjs-2: 6M+ weekly npm downloads, npm trends, June 2026), Vue (vue-chartjs), and Angular (ng2-charts). Chart.js v4, released December 2022, introduced a full TypeScript rewrite, tree-shaking for approximately 60KB gzipped bundle optimization, and data decimation for large time-series datasets, maintaining backward compatibility while modernizing for TypeScript-first enterprise development.
Key Features
- 8 Built-in Chart Types: Chart.js renders bar, line, pie, doughnut, radar, polar area, bubble, and scatter charts to HTML5 Canvas with a declarative configuration API that produces a responsive, animated, legend-toggling chart in approximately 10 lines of JavaScript, the fastest path to standard charts of any library in this comparison.
- Tree-Shaking and Bundle Optimization: Chart.js v4 (December 2022) introduced tree-shaking support, allowing applications to bundle only the chart types actively used, reducing the library to approximately 60KB gzipped (blog.openreplay.com, 2024), the smallest footprint of any visualization library in this comparison and a direct Core Web Vitals performance benefit.
- Framework Wrappers for React, Vue, and Angular: Chart.js provides actively maintained wrappers (react-chartjs-2 (6M+ weekly npm downloads), vue-chartjs, and ng2-charts) enabling Chart.js use as a native component in any major JavaScript frontend framework without architectural restructuring.
- Plugin Architecture: Chart.js’s extensible plugin system enables community-contributed annotation, datalabels, zoom, and streaming plugins, adding functionality beyond the 8 built-in chart types without increasing the base bundle size for applications that do not use those plugins.
- Data Decimation: Chart.js’s automatic data decimation feature reduces rendering density for large time-series datasets, maintaining visual fidelity while preventing Canvas performance degradation from over-plotting, extending Chart.js’s practical dataset size ceiling without requiring external data aggregation.
Best For
Chart.js is best for web developers (in React, Vue, Angular, or vanilla JavaScript) who need production-ready standard business charts quickly at zero cost, with the smallest possible bundle footprint, maximum deployment simplicity, and zero licensing barriers for commercial applications that do not have strict ADA/WCAG accessibility compliance requirements.
Pricing
Chart.js is completely free under the MIT license with no commercial tiers, no paid plugins from the official project, and no licensing fees at any deployment scale. All framework wrappers (react-chartjs-2, vue-chartjs, ng2-charts) are also free and open source. npm download figures are self-reported in Chart.js official documentation (2025) and fluctuate weekly, verify current download velocity at npmjs.com/package/chart.js before citing in procurement documentation. (Verified June 2026)
Strengths
- Chart.js reports 2M+ weekly npm downloads and 64,000+ GitHub stars (Chart.js official documentation, 2025; GitHub issue #10620, 2022) (the highest npm download rate of any JavaScript visualization library in this comparison) confirming production deployment across hundreds of thousands of active web applications globally.
- Chart.js v4, released December 2022, generated one of the highest-engagement open-source library release threads on r/webdev (369 upvotes), with performance-focused developers specifically praising the tree-shaking addition for the approximately 60KB gzipped bundle optimization (u/TheMarkBranly, r/webdev, 2022), the smallest footprint of any library in this entire comparison.
- Chart.js’s react-chartjs-2 wrapper reports 6M+ weekly npm downloads (npm weekly download trends, June 2026), significantly exceeding the base Chart.js library’s own download count, confirming that the React ecosystem is Chart.js’s primary growth driver and validating strong library ecosystem health across the most widely used JavaScript frontend framework.
- Chart.js is MIT licensed with zero commercial restrictions at any scale, with practitioner consensus on r/Angular2 (2024) summarized as: “If it needs to be free: ChartJS. If you are willing to pay for the most features and all-round quality library: Highcharts” (u/Good_Construction190, 21 upvotes).
Limitations
- Canvas Rendering and ADA/WCAG Accessibility: Chart.js’s HTML5 Canvas rendering is the most consequential architectural trade-off: Canvas elements are bitmap-based rather than structured DOM nodes, preventing CSS styling of individual chart components and requiring custom ARIA implementations for accessibility compliance, with multiple developers on the r/webdev Chart.js 4.0 thread (2022) citing Canvas rendering as the reason they migrated to SVG-based alternatives like D3.js.
- Limited Chart Type Breadth: Chart.js provides only 8 built-in chart types: covering standard business charts but not geographic projections, network graphs, force-directed layouts, 3D scientific visualizations, statistical violin plots, or box plots, making Chart.js insufficient for any team whose visualization needs exceed the standard business charting use case.
- Variable Plugin Ecosystem Quality: Chart.js’s community plugin ecosystem has inconsistent maintenance quality, while the official library is actively maintained, community plugins such as annotation, zoom, and streaming have variable update cadences and may break between major Chart.js versions, creating dependency management risk for production applications that rely on third-party Chart.js plugins.
This trade-off was described practically on r/Frontend:
“Chart.js is great when it supports the type of visualization you need. But as soon as you want to add something custom you might find yourself fighting the library or having to write a lot of weird code to go around its limitations. D3 gives you a lot of small building blocks that you can piece together to get something custom working. It’s like the difference between a drag and drop website builder and hand coding html and css yourself. They both have their places and it depends on what you need.” Posted by u/andeee23
Takeaway: Chart.js users consistently encounter customization ceilings that require migrating to D3.js, confirming that Chart.js is purpose-built for standard chart templates and is not a viable path when bespoke visualization requirements emerge.
Verdict
Chart.js is the most widely downloaded JavaScript charting library with 2M+ weekly npm downloads, approximately 60KB gzipped bundle size, and complete MIT licensing, making it the fastest, zero-cost path to standard web charts in any JavaScript framework at any scale. Chart.js is the recommended default starting point for web developers who need bar, line, or pie charts quickly in React, Vue, or Angular where D3.js’s learning investment is unjustified and ADA accessibility compliance is not a strict requirement. Teams building for public-sector, government-adjacent, or accessibility-regulated audiences should evaluate SVG-based alternatives including D3.js and Recharts, where individual chart elements are natively accessible to screen readers without custom workaround development.
What Red Flags Should I Watch For When Evaluating Data Visualization Tools?
Five production friction points consistently surface in practitioner communities when adopting data visualization tools, representing failure modes that vendor documentation omits and that standard comparison content misses. Each red flag below corresponds to a specific tool or category and is directly actionable in a vendor evaluation process.
Red Flag #1: Observable-Only Documentation (D3.js)
D3.js’s official documentation and all current examples have migrated entirely to Observable notebook format, a documented adoption barrier for production web application developers who need standard HTML/JavaScript implementations.
A data visualization educator posted on r/d3js (2023) that after years of teaching D3, the Observable dependency makes D3.js “just not viable” for standard web development contexts where every official manual page and example assumes the Observable runtime. Teams should budget significant time for translating Observable examples to conventional JavaScript before committing to D3.js in production web applications.
Red Flag #2: Pricing Opacity at Enterprise Scale (Dash Enterprise / Tableau)
Two tools in this comparison have significant enterprise pricing opacity that creates architectural commitment risk. Dash Enterprise pricing is not publicly listed and requires sales engagement with no self-serve upgrade path from free Dash, documented in Plotly community forum discussions (2024).
Tableau Creator at approximately $70–$75/user/month scales rapidly: at 50 users, the annual cost reaches approximately $42,000–$45,000. Teams should model enterprise-scale costs explicitly before making architectural commitments on either platform’s free tier.
Red Flag #3: LGTM Stack Infrastructure Complexity (Grafana)
Grafana’s dashboard UI is genuinely simple, but the full LGTM observability stack (Loki, Mimir, Tempo, Prometheus) requires dedicated DevOps engineering to configure, tune, and maintain at production scale.
A production engineer on r/devops (u/zsh_n_chips, 2025) with years of production Grafana experience stated: “it’s the backend data sources that are not fun or cheap, there are quite a few moving parts that become quite complex to deal with over time.” Staffing should account for backend observability engineering, not only dashboard configuration.
Red Flag #4: Canvas Rendering and ADA/WCAG Compliance Risk (Chart.js)
Chart.js renders to HTML5 Canvas rather than SVG, which means individual chart elements are not DOM nodes, cannot be styled with CSS selectors, and are invisible to screen readers by default.
Teams building for public-sector, government-funded, or accessibility-regulated applications face a real WCAG 2.1 compliance gap requiring custom ARIA fallbacks, adding development overhead that negates Chart.js’s simplicity advantage for those specific deployments. This trade-off was confirmed in the r/webdev Chart.js 4.0 thread (2022) with multiple developers citing it as their reason for migrating to SVG-based alternatives.
Red Flag #5: Version Control and CI/CD Gaps (Microsoft Power BI / Fabric)
Microsoft Power BI’s enterprise deployment lacks Git-native CI/CD pipeline support and IP whitelisting capabilities, documented in an r/MicrosoftFabric thread (2024, 17 upvotes) where production engineering teams reported these gaps as deployment blockers for DevOps-mature organizations.
Teams requiring programmatic report deployment, version-controlled dashboard definitions, or infrastructure-grade security controls should validate Power BI’s current CI/CD roadmap directly with Microsoft before committing it as the primary enterprise BI platform.
What Questions Should I Ask Before Choosing a Data Visualization Tool?
Asking eight questions before beginning a tool evaluation prevents the most common failure modes: category mismatch, hidden cost surprises, compliance gaps, and architectural lock-in from free-tier commitments that obscure enterprise pricing.
Question #1: Does your primary use case require a no-code drag-and-drop interface, or will your team write code?
This question determines the correct product category before evaluating any individual tool. Business analysts who need self-service dashboards belong in the Enterprise BI Platform category (Power BI, Tableau). Data scientists and frontend developers building custom visualizations belong in the Code-First Library category (Plotly, D3.js, Chart.js, Matplotlib). DevOps and SRE teams monitoring infrastructure belong in the Observability category (Grafana). Mixing these categories produces misaligned evaluation criteria that no individual tool can satisfy.
Question #2: Does your organization already hold Microsoft 365 E5 licenses?
Organizations holding Microsoft 365 E5 licenses receive Power BI Pro at no incremental cost, a pricing scenario that fundamentally changes the Power BI versus Tableau comparison for large enterprises. Microsoft 365 E3 license holders must purchase Power BI Pro as a separate add-on at $14/user/month. Verify current M365 E5 bundling terms directly with Microsoft before finalizing any enterprise BI platform comparison, since bundling details vary by agreement tier.
Question #3: Is your primary audience infrastructure monitoring, business analytics, or both?
Grafana, Power BI, and Tableau serve genuinely different audiences and should not appear on the same evaluation shortlist unless your organization explicitly needs both observability dashboards and business analytics dashboards simultaneously. Placing Grafana in the same evaluation as enterprise BI tools is a systematic category error that produces misleading conclusions for both DevOps engineers and business analysts.
Question #4: Do any deployment targets require ADA/WCAG accessibility compliance?
Web applications built for public-sector, government-funded, or accessibility-regulated audiences typically require WCAG 2.1 Level AA compliance. Chart.js’s Canvas rendering architecture makes compliance significantly harder to achieve without custom workarounds, SVG-based alternatives including D3.js, Recharts, and Nivo provide native DOM accessibility and should be evaluated first for any compliance-sensitive deployment context.
Question #5: What is your realistic total cost of ownership at 10, 50, and 500 users, including free-tier escalation mechanics?
Free-tier products escalate significantly at scale across this comparison:
- Grafana Cloud’s DPM and active Prometheus series charges accumulate quickly with high-cardinality metrics exporters
- Dash Enterprise requires sales engagement with no published pricing
- Tableau Creator at ~$70–$75/user/month is approximately $420,000–$450,000/year at 500 users
- Power BI Pro at $14/user/month may be zero incremental cost under M365 E5
- D3.js, Chart.js, Matplotlib, and Plotly open-source libraries are free at any scale
Question #6: What is your team’s primary technical skill level, drag-and-drop user, Python developer, or JavaScript developer?
Matching tool to team skill level prevents adoption failure. Business analysts without coding skills need Power BI or Tableau. Python data scientists are best served by Plotly or Matplotlib. Frontend JavaScript developers are best served by Chart.js or D3.js. Purchasing a D3.js-based solution for a non-technical analytics team is one of the most frequently cited adoption failure modes in r/datascience and r/dataisbeautiful practitioner discussions.
Question #7: How critical is long-term maintainability and vendor stability for this visualization investment?
All seven tools in this comparison have demonstrated long-term maintenance commitment:
- Microsoft Power BI and Tableau: corporate backing, Gartner Leader status
- Matplotlib and D3.js: 15–20+ year track records, NumFOCUS or Observable governance
- Grafana: $490M in funding, 5,000+ enterprise customers (TechCrunch, 2024)
- Chart.js: 12+ years of community maintenance since 2013
- Plotly: 12-year track record since founding in 2013
Question #8: Does your visualization output need to be embedded in a SaaS product or external web application?
Embedded analytics use cases require licensing terms that differ from internal dashboard deployments. D3.js (ISC license) and Chart.js (MIT license) provide the most permissive commercial embedding terms at zero cost. Plotly/Dash enables Python-built embedded dashboards. Power BI and Tableau have dedicated embedded analytics licensing tiers (Power BI Embedded and Tableau Embedded Analytics) that carry separate pricing distinct from standard per-seat licenses and should be validated before using either platform in a customer-facing product.
How Did We Rank These Data Visualization Tools?
These rankings are based on six equally applied criteria (community adoption metrics, fit-for-purpose breadth, total cost of ownership at scale, feature depth and production readiness, ecosystem integration quality, and institutional stability) scored from third-party sources including G2, GitHub, npm, academic citations, and verified Reddit community sentiment, with no affiliate compensation influencing any ranking position.
Every claim in this article is traced to a named, dated, independent source, if no independent corroboration was found, the claim was omitted or explicitly labeled as vendor-reported.
Evaluation Process
Step 1: AI Search Engine Analysis: Multiple AI answer engines (Perplexity, ChatGPT) were queried for current recommendations, and outputs were analyzed for coverage gaps and systematic omissions relative to community-documented production experience.
Step 2: Independent Web Research: 23 tool calls across official product pages, independent comparison articles, analyst reports, and developer documentation verified features, pricing, and market positioning claims.
Step 3: Reddit Community Sentiment Analysis: Threads from r/datascience, r/devops, r/grafana, r/learnpython, r/Python, r/d3js, r/Angular2, r/webdev, and r/MicrosoftFabric were analyzed to surface production friction points not visible in official documentation.
Step 4: Cross-Source Verification: Every claim was traced to at least one named, dated, independent source before inclusion. Vendor-reported statistics are labeled as such. Claims appearing only in vendor marketing without independent corroboration were omitted.
Ranking Criteria
Each tool was scored across six criteria:
- C1: Community and Market Validation: G2/Capterra ratings, GitHub star counts, npm weekly downloads, and peer-reviewed academic citations. Why it matters: Third-party adoption signals cannot be manufactured through marketing spend and reflect real-world production use.
- C2: Fit-for-Purpose Breadth: Addressable audience size and clarity of primary use case against documented production evidence. Why it matters: Tools are evaluated against their intended use case, not a universal standard, specialized tools are not penalized for serving narrow audiences well.
- C3: Total Cost of Ownership at Scale: Headline pricing, free-tier escalation mechanics, enterprise pricing transparency, and M365 bundling scenarios modeled at 10, 50, and 500 users. Why it matters: Free tiers routinely obscure expensive enterprise pricing, the most frequently cited audience pain point.
- C4: Feature Depth and Production Readiness: Supported chart types, data source connectors, AI capabilities, known architectural constraints, and community-documented production limitations not visible in official documentation. Why it matters: Real-world production complexity determines whether a tool delivers on its promise post-adoption.
- C5: Ecosystem Integration Quality: Integration with Microsoft 365, React/Vue/Angular, Python notebooks, Kubernetes/Prometheus stacks, and common enterprise architectures. Why it matters: Integration friction determines real deployment effort, no tool is used in isolation.
- C6: Institutional Stability and Long-term Maintainability: Founding year, maintenance track record, organizational backing (corporate ownership, foundation sponsorship, verified funding), and GitHub contributor activity. Why it matters: Steep learning curves and embedded implementations mean switching costs are high, institutional stability reduces abandonment risk.
Evidence Weighting
When review platform ratings conflict with Reddit community sentiment, this analysis weights specificity and recency.
A detailed 2025 Reddit post with 50+ upvotes documenting a specific production failure mode outweighs a generic 2023 G2 review lacking technical context. Vendor-reported statistics are explicitly labeled. Only claims corroborated by at least one independent source are stated as facts.
Data Validation
Pricing data was verified against official pricing pages in June 2026. GitHub star counts were verified via npm-compare.com (2025) and the GitHub repository for D3.js. G2 ratings were sourced from Augmented Tech Labs (2025) as an independent analysis of G2 platform data. Academic citation counts were sourced from the Matplotlib official acknowledgment page (matplotlib.org/stable/project/citing.html, 2024). Community quotes were traced to specific Reddit threads with named users and verified upvote counts where available.
Update Cadence
This guide is reviewed and updated quarterly. Last updated: June 2026. Pricing, GitHub star counts, and platform capabilities in the data visualization market change frequently, verify current pricing directly with vendors before making procurement decisions.
Independence Disclosure
PlugRoute has no affiliate relationships with any company listed. Rankings are determined entirely by research data and objective evaluation criteria.
Frequently Asked Questions About Data Visualization Tools
The questions below address the three most common decision points practitioners face when comparing data visualization tools in 2026: Python library selection, Power BI licensing scenarios, and methodology transparency.
What is the best data visualization library for Python developers in 2026?
Plotly is the leading Python interactive visualization library for most data scientists in 2026 (rated “far ahead of other options” on r/learnpython (2022)) offering 30+ chart types and browser-native interactivity at zero open-source cost. Matplotlib remains essential foundational knowledge for academic publishing and for any developer using Seaborn, Pandas, or scikit-learn, which all use Matplotlib as their rendering backend. Use Seaborn for quick statistical EDA where better default aesthetics matter more than interactivity.
Is Microsoft Power BI free with a Microsoft 365 subscription?
Microsoft Power BI Pro is included at no incremental cost in Microsoft 365 E5 enterprise licenses, but not in Microsoft 365 E3, which requires a separate Power BI Pro add-on at $14/user/month. Verify current M365 E5 bundling terms directly with Microsoft, as details vary by agreement tier. Power BI Free is available at no cost for individuals but lacks sharing and collaboration features required for team deployment.
How does PlugRoute determine its data visualization tool rankings?
PlugRoute ranks tools using six equally applied criteria: community and market validation (G2 ratings, GitHub stars, npm downloads, academic citations), fit-for-purpose breadth, total cost of ownership at scale, feature depth and production readiness, ecosystem integration quality, and institutional stability. Every cited claim includes a year and a named source. No tool receives preferential treatment. The full methodology is documented in the section above.
Glossary: Key Terms Used in This Comparison
Five technical terms appear throughout this comparison and are defined here. Understanding these terms is essential for evaluating tools in their correct technical context and for interpreting the trade-off language used across all seven entries.
VizQL (Visual Query Language): VizQL is Tableau’s proprietary technology that automatically translates drag-and-drop visual actions (moving fields on a canvas) into optimized database queries, enabling non-SQL users to explore complex datasets without writing code. VizQL is the patented foundation of Tableau’s competitive quality moat in the enterprise visual analytics market, documented on the Tableau official VizQL page.
LGTM Stack: LGTM is the acronym for Grafana Labs’ unified open-source observability stack, Loki (log aggregation), Grafana (visualization), Tempo (distributed tracing), and Mimir (metrics storage at Prometheus-compatible scale). Teams self-hosting Grafana for production observability typically deploy the full LGTM stack, which requires dedicated DevOps engineering resources to configure and maintain at scale.
DAX (Data Analysis Expressions): DAX is the formula language embedded in Microsoft Power BI, Power Pivot, and Analysis Services that powers complex calculated measures, time intelligence functions, and semantic data models. DAX enables Power BI users to create custom analytical calculations beyond simple drag-and-drop aggregations, comparable in role to Excel formulas but designed for tabular data model architecture.
DirectQuery: DirectQuery is a Microsoft Power BI connectivity mode that queries the underlying data source live without importing data into Power BI’s in-memory model. DirectQuery enables Power BI dashboards to reflect real-time data changes without scheduled refresh cycles, which is critical for operational reporting on frequently updated datasets but may introduce query performance constraints depending on data source responsiveness.
Observable Notebook: Observable is an interactive JavaScript notebook platform created by Mike Bostock, also the creator of D3.js, where users write and run JavaScript in a reactive, cell-based environment. D3.js’s official documentation and examples now reside primarily on Observable, which creates a documentation format that differs from standard HTML/JavaScript project contexts and requires translation work for web application developers building production deployments outside the Observable runtime.
Which Data Visualization Tool Is Right for You?
No single data visualization tool is right for every team. Microsoft Power BI leads for Microsoft 365 enterprise organizations, Tableau leads for deep visual analytics, D3.js leads for bespoke custom web charts, Plotly leads for Python interactivity, Grafana leads for DevOps monitoring, Matplotlib leads for academic publishing, and Chart.js leads for standard web charts, and most mature data organizations deploy tools from more than one of these categories simultaneously.
Key Insights
- Microsoft Power BI is the highest-rated enterprise BI platform in this comparison (G2: 4.5/5.0, Augmented Tech Labs citing G2, 2025), named a Gartner Magic Quadrant Leader for the 18th consecutive year as of 2025, and the most cost-effective BI solution for Microsoft 365 organizations, where Power BI Pro is often included at zero incremental cost under M365 E5 licensing.
- Tableau is the enterprise visual analytics standard with a VizQL quality moat that even Tableau critics acknowledge has no open-source equivalent, justified at ~$70–$75/user/month Creator pricing only for teams that genuinely need deep exploratory analytics, not for organizations deploying simple executive dashboards achievable with Power BI at approximately one-fifth the cost.
- D3.js leads the entire comparison in community adoption at 113,000+ GitHub stars (GitHub repository, 2025) and is the foundational engine underlying Recharts, Nivo, and Victory, but should be selected only when pre-built chart components genuinely cannot meet bespoke visualization requirements and the Observable documentation translation effort has been scoped into the development timeline.
- Plotly / Dash is the leading Python interactive library with the strongest practitioner endorsement of any Python charting tool in this comparison (the correct default for any Python workflow producing browser-facing or stakeholder-shared chart output) though Dash Enterprise pricing must be validated before architectural commitments are made on the free open-source version.
- Grafana is the default DevOps observability platform and the primary community-documented cost alternative to DataDog and New Relic (not a Power BI or Tableau replacement) and placing Grafana in the same evaluation as enterprise BI tools is a systematic category error that this article explicitly corrects.
- Matplotlib is non-negotiable baseline knowledge for Python data scientists, with 23,700+ peer-reviewed citations as of 2024 (Matplotlib official acknowledgment page) confirming it as the academic publication standard, and its backend role in Seaborn, Pandas, and scikit-learn making it structurally present in virtually every Python data science environment regardless of which higher-level library a developer primarily uses.
- Chart.js is the fastest path to standard web charts at zero cost with 2M+ weekly npm downloads (the default recommendation for web developers building bar, line, or pie charts) but teams with ADA/WCAG compliance requirements should evaluate SVG-based alternatives including Recharts or D3.js before committing to Chart.js’s Canvas-based architecture.
Most mature data organizations do not select a single tool. A common production stack deploys Grafana for infrastructure observability, Power BI or Tableau for business analytics and executive reporting, and Plotly or Chart.js for embedded charts in web applications. If your team spans multiple use cases, budget and tool selection should reflect the multi-category nature of your visualization needs rather than forcing a single tool to serve all three jobs simultaneously.
For more independent, affiliate-free comparisons of data tools and analytics software, visit PlugRoute, where every ranking follows the transparent, evidence-based methodology documented above.
We update this guide quarterly. Last updated: June 2026.