ChartMogul is the best overall subscription analytics software in 2026 for SaaS companies with one or more billing systems. Baremetrics is best for pairing churn analytics with payment recovery, Paddle Metrics is the best free option, and RevenueCat is best for mobile apps. The right tool depends on your billing setup and how each tool defines MRR.
Teams usually start looking for a subscription analytics tool when their billing system’s own reports stop being enough:
- Native billing dashboards give limited or inconsistent MRR, churn and cohort reports.
- Revenue split across Stripe, Chargebee, PayPal and the app stores is hard to combine.
- Vendor metric definitions rarely match a company’s internal numbers.
- Pricing tied to ARR or billing volume makes total cost hard to forecast.
As one user on r/webdev described:
“It’s that every provider defines things slightly differently. Cancellation timing, grace periods, refunds, even what counts as “active”. When you try to unify that into one clean subscription model, you start hitting edge cases everywhere. And then metrics like churn or MRR stop being just numbers, you have to decide how you define them.” Posted by u/alex_informatics
Takeaway: Teams combining subscription data from several providers find that MRR and churn become definition choices rather than fixed numbers, which is why metric definitions are central to choosing a subscription analytics tool.
This guide ranks seven tools across four categories using a published 45-point scoring method, and every price and rating is dated.
PlugRoute has no affiliate relationships with any company listed. Rankings are determined entirely by research data and objective evaluation criteria.
What Are the 4 Categories of Subscription Analytics Tools?
Subscription analytics tools fall into four categories:
- standalone analytics (ChartMogul, Baremetrics, Paddle Metrics)
- billing-native analytics (Chargebee RevenueStory, Stripe Billing)
- finance platforms (Maxio)
- mobile subscription infrastructure (RevenueCat)
Which category fits depends on how many billing sources you use and whether you need revenue recognition or app-store receipt handling.
Each category works differently:
- Standalone Analytics tools connect to your existing billing systems and calculate metrics without handling billing. ChartMogul, Baremetrics and Paddle Metrics are standalone analytics tools.
- Billing-Native Analytics is reporting built into a billing platform, and it covers only that platform’s data. Chargebee RevenueStory and Stripe Billing analytics are billing-native analytics tools.
- Finance Platform tools combine billing, ASC 606 revenue recognition and SaaS metrics in one system. Maxio is a finance platform.
- Mobile Subscription Infrastructure is an in-app purchase backend with built-in analytics for App Store and Google Play revenue. RevenueCat is mobile subscription infrastructure.
PlugRoute’s ranking measures how well each tool fits the whole target audience. A lower-ranked tool can still be the right choice in a specific situation.
For example, RevenueCat is the right choice for app-store revenue, and Chargebee RevenueStory is the right choice for existing Chargebee customers.
How Do the Top Subscription Analytics Tools Compare at a Glance?
ChartMogul leads PlugRoute’s ranking with 37 of 45 points. Baremetrics follows with 33, then Paddle Metrics (32), RevenueCat (30), Chargebee RevenueStory (28), Maxio (28) and Stripe Billing analytics (25). The table below summarizes each tool’s category, ideal buyer and core capabilities, plus the main trade-off to weigh before buying.
The per-criterion scores and evidence are in “How Did We Rank These Subscription Analytics Tools?” further down.
| Rank | Company | Category | Best For | One-Line Summary | Key Capabilities | Primary Strength | Key Limitation |
|---|---|---|---|---|---|---|---|
| 1 (37/45) | ChartMogul | Standalone Analytics | Multi-source SaaS, $120K–$10M ARR | ChartMogul is the highest-scoring tool in this review for combining several billing sources into one customer-level MRR and churn view. | MRR movements, cohorts, benchmarks, CRM, warehouse export | Links one customer across up to 5 billing sources on Pro | Starter allows one billing system; cost rises in ARR bands |
| 2 (33/45) | Baremetrics | Standalone Analytics | Startups fighting failed payments | Baremetrics is the subscription analytics tool best suited to startups that want to measure churn and recover failed payments in one dashboard. | Dashboards, Recover, Cancellation Insights, forecasting | Links analytics to recovery and cancellation workflows | Add-ons cost $129/month each; Launch allows 1 integration |
| 3 (32/45) | Paddle Metrics | Standalone Analytics | Zero-budget startups | Paddle Metrics, formerly ProfitWell Metrics, is the best free subscription analytics tool for startups with purely recurring, non-usage-based revenue. | Free MRR, churn, LTV, cohorts, benchmarks | $0 with benchmarks from 30,000+ companies | Excludes one-time and metered billing; Stripe must be the subscription system |
| 4 (30/45) | RevenueCat | Mobile Subscription Infrastructure | App Store and Google Play apps | RevenueCat is the most widely adopted mobile subscription platform in this review and holds the list’s highest verified G2 rating (4.8/5). | Receipt validation, entitlements, Charts, Paywalls, Experiments | Infrastructure and analytics in one SDK | 1% of all MTR once above $2,500; MTR is not MRR |
| 5 (28/45) | Chargebee RevenueStory | Billing-Native Analytics | Existing Chargebee customers | Chargebee RevenueStory is the most practical analytics option for existing Chargebee customers, who should test it before buying a separate tool. | 150+ reports, Retention, Receivables, RevRec | Definitions match billing with no connector | Reports only Chargebee-billed revenue |
| 6 (28/45) | Maxio | Finance Platform | B2B finance teams | Maxio is the best fit for B2B SaaS finance teams that need metrics, billing and ASC 606 revenue recognition in one system. | Billing, rev rec, metrics, collections, forecasting | Metrics tied to the general ledger | Entry price from $599/month; steep learning curve |
| 7 (25/45) | Stripe Billing analytics | Billing-Native Analytics | Stripe-only businesses | Stripe Billing analytics is the baseline every Stripe-only business should test before buying a dedicated tool. | Billing dashboard, Smart Retries, Sigma, Data Pipeline | Zero setup, built-in recovery | Stripe data only; metered products excluded from MRR |
Which Subscription Analytics Tool Should I Choose for My Use Case?
Choose by billing setup:
- Zero budget: Paddle Metrics, or ChartMogul Free.
- Multiple billing sources: ChartMogul Pro.
- App-store revenue: RevenueCat.
- Already billing on Chargebee: Chargebee RevenueStory.
- ASC 606 revenue recognition: Maxio.
- Stripe-only and early stage: Stripe’s native dashboard first.
The table below gives the reasoning and a fallback option for each priority.
| Your #1 Priority | Recommended Tool | Why | Acceptable Alternative |
|---|---|---|---|
| No software budget | Paddle Metrics | Paddle Metrics costs $0 for core metrics. | ChartMogul Free (under $120K ARR) |
| Stripe-only, under ~$1M ARR | Stripe Billing analytics first | Stripe Billing analytics needs no integration. | ChartMogul Starter or Baremetrics Launch |
| Multiple billing sources, $1M–$10M ARR | ChartMogul Pro | ChartMogul Pro links one customer across up to 5 billing sources. | Baremetrics Growth (2 integrations) or Scale (unlimited) |
| Investor-grade reporting before a fundraise ($1M+ ARR) | ChartMogul Pro | ChartMogul Pro reports NRR, GRR and MRR movements with benchmarks. | Baremetrics Growth (check NRR/GRR definitions) |
| Already billing on Chargebee | Chargebee RevenueStory | Chargebee RevenueStory definitions match billing records. | ChartMogul (once you add non-Chargebee revenue) |
| Revenue recognition and month-end close | Maxio | Maxio ties metrics to ASC 606 and the general ledger. | Chargebee RevRec |
| Mobile app subscriptions | RevenueCat | RevenueCat handles receipts, entitlements and charts. | ChartMogul or Baremetrics (both connect to the app stores) |
| Hybrid web plus app | RevenueCat plus ChartMogul or Baremetrics | No single tool is clearly strong at both web and app-store revenue. | Test both pairings |
| Usage-based or hybrid pricing | ChartMogul (test first) | ChartMogul says it handles usage-based overages (vendor claim). | Avoid tools that leave metered revenue out of MRR |
What Are the 7 Best Subscription Analytics Tools in 2026?
These are the seven best subscription analytics tools in 2026, ranked by PlugRoute’s weighted score out of 45. Metric accuracy, billing-source coverage and pricing predictability count double in the score.
- ChartMogul (37/45) is best overall and best for multiple billing systems.
- Baremetrics (33/45) is best for acting on churn with analytics plus payment recovery.
- Paddle Metrics (32/45) is the best free subscription analytics software.
- RevenueCat (30/45) is best for mobile app subscriptions.
- Chargebee RevenueStory (28/45) is best for companies already billing on Chargebee.
- Maxio (28/45) is best for B2B finance teams that need revenue recognition.
- Stripe Billing analytics (25/45) is the best built-in baseline for Stripe-only businesses.
Every entry below uses the same structure. Each one labels vendor-reported figures and lists real limitations next to the documented strengths.
1. ChartMogul: Best Overall and Best for Multiple Billing Systems
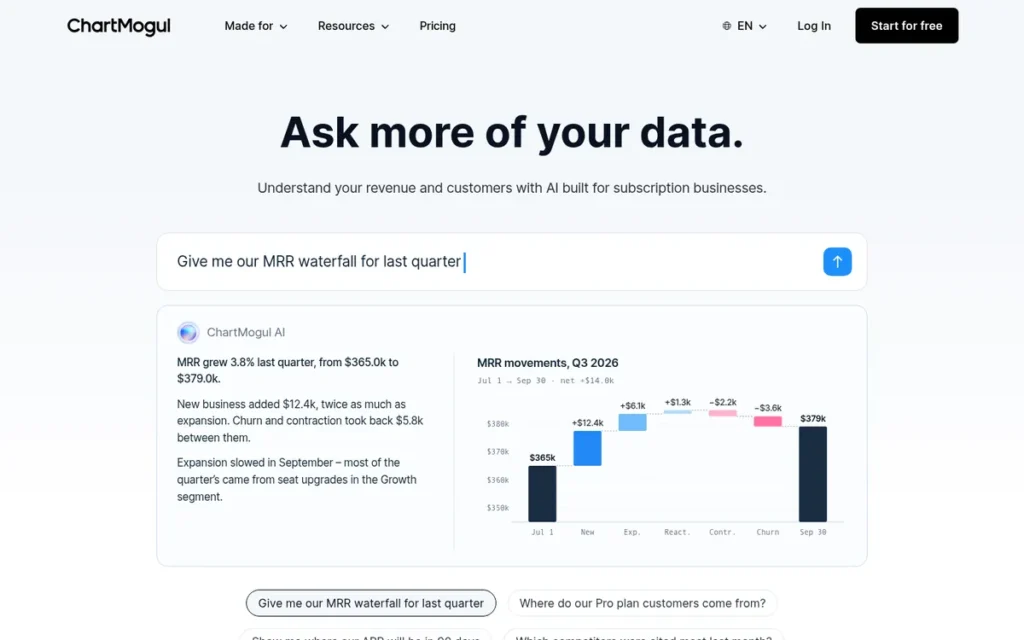
Category: Standalone Analytics, connects to your existing billing systems and calculates subscription metrics without handling billing itself.
At a Glance
- Category: Standalone Analytics
- Best For: SaaS companies with one or more billing sources that need investor-grade MRR, ARR, churn and cohort reporting
- Price Range: Free up to $120K ARR; $57–$1,439/month by ARR band and plan; Enterprise from $19,900/year (verified November 2026)
- Primary Strength: ChartMogul links one customer’s subscriptions across Stripe, Chargebee, Recurly, App Store, Google Play and custom sources into one customer-level revenue view.
- Biggest Limitation: ChartMogul’s Starter plan allows only one billing system, Pro allows up to five, and costs rise in bands as tracked ARR grows.
- One-Line Summary: ChartMogul is the highest-scoring tool in this review (37/45) for SaaS companies that need to combine several billing sources into one customer-level MRR and churn view.
- Last Verified: November 2026
Overview
ChartMogul is a standalone subscription analytics platform for SaaS founders and finance teams that need one consolidated revenue view. ChartMogul calculates MRR, ARR, churn, LTV and cohort retention from Stripe, Chargebee, Recurly, App Store, Google Play and custom sources.
ChartMogul’s main difference from rivals is a vendor-neutral data model that keeps each customer’s history intact across billing systems and through billing migrations (ChartMogul, 2026).
Key Features
- ChartMogul breaks MRR movements into new, expansion, contraction, reactivation and churn, and it also reports ARR, ARPU, LTV and cohort retention.
- ChartMogul links one customer’s subscriptions across billing systems, so revenue history carries over through a billing migration (ChartMogul, 2026; vendor claim).
- ChartMogul separates currency movements from real expansion and handles add-ons, tiered plans and usage-based overages (ChartMogul, 2026; vendor claim).
- ChartMogul compares growth, net revenue retention (NRR) and gross revenue retention (GRR) against more than 2,500 anonymised SaaS businesses (ChartMogul Help Center, 2026; vendor-reported).
- ChartMogul exports data to S3, Snowflake, BigQuery and Redshift on higher-tier plans (ChartMogul, 2026).
Best For
ChartMogul is best for SaaS companies between $120K and $10M ARR that bill through more than one system, are moving between billing platforms, or need consistent board-ready metrics. ChartMogul’s free plan covers startups under $120K ARR that use a single billing source.
Pricing
ChartMogul pricing was verified on chartmogul.com/pricing in November 2026:
- ChartMogul is free up to $10K MRR ($120K ARR) with one billing source.
- ChartMogul Starter costs $69/month, or $57/month billed annually, at $120K–$500K ARR. It includes 3 seats and 1 billing system.
- ChartMogul Pro costs $119/month, or $99/month billed annually, in the same band. It includes unlimited seats and up to 5 billing sources.
- ChartMogul Pro rises to $1,439/month, or $1,199/month billed annually, at $7M–$10M ARR.
- ChartMogul Enterprise starts at $19,900/year above $10M ARR and supports up to 15 billing sources.
Strengths
- ChartMogul documents the deepest cross-source consolidation among the standalone tools. It links one customer across up to 5 billing sources on Pro (15 on Enterprise) and through billing migrations (ChartMogul, 2026).
- ChartMogul holds a 4.5–4.6/5 rating from 112–113 reviews; the figure varies by G2 page (G2, 2026; verified November 2026). One reviewer called setup “quick and straightforward, even with manual import.”
- ChartMogul publishes the most detailed ARR-band pricing among the standalone tools, from free up to $10M ARR, so finance leads can forecast cost before buying (ChartMogul, 2026).
- ChartMogul publishes recurring SaaS research reports on growth, billing frequency and retention (ChartMogul Reports, 2026).
Limitations
- ChartMogul’s multi-source depth comes with setup work. A third-party comparison reports data cleanup across sources, reconciliation against processor reports, and a learning curve that can feel excessive for Stripe-only businesses (Basedash, 2026).
- ChartMogul’s G2 reviewers most often criticise revenue data that can be inaccurate or need troubleshooting (G2, 2026; verified November 2026).
- ChartMogul limits Starter to one billing system, so multi-source companies need Pro. Pro costs roughly 1.7–1.9 times as much as Starter in each ARR band (ChartMogul, 2026).
- ChartMogul has no built-in failed-payment recovery. One r/SaaS commenter, in a thread that appears to promote a competitor, reported weaker PayPal subscription handling (Reddit r/SaaS, 2024). PlugRoute found no named customer case studies with verified results.
Users on r/SaaS shared their experience:
“Was using the free plan for a long time but hit the 10k mrr mark last year and I’m paying 120$ per month, which is just too much for what I’m using it for. I can’t use stripe metrics since I have a lot of manual invoices that are not reflected on stripe.” Posted by u/Narrow_Upstairs4479
Takeaway: The jump from ChartMogul’s free plan to paid pricing at $10K MRR can feel overpriced to founders who need its non-Stripe data sources but use only its basic metrics.
Verdict
ChartMogul is the best overall subscription analytics software for SaaS companies in 2026, because it documents the deepest customer-level consolidation across billing sources and publishes full ARR-band pricing.
ChartMogul scored 37/45. It leads on billing-source consolidation (C2: 5) and is held back by the lack of native recovery (C5: 3). Startups can start on ChartMogul’s free plan under $120K ARR and move to Pro when they add a second billing source.
2. Baremetrics: Best for Acting on Churn (Analytics Plus Payment Recovery)
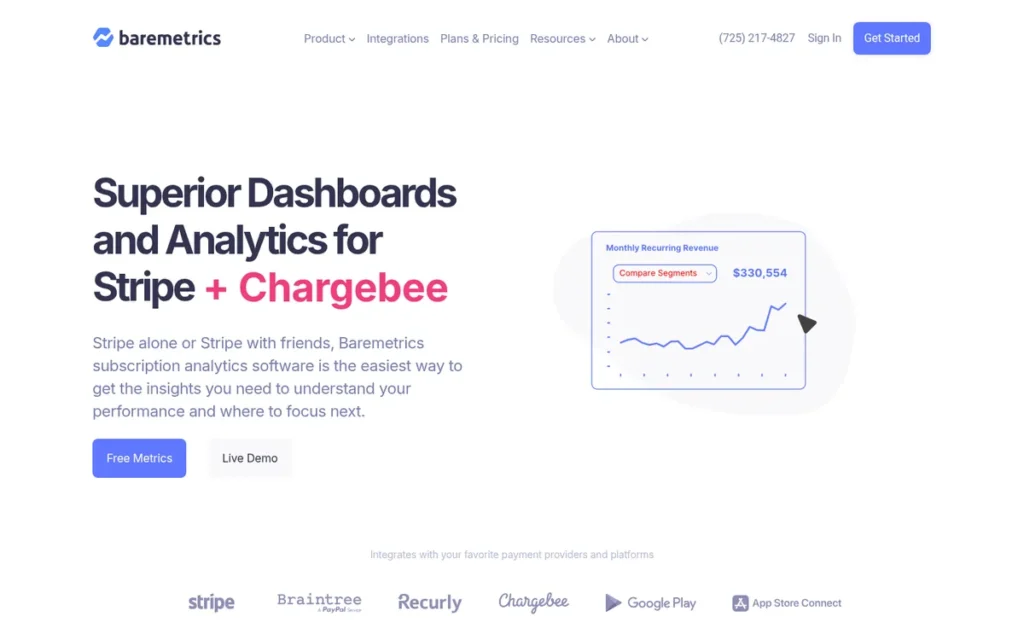
Category: Standalone Analytics.
At a Glance
- Category: Standalone Analytics
- Best For: Startups and small SaaS teams that want churn metrics and failed-payment recovery in one tool
- Price Range: Launch $49/month billed annually ($75 monthly); Growth $189–$255/month; Scale $749–$1,152/month; add-ons $129/month each (verified November 2026)
- Primary Strength: Baremetrics links subscription analytics directly to failed-payment recovery (dunning) and cancellation-reason workflows.
- Biggest Limitation: Baremetrics charges $129/month per add-on, and its Launch plan allows only one integration.
- One-Line Summary: Baremetrics is the subscription analytics tool best suited to startups that want to measure churn and recover failed payments from the same dashboard.
- Last Verified: November 2026
Overview
Baremetrics is a subscription analytics tool that pairs MRR, ARR, churn and LTV dashboards with failed-payment recovery, cancellation surveys and forecasting. Baremetrics is built for startups and small SaaS teams that want to act on churn in the same tool that measures it.
Baremetrics is often described as a Stripe-only tool, but it also lists connectors for Chargebee, Recurly, Braintree, the app stores, Paddle and PayPal (Baremetrics, 2026).
Key Features
- Baremetrics shows dashboards for MRR, ARR, churn, LTV and trial metrics, along with benchmarks and a Control Center view (Baremetrics, 2026).
- Baremetrics Recover automates failed-payment recovery (dunning) through email sequences, card-update pages, in-app prompts and SMS campaigns.
- Baremetrics Cancellation Insights records why customers cancel, so churn reasons sit next to churn numbers.
- Baremetrics connects to QuickBooks Online and Xero to support runway and P&L forecasting alongside subscription metrics (Baremetrics, 2026).
- Baremetrics integrates with Stripe, Chargebee, Recurly, Braintree, App Store, Google Play, Shopify, Paddle and PayPal, plus a universal connector, within plan-level integration limits.
Best For
Baremetrics is best for startups below roughly $3.6M ARR that lose meaningful revenue to failed payments. It suits teams that want recovery and cancellation workflows without adding a separate retention vendor.
Pricing
Baremetrics pricing was verified on baremetrics.com/pricing and G2 in November 2026:
- Baremetrics Launch costs $75/month, or $49/month billed annually, for up to $360K ARR with 1 integration.
- Baremetrics Growth costs $255/month, or $189/month billed annually, for $360K–$3.6M ARR with 2 integrations.
- Baremetrics Scale costs $1,152/month, or $749/month billed annually, above $3.6M ARR with unlimited integrations.
- Baremetrics Recover costs $129/month or 10% of recovered revenue, and Cancellation Insights costs $129/month.
Strengths
- Baremetrics bundles the most complete churn-recovery toolkit among the standalone analytics tools. Baremetrics promotes a guarantee that the next month is free if Recover does not recover more than it costs (Baremetrics, 2026; vendor claim).
- Baremetrics holds a 4.6/5 rating from 98 reviews (G2, 2026; verified November 2026), and G2’s comparison page associates it with strong customer support.
- Baremetrics’ QuickBooks and Xero integrations add runway and P&L forecasting, which ChartMogul and Paddle Metrics do not document (Baremetrics, 2026).
- Baremetrics has operated since its 2013 launch, and founders in a r/SaaS thread named it one of three “established apps” (Reddit r/SaaS, 2021).
Limitations
- Baremetrics’ low entry price is offset by add-on costs. Adding both Recover and Cancellation Insights costs an extra $258/month on top of the base plan (Baremetrics, 2026).
- Baremetrics caps integrations by plan (Launch 1, Growth 2). Paying monthly costs about 54% more than paying annually on Scale: $1,152 versus $749 (Baremetrics, 2026).
- Baremetrics “can be expensive when using only the analytics portion,” according to G2 reviewers (G2, 2026).
- Baremetrics’ own blog says reconciliation work is common across subscription analytics tools, often because of refunds, coupons, taxes, trials and migrations (Baremetrics, 2026).
- Baremetrics was sold in 2020 for $4M with a 10-person team (Baremetrics, 2020). Its current owner and team size could not be confirmed, so how fast the product is being developed is unclear.
Verdict
Baremetrics is the best subscription analytics choice for startups that want churn measurement and failed-payment recovery in one tool, provided they budget for add-ons.
Baremetrics scored 33/45. It leads on actionability (C5: 5) and is held back by add-on costs and integration caps (C3: 3). Baremetrics connects to more billing sources than its Stripe-only reputation suggests, but add-ons can erase its price advantage over ChartMogul.
3. Paddle Metrics (formerly ProfitWell Metrics): Best Free Subscription Analytics Software

Category: Standalone Analytics.
At a Glance
- Category: Standalone Analytics
- Best For: Budget-constrained startups that need core MRR, churn and cohort metrics at zero software cost
- Price Range: Free (Metrics); Retain priced as a negotiated percentage of recovered revenue (verified November 2026)
- Primary Strength: Paddle Metrics provides MRR, churn, LTV and cohort reporting, plus benchmarks drawn from 30,000+ companies, for free.
- Biggest Limitation: Paddle Metrics excludes one-time transactions and metered billing, and it supports Stripe only when Stripe manages subscriptions (Paddle, 2026).
- One-Line Summary: Paddle Metrics, formerly ProfitWell Metrics, is the best free subscription analytics tool for startups whose revenue is purely recurring and not usage-based.
- Last Verified: November 2026
Overview
Paddle Metrics, formerly ProfitWell Metrics, is a free subscription analytics dashboard for budget-constrained startups that need investor-grade basics at zero software cost. Paddle Metrics reports MRR, churn, LTV, cohorts and trial conversion.
Paddle Metrics has historically been paid for by Paddle’s paid Retain and Price Intelligently products. Paddle bought ProfitWell in May 2022 for more than $200M (TechCrunch, 2022).
Paddle has been moving Paddle Metrics into the Paddle Billing dashboard. Readers should treat Paddle Metrics’ connector list (Stripe, Chargebee, Recurly, Braintree, Zuora, Apple) as historical and check it again before relying on it.
Key Features
- Paddle Metrics reports MRR, churn, LTV, ARPU, cohorts and trial conversion at no cost (Paddle, 2026).
- Paddle Metrics compares a company against data from more than 30,000 companies (Paddle developer docs, 2026; vendor-reported).
- Paddle Metrics counts a customer as churned when their paid period ends, and counts a returning customer as a reactivation rather than a new customer (Paddle developer docs, 2026).
- Paddle Metrics works alongside Paddle Retain, which runs failed-payment recovery and cancellation flows in exchange for a share of recovered revenue.
- Paddle Metrics refreshes its dashboard every 3–6 hours rather than in real time (Paddle developer docs, 2026).
Best For
Paddle Metrics is best for pre-revenue to early-stage SaaS companies with purely recurring, non-metered pricing that want trustworthy basics without paying for software. Paddle Metrics is also a natural fit for businesses that already bill through Paddle.
Pricing
Paddle pricing was verified through Paddle documentation and press coverage in November 2026:
- Paddle Metrics costs $0, and Paddle’s Stripe integration page markets it as “100% free” (Paddle, 2026).
- Paddle Retain has no base fee and charges a negotiated, unpublished percentage of recovered revenue.
- Paddle’s Price Intelligently is a paid monthly service with an unpublished price.
Strengths
- Paddle Metrics draws its benchmarks from more than 30,000 companies, the largest benchmark dataset of any tool in this list (Paddle developer docs, 2026; vendor-reported).
- Paddle Metrics costs $0 for core subscription metrics, making it the lowest-cost route to investor-grade basics among the standalone tools (Paddle, 2026; verified November 2026).
- Paddle Metrics publishes its churn-timing and reactivation definitions in developer documentation, so finance teams can see why its numbers differ from other sources (Paddle developer docs, 2026).
- Paddle Metrics is praised by reviewers as “free, fast, [and] easy to integrate” and for replacing spreadsheet calculations (G2, 2026).
This aligns with community sentiment on r/SaaS:
“We started using your product years ago because it was free when Baremetrics wanted a lot of money for the same thing. Do you attribute being a “loss leader” as the #1 growth factor? Loss leader not in a negative way, just a matter of taking something other companies charge 100s of dollars for and making it free.” Posted by u/L_VDH
Takeaway: Paddle Metrics, as ProfitWell, won early users by giving away for free the core metrics that paid competitors such as Baremetrics charged for.
Limitations
- Paddle Metrics trades zero cost for narrower coverage. Paddle’s help center states that it excludes one-time transactions and does not yet support metered billing (Paddle, 2026).
- Paddle Metrics supports Stripe only when Stripe manages subscriptions. If Stripe is only the payment gateway, Paddle provides cash-flow and Retain data but not full Metrics (Paddle help center, 2026).
- Paddle Metrics counts churn when the paid period ends, so its figures will not match Stripe or internal models that count churn at cancellation.
- Paddle Metrics reviewers cite limits on API reporting, confusion over “virtual plans”, the tool being unable to “account for every customer anomaly,” and slow support across the wider Paddle platform (G2, 2026).
- Paddle Metrics has no review rating of its own. Paddle’s 4.5/5 from 241 reviews covers the whole Paddle platform (G2, 2026).
Verdict
Paddle Metrics is the best free subscription analytics software in 2026 for startups with purely recurring revenue, though Paddle documents that it excludes one-time and metered billing.
Paddle Metrics scored 32/45. It leads on pricing predictability (C3: 5) and is held back by documented revenue exclusions (C1: 3). Companies with usage-based pricing, or that use Stripe only as a payment gateway, should consider ChartMogul’s free tier instead.
4. RevenueCat: Best for Mobile App Subscriptions
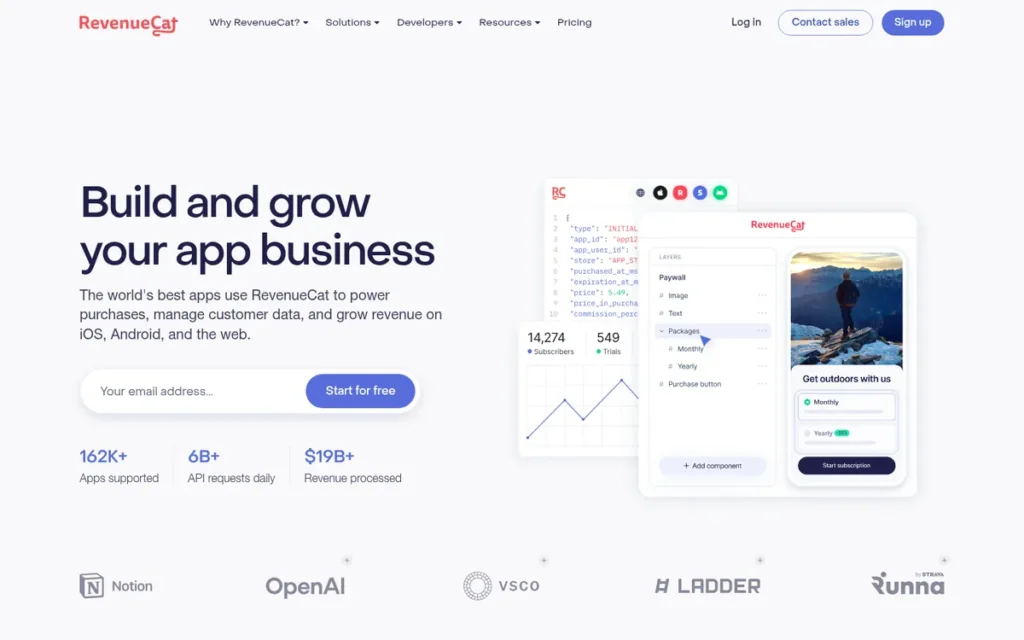
Category: Mobile Subscription Infrastructure, an in-app purchase backend with built-in subscription analytics for App Store and Google Play revenue.
At a Glance
- Category: Mobile Subscription Infrastructure
- Best For: Mobile app teams selling subscriptions through the App Store and Google Play
- Price Range: Free up to $2,500 MTR; then 1% of all MTR; Enterprise custom (verified November 2026)
- Primary Strength: RevenueCat handles app-store receipt validation, entitlements, paywalls and subscription analytics in one SDK-based platform.
- Biggest Limitation: RevenueCat charges 1% of all tracked revenue once MTR exceeds $2,500, and its MTR figure is not the same as MRR.
- One-Line Summary: RevenueCat is the most widely adopted mobile subscription platform in this review, with 107,000+ apps launched on it in 2026 (vendor-reported), and it holds the list’s highest verified G2 rating (4.8/5).
- Last Verified: November 2026
Overview
RevenueCat is an in-app purchase infrastructure and subscription analytics platform for mobile app teams that sell subscriptions through the app stores. RevenueCat validates App Store and Google Play receipts, manages cross-platform entitlements (records of what each user has paid for), and charts MRR, churn, cohorts and LTV.
RevenueCat is infrastructure first and analytics second. RevenueCat bills on Monthly Tracked Revenue (MTR), which includes non-subscription purchases and is counted before store fees and tax (RevenueCat docs, 2026).
Key Features
- RevenueCat validates App Store and Google Play receipts on its servers and tracks each user’s entitlements across platforms through a single app user ID (RevenueCat, 2026).
- RevenueCat Charts report MRR, active subscriptions, trial conversion, churn, cohorts and LTV.
- RevenueCat Paywalls and Experiments let app teams build paywalls and run A/B price tests.
- RevenueCat Customer Center gives subscribers a place to manage their subscriptions inside the app.
- RevenueCat supports web subscriptions through Stripe-based Web Billing, which brings some web revenue into the same view.
Best For
RevenueCat is best for consumer mobile apps whose subscription revenue runs mainly through the App Store and Google Play. RevenueCat suits teams that want to avoid building their own receipt-validation backend.
Pricing
RevenueCat pricing was verified on revenuecat.com/pricing in November 2026:
- RevenueCat is free up to $2,500 MTR.
- RevenueCat charges 1% of all MTR once that threshold is passed, so $2,600 MTR costs $26.
- RevenueCat costs about $100/month at $10K MTR, about $1,000/month at $100K MTR and about $10,000/month at $1M MTR (PlugRoute calculation, 2026).
- RevenueCat Enterprise plans are custom, with volume discounts and SLAs.
- For example, an app with $50K of gross App Store subscription sales and $5K in one-time purchases has $55K of MTR, so RevenueCat charges $550/month. Its MRR after store fees is lower than $55K (PlugRoute example, 2026).
Strengths
- RevenueCat reported more than 107,000 apps going live in 2026, up from 41,000 in 2025, and more than $17B in cumulative tracked revenue (RevenueCat, 2026; vendor-reported).
- RevenueCat holds the highest verified G2 rating in this list, 4.8/5 from about 214 reviews, while its own pricing page displays 4.7/5 (G2, 2026; verified November 2026).
- RevenueCat publishes customer results such as a +207% LTV gain from annual plans at dub and a −36% refund rate at Dipsea (RevenueCat case studies, 2026; vendor-reported).
- RevenueCat publishes the State of Subscription Apps report, a recurring reference for mobile subscription benchmarks (RevenueCat, 2026).
Users on r/iOSProgramming noted:
“But RevenueCat is especially useful and popular IMO because it makes it easy to work with StoreKit APIs and alleviates the headaches that come with them. For instance, RC abstracts away any need to validate receipts, store and encrypt purchase records, verify cached purchase records, etc.” Posted by u/SpamSencer
Takeaway: RevenueCat is popular with app developers because it takes receipt validation and purchase-record handling off their hands.
Limitations
- RevenueCat trades infrastructure convenience for a cost tied to revenue. Its 1% fee reaches about $10,000/month at $1M MTR (PlugRoute calculation from RevenueCat pricing, 2026).
- RevenueCat’s MTR includes non-subscription purchases and is counted before store fees and tax, so it will not match App Store payouts (RevenueCat docs, 2026).
- RevenueCat reviewers report data-accuracy problems, including currency-timing mismatches, VAT and country-level discrepancies, daily subscription counts that change after the fact, and sandbox users mixed into metrics (Capterra, Software Advice and G2, 2026).
- RevenueCat reviewers also report downtime and support replies that take 4–7 days (Capterra, 2026).
- RevenueCat is described on r/swift as the default early choice, but some developers plan to replace it with their own backend once revenue justifies the work (Reddit r/swift, 2023).
Verdict
RevenueCat is the best subscription analytics software for mobile apps in 2026. It combines App Store and Google Play receipt infrastructure with built-in charts and has the list’s highest verified G2 rating.
RevenueCat scored 30/45. It leads on verified reviews (C4: 5) and is held back by the difference between MTR and MRR (C1: 3). Model RevenueCat’s 1% fee against your revenue for the next 12–24 months. Hybrid web-plus-app businesses should test pairing it with ChartMogul or Baremetrics.
5. Chargebee RevenueStory: Best for Companies Already Billing on Chargebee

Category: Billing-Native Analytics, reporting built into a billing platform that covers only that platform’s own data.
At a Glance
- Category: Billing-Native Analytics
- Best For: Companies that already bill through Chargebee and want metrics that match their billing records
- Price Range: Starter free to $250K cumulative billing, then 0.75%; Performance $599/month; RevenueStory listed as included (verified November 2026)
- Primary Strength: Chargebee RevenueStory delivers 150+ subscription reports whose definitions match Chargebee billing data without a connector.
- Biggest Limitation: Chargebee RevenueStory only reports revenue billed through Chargebee and cannot combine other billing sources.
- One-Line Summary: Chargebee RevenueStory is the most practical subscription analytics option for existing Chargebee customers, who should test it before buying a separate tool.
- Last Verified: November 2026
Overview
Chargebee RevenueStory is the built-in analytics layer of the Chargebee billing platform, made for companies that already bill through Chargebee and want metrics that match their billing data. Chargebee RevenueStory offers more than 150 ready-made reports on MRR, ARR, churn, cohorts and net dollar expansion.
Chargebee RevenueStory is not sold as a standalone product. Chargebee RevenueStory is in this list as a baseline for answering the question “do I need a separate analytics tool at all?”
Key Features
- Chargebee RevenueStory provides more than 150 ready-made reports and about 10 dashboards covering MRR, ARR, churn, cohorts, activations and payments (Chargebee docs, 2026).
- Chargebee RevenueStory runs on Chargebee’s own billing data, so there is no connector to maintain and the definitions match billing.
- Chargebee Retention adds cancellation flows and save offers, and Chargebee Receivables handles collections.
- Chargebee RevRec produces GAAP revenue reports and maps journal entries to accounting systems such as QuickBooks and Xero.
- Chargebee integrates with Stripe and Braintree as payment gateways, along with Salesforce, HubSpot and the app stores.
Best For
Chargebee RevenueStory is best for B2B and B2C subscription companies that bill only through Chargebee and want reliable reporting without adding a separate analytics vendor.
Pricing
Chargebee pricing was verified on chargebee.com/pricing in November 2026:
- Chargebee Starter is free for the first $250K of cumulative billing, then charges 0.75% of billing.
- Chargebee Performance costs $599/month for up to $100K in monthly billing, on an annual commitment.
- Chargebee’s pricing page lists RevenueStory analytics as included on these plans. Warehouse export, multi-site consolidation and AI churn prediction are reported to be Enterprise-only (Whop, 2026).
- Chargebee is reported to be moving some customers to newer “Flow” pricing, so buyers should confirm current terms (CFO Presso, 2026).
Strengths
- Chargebee has the largest verified review base in this list, with a 4.4/5 rating from about 1,020 reviews (G2, 2026; verified November 2026).
- Chargebee customer Rise Vision reports spending 20% less time on weekly reporting in RevenueStory than in its previous third-party analytics tool (Chargebee case study, 2026; vendor-reported).
- Chargebee RevenueStory reduces mismatches with billing data, because its reports draw directly on Chargebee’s billing records.
- Chargebee reported serving 18,000 customers in 160 countries; no more recent figure has been published (Chargebee, 2021; vendor-reported).
Limitations
- Chargebee RevenueStory gives up multi-source coverage in exchange for matching billing exactly. It reports only revenue billed through Chargebee, so revenue from the app stores, PayPal or older billing systems needs another tool.
- Chargebee is expensive to buy for analytics alone. Starter charges 0.75% of billing above $250K cumulative, and Performance starts at $599/month for the whole billing platform (Chargebee, 2026).
- Chargebee users rate customer service as its weakest category, and one reviewer calls it “hard to configure complex subscription renewal logic” (Capterra via Whop, 2026).
- Chargebee RevenueStory limits dashboards to certain roles and has no P&L or runway layer, according to a competitor’s review page (Baremetrics, 2026).
- Chargebee’s usage-based billing is disputed in a r/SaaS thread that is heavily seeded with promotion for other vendors (Reddit r/SaaS, 2025).
Verdict
Chargebee RevenueStory is the right first choice for companies already billing through Chargebee, because its 150+ reports match billing data without any connector.
Chargebee RevenueStory scored 28/45. It leads on native accuracy and setup speed (C1: 4, C6: 4) and is held back by single-source coverage (C2: 2). Chargebee customers should add a standalone tool such as ChartMogul only when they bring in revenue from outside Chargebee.
6. Maxio: Best for B2B SaaS Finance Teams Needing Revenue Recognition

Category: Finance Platform, billing, revenue recognition and SaaS metrics combined in one finance-operations system.
At a Glance
- Category: Finance Platform
- Best For: B2B SaaS finance teams that need MRR and churn tied to revenue recognition and month-end close
- Price Range: Grow from $599/month (up to $100K monthly billings); Scale and Enterprise by custom quote; implementation fees unpublished (verified November 2026)
- Primary Strength: Maxio ties SaaS metrics directly to ASC 606 revenue recognition and the general ledger.
- Biggest Limitation: Maxio has the highest public entry price in this list, plus a documented steep learning curve and dated interface.
- One-Line Summary: Maxio is the best fit for B2B SaaS finance teams that need subscription metrics, billing and ASC 606 revenue recognition in one system rather than a standalone dashboard.
- Last Verified: November 2026
Overview
Maxio is a B2B SaaS finance operations platform for finance teams that need MRR and churn tied directly to the general ledger and month-end close. Maxio combines subscription and usage billing, SaaS metrics, ASC 606 revenue recognition, collections and forecasting.
Maxio was formed in 2021 by combining Chargify and SaaSOptics, and took the Maxio name in 2022 (Maxio, 2026). Maxio makes sense mainly when it replaces several finance tools at once.
Key Features
- Maxio reports MRR, ARR, churn, NRR and cohorts linked to the chart of accounts, so its metrics line up with the income statement (Maxio, 2026).
- Maxio automates ASC 606 and IFRS 15 revenue recognition with more than 25 methods and more than 30 financial reports (Maxio, 2026).
- Maxio handles subscription and usage billing across more than 20 payment gateways.
- Maxio integrates with QuickBooks, Xero, NetSuite, Salesforce and HubSpot.
- Maxio offers a reports-only Maxio Metrics product that runs on top of an existing billing setup.
Best For
Maxio is best for B2B SaaS companies with contract-based revenue and a dedicated finance team that need revenue recognition, collections and month-end close alongside subscription metrics.
Pricing
Maxio pricing was verified on maxio.com/pricing in November 2026:
- Maxio Build offers a free trial or sandbox.
- Maxio Grow starts at $599/month for up to $100K in monthly billings.
- Maxio Scale and Enterprise are priced by custom quote.
- Maxio does not publish implementation fees.
Strengths
- Maxio customer Limble Solutions cut financial reporting from about a month to a few days. An unnamed customer cut manual month-end work from 30–40 hours a month to 10–15 (Maxio case studies, 2026; vendor-reported).
- Maxio holds a 4.3/5 rating from about 831 reviews, the second-largest review base in this list, and reviewers praise its centralised billing data (G2, 2026; verified November 2026).
- Maxio’s benchmarks draw on more than $14B of anonymised SaaS data, and Maxio reports more than 2,000 customers (Maxio, 2026; vendor-reported).
- Maxio ties SaaS metrics to the chart of accounts more directly than any other tool reviewed here, which narrows the gap between metrics and the income statement (Maxio, 2026).
Limitations
- Maxio gives up simplicity in exchange for finance depth. At $599/month plus unpublished implementation fees, Maxio is more platform than an early-stage startup needs (Maxio, 2026).
- Maxio reviewers cite usability issues, including a dated interface, no SSO and a steep learning curve (G2, 2026).
- Maxio reviewers also cite reporting issues: rigid reports that need exports, slow loading and long QuickBooks Online syncs. One reviewer also reports losing access immediately after a missed payment (G2, 2026).
- Maxio draws mixed views on r/SaaS. One commenter, possibly tied to a competitor, calls the merged product “still rough,” while another user rates Maxio’s billing above Stripe’s (Reddit r/SaaS, 2025).
- Maxio’s usage-based billing support is disputed in the same thread, where the original poster said a fix was planned (Reddit r/SaaS, 2025).
Verdict
Maxio is the best subscription analytics choice for B2B SaaS finance teams that need metrics, billing and ASC 606 revenue recognition in one system.
Maxio scored 28/45. It leads on finance actionability (C5: 5) and is held back by entry cost and setup effort (C3: 2, C6: 2). In PlugRoute’s view, Maxio is not cost-effective as a standalone dashboard under roughly $1M ARR. Ask Maxio for a reporting demo before committing.
7. Stripe Billing Analytics: Best Built-In Baseline for Stripe-Only Businesses
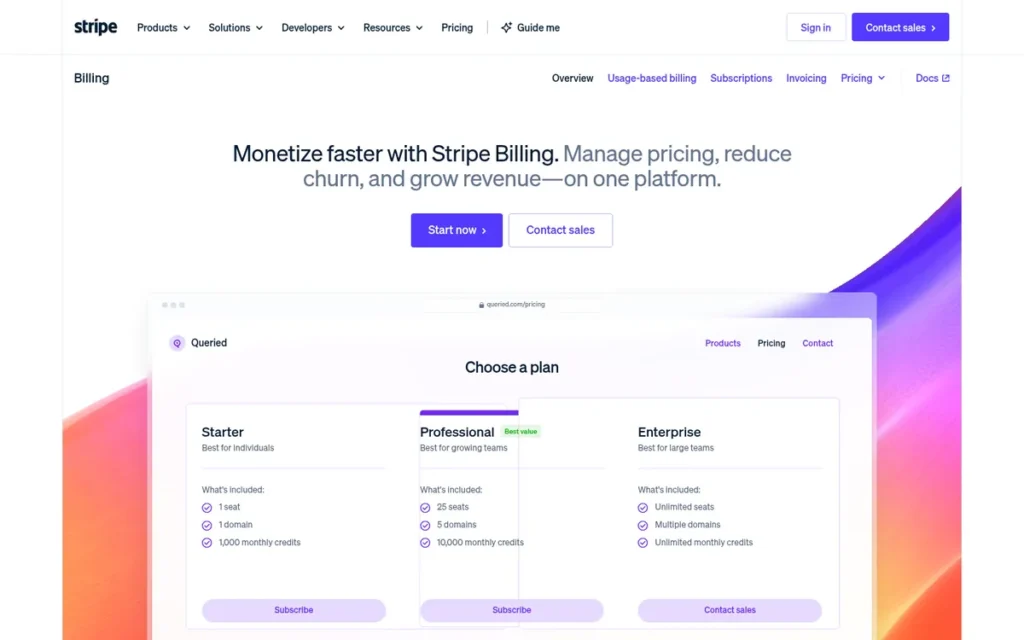
Category: Billing-Native Analytics.
At a Glance
- Category: Billing-Native Analytics
- Best For: Businesses that bill exclusively through Stripe and need basic subscription metrics with zero setup
- Price Range: Included with Stripe Billing (0.7% of Billing volume pay-as-you-go, or from $620/month on annual plans); Sigma and Revenue Recognition priced separately (verified November 2026)
- Primary Strength: Stripe Billing analytics shows MRR, churn and cohort data with no integration and built-in failed-payment recovery.
- Biggest Limitation: Stripe Billing analytics sees only Stripe data and excludes metered products from MRR.
- One-Line Summary: Stripe Billing analytics is the baseline every Stripe-only business should test before buying a dedicated tool, but it cannot combine other billing sources or count metered revenue in MRR.
- Last Verified: November 2026
Overview
Stripe Billing analytics is the native reporting dashboard inside Stripe Billing, built for businesses that bill only through Stripe and need basic subscription metrics fast. Stripe Billing analytics shows MRR, churn, ARPU, LTV, trial conversion and cohort retention with no integration required.
Stripe Billing analytics is the baseline the other tools are measured against. Stripe Billing analytics only looks free: its cost is included in Billing’s percentage-of-volume fee.
Key Features
- Stripe Billing analytics shows MRR, MRR growth, subscriber count, churn, ARPU, LTV, trial conversion and cohort retention in the Billing dashboard (Stripe docs, 2026).
- Stripe Smart Retries handles dunning by retrying failed payments up to 8 times over 2 weeks by default, alongside card-updater tools (Stripe docs, 2026).
- Stripe Sigma lets teams query billing data with SQL or natural language for custom analysis.
- Stripe Data Pipeline exports billing data to Snowflake and Redshift for analysis in a data warehouse.
- Stripe offers Revenue Recognition as a separately priced add-on. Its price could not be confirmed in November 2026.
Best For
Stripe Billing analytics is best for early-stage businesses that bill only through Stripe, have no metered pricing, and can answer their questions with the standard dashboard.
Pricing
Stripe Billing pricing was verified on stripe.com/billing/pricing in November 2026:
- Stripe Billing pay-as-you-go costs 0.7% of Billing volume, on top of payment processing fees.
- Stripe Billing annual plans cost $620/month for up to $100K in volume, $1,500/month up to $250K, $2,950/month up to $500K, and $5,750/month up to $1M.
- Stripe Billing charges 0.67% on volume above each plan’s limit, with custom pricing above $1M.
- Stripe Sigma and Revenue Recognition are priced separately, and their prices could not be confirmed.
Strengths
- Stripe reports that its recovery tools recover 55% of failed payments on average, and 57% for recurring payments according to its Features page. Stripe says the tools recovered $8.2B in 2025 (Stripe, 2026; vendor-reported).
- Stripe Billing is used by more than 350,000 companies and reported 99.999% uptime in 2025 (Stripe, 2026; vendor-reported).
- Stripe Billing analytics needs no integration or extra vendor, because it runs on Stripe’s own billing data.
- Stripe documents exactly what its MRR excludes (taxes, free plans and metered products), which helps teams reconcile against other tools (Stripe docs, 2026).
Limitations
- Stripe Billing analytics trades zero setup for a narrow view. It cannot combine revenue from the App Store, Google Play, PayPal or other processors.
- Stripe Billing analytics excludes metered products from MRR (Stripe docs, 2026), so usage-based businesses will understate recurring revenue.
- Stripe Billing analytics offers few cohort dimensions, Sigma needs SQL skills, and fees rise with volume (Basedash, 2026).
- Stripe Billing has no verified G2 or Capterra rating of its own.
- Stripe’s official r/SaaS account acknowledged that Stripe Billing is “more developer-focused” and that its revenue recognition is “not as finance-team-oriented as Maxio’s” (Reddit r/SaaS, 2025).
Verdict
Stripe Billing analytics is the right starting point for Stripe-only businesses without metered pricing, but it stops being enough once revenue comes from more than one source.
Stripe Billing analytics scored 25/45. It leads on time to metrics (C6: 5) and is held back by Stripe-only coverage (C2: 1). Its last-place rank reflects how well it fits this audience, not product quality. Add ChartMogul, Baremetrics or Paddle Metrics when you need cross-source reporting or metered revenue counted in MRR.
What Does Subscription Analytics Really Cost as You Grow?
At $10M ARR, standalone analytics tools cost between $0 (Paddle Metrics) and about $1,199/month (ChartMogul Pro, billed annually). Revenue-linked platforms such as Stripe Billing and RevenueCat charge about $5,800–$8,300/month in percentage fees, though those fees also cover billing or app infrastructure (PlugRoute estimates, 2026).
The figures below are PlugRoute estimates, calculated from published rates verified in November 2026:
| Tool | ~$500K ARR | ~$3M ARR | ~$10M ARR |
|---|---|---|---|
| ChartMogul (Pro, annual / monthly) | $99 / $119 | $449 / $539 | $1,199 / $1,439 |
| Baremetrics (base, annual / monthly; excl. add-ons) | Growth: $189 / $255 | Growth: $189 / $255 | Scale: $749 / $1,152 |
| Paddle Metrics | $0 | $0 | $0 |
| RevenueCat (1% of MTR) | ~$417 | ~$2,500 | ~$8,333 |
| Chargebee | Starter ~$313 (0.75%) or Performance $599 | Custom quote (above Performance’s $100K monthly cap) | Custom quote |
| Maxio | $599 (Grow) | Custom quote | Custom quote |
| Stripe Billing (0.7% pay-as-you-go) | ~$292 | ~$1,750 | ~$5,833 |
These cost estimates rest on the following assumptions:
- PlugRoute modelled each tool at $500K, $3M and $10M ARR, assuming monthly revenue equals ARR divided by 12.
- RevenueCat’s MTR is counted before store fees and tax, so actual RevenueCat costs may be higher than these figures.
- The Chargebee Starter estimate assumes the $250K cumulative free threshold has already been passed.
- Chargebee and Stripe Billing fees pay for the whole billing platform, not just analytics, and Stripe charges payment processing fees on top.
- Baremetrics Recover and Cancellation Insights add $129/month each, and ChartMogul Starter is cheaper than Pro if you use only one billing source.
Here is an example at $2M ARR with Stripe plus the App Store. ChartMogul Pro costs $449/month billed annually, because Starter allows only one billing system.
At the same $2M ARR, Baremetrics Growth (2 integrations) costs $189/month billed annually. Adding Recover and Cancellation Insights raises that to $447/month, within a few dollars of ChartMogul Pro (PlugRoute estimate, 2026).
PlugRoute re-checks prices when it updates this review. Vendors change pricing often; for example, Chargebee is reported to be moving some customers to newer pricing (CFO Presso, 2026).
Why Don’t My MRR and Churn Numbers Match My Billing System?
MRR and churn numbers rarely match your billing system because each tool defines them differently. Stripe excludes metered products from MRR, Paddle Metrics counts churn when the paid period ends, and RevenueCat’s MTR includes non-subscription purchases before store fees. How often tools refresh their data also ranges from about 15–20 minutes to 3–6 hours.
“Export Stripe CSV, Paste into Google Sheets, Manually calculate MRR, churn, runway, Get frustrated when numbers didn’t match” (u/TemporaryArugula5234, r/microsaas (Reddit r/microsaas, 2026; the post promotes the author’s own tool))
Takeaway: Founders who rely on Stripe exports and spreadsheets often cannot reconcile MRR and churn, which is the gap dedicated analytics tools aim to close.
These documented definition differences explain most mismatches:
- Stripe Billing analytics excludes taxes, free plans and metered products from MRR (Stripe docs, 2026).
- Paddle Metrics counts churn at the end of the paid period and treats returning customers as reactivations (Paddle developer docs, 2026).
- RevenueCat’s MTR is not MRR, because it includes one-time purchases and is counted before store fees and tax (RevenueCat docs, 2026).
- Chargebee RevenueStory refreshes about every 15–20 minutes, according to a competitor’s comparison page (ChartMogul, 2026). Paddle Metrics refreshes every 3–6 hours.
- Usage-based pricing makes these gaps more common, because 21.2% of SaaS operators use usage-based pricing (SBI/Price Intelligently via Orb, 2025).
Before you buy, run each of these billing events through the tool’s trial and compare the results with your billing records:
- Trials should appear as new MRR only on the date they convert.
- Annual plans should be converted correctly into monthly figures.
- Refunds, prorations and coupons should reduce MRR the way your finance team expects.
- Upgrades, downgrades and pauses should be classified as the correct MRR movement.
- Billing migrations and currency switches should not show up as false churn or false expansion.
- Metered charges and sandbox data should be included or excluded deliberately, not by default.
No subscription analytics tool reviewed by PlugRoute in 2026 defines MRR the same way as every billing system. The right test is not “is it accurate?” but “does it define revenue the way my finance team does?”
What Red Flags Should I Watch For When Evaluating Subscription Analytics Software?
The five biggest red flags in subscription analytics software are:
- metered revenue left out of MRR
- plan limits on billing sources
- revenue-linked pricing with no published ceiling
- sandbox data mixed into live metrics
- an unclear roadmap after an acquisition
Each one can distort investor reporting or raise your costs later.
Red Flag #1: Metered Revenue Excluded from MRR Some tools leave metered revenue out of MRR, which understates recurring revenue for usage-based businesses. Stripe Billing analytics and Paddle Metrics both document this exclusion (Stripe docs, 2026; Paddle, 2026), so confirm how usage charges are treated.
Take a company billing $40K a month in seat subscriptions plus $15K in usage charges. Both tools would show $40K MRR, so its board deck could understate recurring revenue by about 27% (PlugRoute example, 2026).
Red Flag #2: Plan Limits on Billing Sources A lower-tier plan may connect only one billing system, which forces an upgrade when you add a second one. ChartMogul Starter allows 1 billing system (Pro: 5), and Baremetrics Launch allows 1 integration (Growth: 2) (ChartMogul and Baremetrics pricing pages, 2026).
Red Flag #3: Pricing That Scales with Revenue Without a Published Ceiling Percentage-of-revenue pricing turns your analytics bill into a cost that grows with your business. RevenueCat charges 1% of MTR, Stripe Billing charges 0.7% of Billing volume, and Chargebee Starter charges 0.75% above $250K cumulative billing (vendor pricing pages, 2026).
Red Flag #4: Sandbox Data Mixed into Live Metrics Test transactions that leak into production dashboards inflate subscriber counts and distort conversion rates. RevenueCat reviewers report sandbox users mixed into metrics (G2 and Software Advice, 2026), so check whether any tool cleanly separates test data from live data.
Red Flag #5: Unclear Product Roadmap After an Acquisition A change of owner can shift a product’s priorities, connectors or pricing without a formal announcement. Paddle is folding Metrics into Paddle Billing after buying ProfitWell (TechCrunch, 2022), and Baremetrics’ current ownership could not be confirmed after its 2020 sale.
What Questions Should I Ask Before Choosing Subscription Analytics Software?
Before choosing subscription analytics software, ask:
- how the tool defines churn
- whether your plan combines every billing source
- what you will pay at three times your current ARR
- whether test billing events match your records
- whether analytics connect to failed-payment recovery
- how metered revenue is counted
- how long setup takes
The answers show whether the tool fits your setup and what it will cost long term.
Question #1: How does the tool define churn timing and reactivation? The vendor should point you to documented definitions of when churn is counted and how returning customers are classified. Paddle Metrics, for example, counts churn at the end of the paid period (Paddle developer docs, 2026). Undocumented definitions make your numbers hard to defend to investors.
Question #2: Can my current plan combine every billing source I use? The vendor should confirm in writing that your plan supports every processor and app store you bill through. Billing-native tools such as Chargebee RevenueStory cover only their own platform, and standalone plans such as ChartMogul Starter and Baremetrics Launch limit how many sources you can connect.
Question #3: What will I pay at 3x my current ARR, including add-ons? The vendor should quote your cost at your projected revenue, including add-ons and implementation fees. Baremetrics add-ons cost $129/month each, and Maxio does not publish implementation fees (Baremetrics and Maxio pricing pages, 2026), so ask for a written quote.
Question #4: Do test renewals, upgrades, refunds and cancellations match my billing records? A trial should let you reproduce real billing events and compare the tool’s MRR movements against your billing system line by line. PlugRoute found reconciliation complaints in review or documentation sources for every tool in this review, so test with your own data.
Question #5: Does analytics connect to failed-payment recovery? The vendor should explain whether dunning and involuntary-churn recovery are built in, included in the price or sold as an add-on. Stripe Smart Retries, Baremetrics Recover, Paddle Retain and Chargebee Retention each work differently, and each vendor defines its recovery rate in its own way.
Question #6: How does the tool count metered and usage-based revenue? The vendor should state whether usage charges appear in MRR or are excluded by design. Stripe Billing analytics and Paddle Metrics document exclusions, while ChartMogul says it handles usage-based overages (ChartMogul, 2026; vendor claim), so test a real usage invoice during the trial.
Question #7: How long until I have investor-grade metrics, and what setup is required? The vendor should estimate setup time and say whether engineering work is needed. Stripe Billing analytics and Chargebee RevenueStory need no connector, RevenueCat needs an SDK, and Maxio reviewers report a steep learning curve (G2, 2026).
How Did We Rank These Subscription Analytics Tools?
PlugRoute scored each of the seven tools from 1 to 5 on six published criteria. The three primary criteria count double, for a maximum of 45 points, and ties are broken by verified review volume. Scores rely on vendor documentation, published pricing, review platforms and community reports verified in November 2026, not on hands-on data tests.
The three primary criteria are weighted ×2:
- C1: Metric Accuracy and Definition Transparency matters because numbers that do not match billing were the most common complaint across all seven products.
- C2: Billing-Source Coverage and Consolidation matters because a tool that cannot combine your sources leaves an incomplete revenue view.
- C3: Pricing Transparency and Cost Predictability at Scale matters because pricing tied to ARR or billing volume makes total cost hard to forecast.
The three secondary criteria are weighted ×1:
- C4: Verified Review Ratings and Volume matters because a rating backed by more independent reviews is more reliable.
- C5: Actionability Beyond Reporting matters because failed payments and cancellations lose revenue unless analytics connect to action.
- C6: Time to Investor-Grade Metrics matters because founders need board-ready metrics without a long implementation.
PlugRoute used these scoring anchors for the two most disputed criteria:
- C1 anchors: 5 requires published definitions, documented handling of complex events and no recurring accuracy complaints; no tool met it. 4 means definitions tied to billing or ledger records, or documented complex-event handling with limited complaints. 3 means documented revenue exclusions or recurring accuracy complaints.
- C4 anchors: 5 means 4.7/5 or higher from 200+ verified reviews. 4 means 4.4–4.6/5 verified. 3 means 4.3/5 or below, or a rating that covers only the whole platform. 2 means no verified rating.
| Rank | Tool | C1 (×2) | C2 (×2) | C3 (×2) | C4 | C5 | C6 | Total /45 |
|---|---|---|---|---|---|---|---|---|
| 1 | ChartMogul | 4 | 5 | 4 | 4 | 3 | 4 | 37 |
| 2 | Baremetrics | 3 | 4 | 3 | 4 | 5 | 4 | 33 |
| 3 | Paddle Metrics | 3 | 3 | 5 | 3 | 3 | 4 | 32 |
| 4 | RevenueCat | 3 | 3 | 3 | 5 | 4 | 3 | 30 |
| 5 | Chargebee RevenueStory | 4 | 2 | 2 | 4 | 4 | 4 | 28 |
| 6 | Maxio | 4 | 3 | 2 | 3 | 5 | 2 | 28 |
| 7 | Stripe Billing analytics | 3 | 1 | 3 | 2 | 4 | 5 | 25 |
The score rationale table gives the evidence behind every score:
| Tool | C1 | C2 | C3 | C4 | C5 | C6 |
|---|---|---|---|---|---|---|
| ChartMogul | Documented migration and currency handling; G2 data-troubleshooting complaints | Links one customer across up to 5 sources on Pro (15 Enterprise) | Full ARR bands published; cost rises with ARR | 4.5–4.6/5, 112–113 G2 reviews | Benchmarks and CRM; no native recovery | Fast setup praised; learning curve noted |
| Baremetrics | No published definition document found; reconciliation acknowledged | 9 named connectors plus universal connector; plan caps | Published tiers; $129 add-ons; integration caps | 4.6/5, 98 G2 reviews | Recover, Cancellation Insights, forecasting | Connector-based setup |
| Paddle Metrics | Published definitions; excludes one-time and metered | Stripe only as subscription system; connector list historical | $0, no published cap | Platform-level rating only | Retain sold separately at a negotiated fee | Free and fast setup per reviewers |
| RevenueCat | MTR is not MRR; currency, VAT and sandbox complaints | App stores plus Stripe web billing | Published 1% of MTR; grows with revenue | 4.8/5, ~214 G2 reviews | Paywalls, Experiments, entitlements | SDK integration required |
| Chargebee RevenueStory | Definitions match billing records | Chargebee-billed data only | High cost for analytics-only use | 4.4/5, ~1,020 G2 reviews | Retention, Receivables, RevRec | No connector needed |
| Maxio | Metrics tied to chart of accounts | 20+ gateways; reports-only Metrics product | From $599; implementation fees unpublished | 4.3/5, ~831 G2 reviews | ASC 606, collections, forecasting | Steep learning curve |
| Stripe Billing analytics | Documented exclusions, including metered | Stripe data only | 0.7% published; Sigma and RevRec prices unconfirmed | No Billing-only rating | Smart Retries, Sigma | No integration needed |
Chargebee RevenueStory and Maxio tied at 28 points. Chargebee ranks fifth on the tiebreak because it has about 1,020 G2 reviews, compared with about 831 for Maxio.
For billing-native tools, PlugRoute scores C3 on the cost of using the platform mainly for analytics, not on price transparency alone. On transparency alone, Chargebee would score 3 on C3, tie RevenueCat at 30 points and move to #4 on the tiebreak.
PlugRoute made the following inclusion and sourcing decisions:
- PlugRoute included Stripe and Chargebee as billing-native baselines, so readers can judge whether they need a separate tool at all.
- PlugRoute excluded Recurly (G2 4.1, about 223 reviews) because Recurly is mainly a billing platform.
- PlugRoute excluded SaaSGrid because SaaSGrid’s operating status in 2026 could not be confirmed.
- PlugRoute labels competitor-authored sources, such as Baremetrics’ blog comparisons and ChartMogul’s comparison pages, wherever it uses them.
- PlugRoute treats Reddit threads, which are heavily seeded with vendor promotion in this category, as context only.
PlugRoute has no affiliate relationships with any company listed. Rankings are determined entirely by research data and objective evaluation criteria.
What Do Buyers Most Often Ask About Subscription Analytics Software?
Buyers most often ask which subscription analytics tool suits SaaS startups, how to handle several billing systems, and how PlugRoute decides its rankings. The answers below draw on the same evidence behind the rankings, verified in November 2026, and each answer stands on its own.
What is the best subscription analytics software for SaaS startups in 2026?
ChartMogul is the best subscription analytics software for most SaaS startups in 2026, and its free plan covers up to $120K ARR. Paddle Metrics is the best free option for purely recurring revenue. Baremetrics suits startups fighting failed payments, and RevenueCat suits mobile apps. Stripe-only startups should test Stripe’s built-in dashboard first.
How do I choose subscription analytics software when I use multiple billing systems?
Choose a standalone tool whose plan supports every billing source you use. ChartMogul Pro links one customer across up to 5 billing sources (15 on Enterprise). Baremetrics Growth allows 2 integrations and Scale allows unlimited integrations. Stripe and Chargebee’s built-in dashboards cannot combine outside sources, so neither works alone for multi-source revenue.
How does PlugRoute determine rankings?
PlugRoute ranks tools by a weighted score out of 45 across six published criteria, and metric accuracy, billing-source coverage and pricing predictability count double. Evidence comes from vendor documentation, published pricing, G2 and Capterra reviews, and community reports verified in November 2026. Vendor-reported and competitor-authored sources are labelled throughout.
What Do Key Subscription Analytics Software Terms Mean?
MRR (Monthly Recurring Revenue): The recurring subscription revenue a business earns each month, and the main number most subscription analytics tools report. Tools define it differently: some leave out taxes, free plans or metered charges. Check how a vendor calculates MRR before you trust it in a board deck.
ARR (Annual Recurring Revenue): Recurring revenue measured on a yearly basis. It matters to buyers twice: it is a headline metric for investors, and many vendors set their price bands by how much ARR you track, so your analytics bill can rise as you grow.
Churn: Customers or revenue lost when subscriptions end. Some tools count churn when a customer cancels and others count it when the paid period ends, so two tools can show different churn for the same business. Ask each vendor for its documented definition.
MRR Movements: A breakdown of how MRR changes each period into new, expansion, contraction, reactivation and churn. This breakdown shows where growth and losses come from. Test that upgrades, downgrades, pauses and billing migrations are put in the right category.
NRR and GRR (Net and Gross Revenue Retention): Measures of how much revenue you keep from existing customers. Net retention counts expansion, and gross retention does not. Investors often ask for both before a fundraise, but they are only as reliable as the tool’s underlying definitions.
Cohort Retention: A report that groups customers by when they started and tracks how many stay over time. It shows whether retention is getting better or worse with newer customers. Some tools offer only a few ways to slice cohorts.
Metered (Usage-Based) Billing: Pricing where customers pay for what they use instead of a fixed subscription fee. Some tools leave metered charges out of MRR, which understates recurring revenue for usage-based businesses, so test a real usage invoice during a trial.
MTR (Monthly Tracked Revenue): A pricing unit used by some mobile subscription platforms. It includes non-subscription purchases and is counted before store fees and tax. MTR is not the same as MRR, and fees calculated on it can be higher than you expect.
Dunning (Failed-Payment Recovery): Automated retries, emails, card-update pages and other prompts that recover payments that failed. Without it, you lose that revenue to involuntary churn. Some vendors build it in, some sell it as an add-on, and some charge a share of the revenue they recover.
ASC 606 Revenue Recognition: The accounting standard that governs when subscription revenue is recorded as earned. Finance teams that need revenue recognition and month-end close tied to the general ledger should choose a tool that handles it directly, not one that only offers a metrics dashboard.
Billing-Native Analytics: Reporting built into a billing platform. Its definitions match your billing records and no connector is needed, but it covers only that platform’s data and cannot combine revenue from other processors or the app stores.
Sandbox Data: Test transactions created during development. If they leak into live dashboards, they inflate subscriber counts and distort conversion rates, so check that a tool keeps test data separate from production data.
Which Subscription Analytics Tool Is Right for You?
Key Insights
- ChartMogul scored highest (37/45) because it documents the deepest customer-level consolidation across billing sources (up to 5 on Pro) and publishes full ARR-band pricing.
- Stripe Billing analytics and Paddle Metrics both exclude metered revenue from MRR (Stripe docs, 2026; Paddle, 2026), so usage-based businesses should not rely on either alone.
- RevenueCat’s Monthly Tracked Revenue is not MRR, because it includes non-subscription purchases and is counted before store fees and tax (RevenueCat docs, 2026).
- Paddle Metrics is the only standalone tool in this list that offers core subscription metrics at $0 with no published ARR cap (Paddle, 2026; verified November 2026).
- NRR and GRR figures are only as reliable as each tool’s definitions. PlugRoute found reconciliation complaints for every tool reviewed, so testing real billing events during a trial is essential.
If you bill only through Stripe and have no metered pricing, start with the Stripe Billing dashboard. Move to ChartMogul or Baremetrics when you add a second source or need investor-grade cohorts.
If most of your revenue comes from the app stores, choose RevenueCat and model its 1% fee against your projected growth. Chargebee customers should test RevenueStory first, and B2B finance teams that need revenue recognition should evaluate Maxio.
Revisit your analytics tool when any of these happen:
- Your company adds a second billing source.
- Your company introduces metered or usage-based pricing.
- Your tracked ARR crosses a pricing band, such as ChartMogul’s $500K, $1M or $3M thresholds or Baremetrics’ $360K and $3.6M thresholds.
- Your company prepares a fundraise and needs reconciled NRR and GRR.
Subscription billing management is projected to grow from $9.5B in 2026 to $18.0B by 2033 (Grand View Research, 2026). In PlugRoute’s view, metric definitions and cost at scale will remain the deciding factors as the category grows.
Read PlugRoute’s full scoring methodology and our other independent SaaS reviews before you shortlist a tool.
We update this guide quarterly. Last updated: November 2026.