For large-scale interactive network exploration, Gephi is the highest-scoring open-source desktop tool in peer-reviewed benchmarking with a scalability score of 5/5 PMC5540468, 2017; for custom web-based graph applications, D3.js is the developer standard with approximately 112,000 GitHub stars as of May 2026; for bioinformatics research, Cytoscape is the field benchmark with NIH institutional backing since 2002. Every tool has a documented performance ceiling, selecting the wrong one means discovering that limit mid-project.
“Graph visualization software” means two fundamentally different things: BI dashboards and chart tools (Tableau, Power BI, Looker Studio) and node-edge network visualization tools that render relational structures as interconnected nodes and edges. Community frustration confirms this terminology gap, “Why are there no good graph visualisation programs?” (r/datascience, 2023), most likely reflecting users finding BI dashboard tools when searching for node-edge network tools. This article covers node-edge network visualization only; readers evaluating Tableau or Power BI for business intelligence dashboards should look elsewhere.
PlugRoute has no affiliate relationships with any company listed; rankings are determined entirely by research data and objective evaluation criteria.
What Are the Top Graph Visualization Tool Picks at a Glance?
- Gephi is the peer-reviewed leader for large-scale interactive network exploration, rated 5 out of 5 for scalability in published NIH benchmarking PMC5540468, 2017 and documented for networks from 10 nodes to approximately 10 million nodes via OpenGL rendering.
- D3.js is the most widely adopted JavaScript network visualization library with approximately 112,000 GitHub stars as of May 2026, offering maximum rendering control across SVG, Canvas, and WebGL for developers building fully custom, production-grade graph web applications.
- Cytoscape is one of the most widely cited free network analysis platforms in published research, accumulating 1,000+ academic citations per year with NIH institutional backing since 2002 and a 300-app bioinformatics plugin ecosystem.
- Neo4j Bloom is the only database-native graph exploration interface in this evaluation, enabling natural language query generation for non-technical Neo4j database exploration, backed by over $580 million in institutional venture funding.
- Graphviz is the standard automated graph layout system for code-defined, reproducible documentation diagrams, with tens of millions of monthly Python package downloads (pypistats.org, May 2026) and 30+ years of development since its AT&T Bell Labs origin.
- Vis.js is the fastest path to interactive web-based node-edge graph prototyping, with Python (Pyvis) and R (visNetwork) wrappers extending its reach to data science workflows without JavaScript knowledge.
- yEd Graph Editor is the only free tool in this evaluation enabling zero-code professional network diagram creation from Excel data with one-click automatic layout powered by commercial-grade yFiles SDK algorithms.
What Are the Different Types of Graph Visualization Tools?
Three functional categories of node-edge graph visualization tools exist: interactive desktop applications (Gephi, Cytoscape, yEd), JavaScript web libraries for browser-based deployment (D3.js, Vis.js), and specialized-purpose tools optimized for single workflows (Neo4j Bloom for database exploration, Graphviz for automated static diagrams). Matching category to workflow is the first evaluation decision, before any feature comparison begins.
Category 1: Interactive Desktop Applications
Interactive desktop applications render node-edge networks through a GUI installed locally, no coding required. This category includes:
- Gephi (#1): large-scale network exploration, documented for tens of thousands to millions of nodes
- Cytoscape (#3): bioinformatics and attribute-rich research on networks below approximately 10,000 elements
- yEd Graph Editor (#7): no-code diagram creation from Excel and XML data with one-click automatic layout
Desktop tools are best for researchers, analysts, and business users who need exploratory interaction with graph data without writing code.
Category 2: JavaScript and Web Libraries
JavaScript and web libraries are code-first tools for embedding interactive network visualizations in web applications and dashboards. This category includes:
- D3.js (#2): maximum customization requiring advanced JavaScript expertise and significant development time
- Vis.js (#6): rapid prototyping with built-in physics simulation, accessible via Python (Pyvis) and R (visNetwork) wrappers
Both produce browser-rendered, interactive outputs. D3.js requires advanced JavaScript expertise; Vis.js requires intermediate JavaScript or none at all through its documented wrapper packages.
Category 3: Specialized-Purpose Tools
Specialized-purpose tools are optimized for a single workflow rather than general-purpose exploration. This category includes:
- Neo4j Bloom (#4): enterprise graph database exploration requiring an active Neo4j database connection
- Graphviz (#5): automated, code-defined static diagram generation for CI/CD pipelines and documentation workflows
Neither is suitable as a general-purpose network analysis tool: Neo4j Bloom cannot function without Neo4j infrastructure, and Graphviz produces static non-interactive outputs only.
How Do the Top Graph Visualization Tools Compare?
| Rank | Company | Category | Best For | One-Line Summary | Key Capabilities | Primary Strength | Key Limitation |
|---|---|---|---|---|---|---|---|
| 1 | Gephi | Network Explorer | Large-scale interactive network exploration | Gephi is the highest-scoring open-source desktop tool for large-scale network visualization in peer-reviewed benchmarking, rated 5/5 for scalability PMC5540468, 2017. | ForceAtlas 2 algorithm; 12+ file formats; OpenGL rendering; built-in centrality metrics; plugin marketplace | Peer-reviewed 5/5 scalability; parallel layout, filtering, and analysis processing; documented for networks up to ~10M nodes | 20-column attribute cap; no Python API; desktop-only; no live database connection |
| 2 | D3.js | Visualization Library | Custom web-based graph application development | D3.js is the most widely adopted JavaScript network visualization library with approximately 112,000 GitHub stars as of May 2026. | SVG/Canvas/WebGL rendering targets; four-force physics simulation; React integration; ISC license; data-source agnostic | ~112,000 GitHub stars (May 2026); maximum rendering flexibility across three rendering targets | Low-level primitive; all UI features must be hand-coded; advanced JavaScript required; excludes non-technical users |
| 3 | Cytoscape | Analysis Platform | Bioinformatics, life sciences, and attribute-rich research | Cytoscape is one of the most widely cited free network analysis platforms in published research, accumulating 1,000+ academic citations per year with NIH institutional backing since 2002. | 300-app bioinformatics plugin ecosystem; compound graph support; Python API (py4cytoscape); CyREST HTTP REST API; peer-reviewed 5/5 visual styles | 1,000+ citations/year (PMC6717989, 2024); NIH-backed since 2002; peer-reviewed 5/5 visual styles PMC5540468, 2017 | ~10,000-element ceiling; peer-reviewed 3/5 scalability PMC5540468, 2017 |
| 4 | Neo4j Bloom | Graph Database Explorer | Enterprise Neo4j database exploration | Neo4j Bloom is the only database-native graph exploration interface in this evaluation, enabling natural language-driven visualization within the Neo4j ecosystem. | Natural language Cypher generation; perspective-based team sharing; GDS algorithm integration; timeline analysis; scene actions | Natural language search eliminates Cypher knowledge requirement for business analysts; no developer mediation needed | Complete Neo4j vendor lock-in; ~$36,000+/year enterprise self-hosted minimum; infrastructure prerequisite |
| 5 | Graphviz | Automated Diagrammer | Code-defined, automated, and reproducible documentation diagrams | Graphviz is the standard automated graph layout system, with tens of millions of monthly Python package downloads and 30+ years of continuous development since its AT&T Bell Labs origin. | 7+ layout engines (dot, neato, fdp, sfdp, twopi, circo); DOT language; Python API; SVG/PDF/PNG publication-ready output; embedded in Sphinx/PlantUML/Terraform | Tens of millions of monthly PyPI downloads (pypistats.org, May 2026); embedded in Sphinx, PlantUML, and Terraform; version 14.1.5 released April 2026 | Static output only; no interactivity; ~1,000-node ceiling for hierarchical dot layouts |
| 6 | Vis.js | Web Network Library | Rapid web-based network visualization prototyping | Vis.js is a free MIT-licensed JavaScript network visualization library with Pyvis (Python/Jupyter) and visNetwork (R) wrappers eliminating the JavaScript requirement for data scientists. | Built-in physics simulation; complete node/edge styling API; built-in clustering; MIT license; Pyvis wrapper (arXiv:2006.04951); visNetwork R package | Lowest time-to-prototype of any JavaScript library; Python and R accessible via documented wrappers at zero cost | Canvas-only rendering; ~3,000–5,000 node ceiling; no WebGL support path |
| 7 | yEd Graph Editor | Diagramming Editor | No-code diagram creation from Excel and XML data | yEd Graph Editor is the only free tool in this evaluation enabling zero-code professional network diagram creation from Excel data with one-click automatic layout using commercial-grade yFiles algorithms. | 7+ one-click layouts from yFiles SDK; Excel/XML import; 10+ diagram types; 7+ export formats; zero programming required | Only free tool requiring zero coding for full diagram creation from tabular data; commercial-grade yFiles layout algorithms | No Python/R/REST API; no CLI; manual-only; no autosave; undocumented scalability benchmarks |
Which Graph Visualization Tool Should I Choose for My Use Case?
| Your #1 Priority | Recommended Tool | Why | Acceptable Alternative (and Why) |
|---|---|---|---|
| Large-network researcher (network exceeds 10,000 nodes) | Gephi (#1) | Peer-reviewed 5/5 scalability PMC5540468, 2017; documented for tens of thousands to millions of nodes; completely free | D3.js with WebGL (for web deployment; requires advanced JavaScript expertise) |
| Bioinformatics / life sciences researcher | Cytoscape (#3) | NIH-backed since 2002; 300+ biological plugins; Python API (py4cytoscape); 1,000+ citations/year | Gephi (for networks exceeding 10,000 elements where scalability overrides biological integration) |
| Developer building custom web application | D3.js (#2) | Maximum customization; SVG/Canvas/WebGL rendering targets; React-compatible; ~112,000 GitHub stars | Vis.js (for rapid prototyping with planned D3.js migration as requirements scale) |
| Data scientist; Python / Jupyter workflows | Cytoscape (#3) | py4cytoscape Python API; CyREST HTTP REST API; programmatic data loading from Python or R | Vis.js via Pyvis wrapper (arXiv:2006.04951) for networks below approximately 5,000 nodes |
| Software engineer; automated CI/CD documentation | Graphviz (#5) | DOT language; 7+ layout engines; embedded in Sphinx/PlantUML/Terraform; tens of millions of PyPI downloads/month | D3.js (for interactive documentation layers requiring JavaScript expertise) |
| Business analyst; zero coding permitted | yEd Graph Editor (#7) | Only free tool with Excel import and one-click automatic layout; no programming required | Gephi (for non-technical users comfortable with GUI data loading of pre-formatted graph files) |
| Enterprise team with existing Neo4j infrastructure | Neo4j Bloom (#4) | Native Neo4j integration; natural language search; perspective-based team sharing | No suitable alternative within the Neo4j ecosystem for non-technical business analyst exploration |
Paired Tool Combinations: Some workflows benefit from two tools used together. Graphviz plus Gephi serves automated documentation plus large-scale interactive exploration. Cytoscape plus Gephi covers attribute-rich bioinformatics analysis below 10,000 elements plus full-interactome visualization above it. D3.js plus Vis.js enables rapid prototyping first, then migration to D3.js as production requirements firm up. Using two tools is not a failure to decide, it reflects matching the right tool to the right stage of the same workflow.
1. Gephi: Best for Large-Scale Interactive Network Exploration
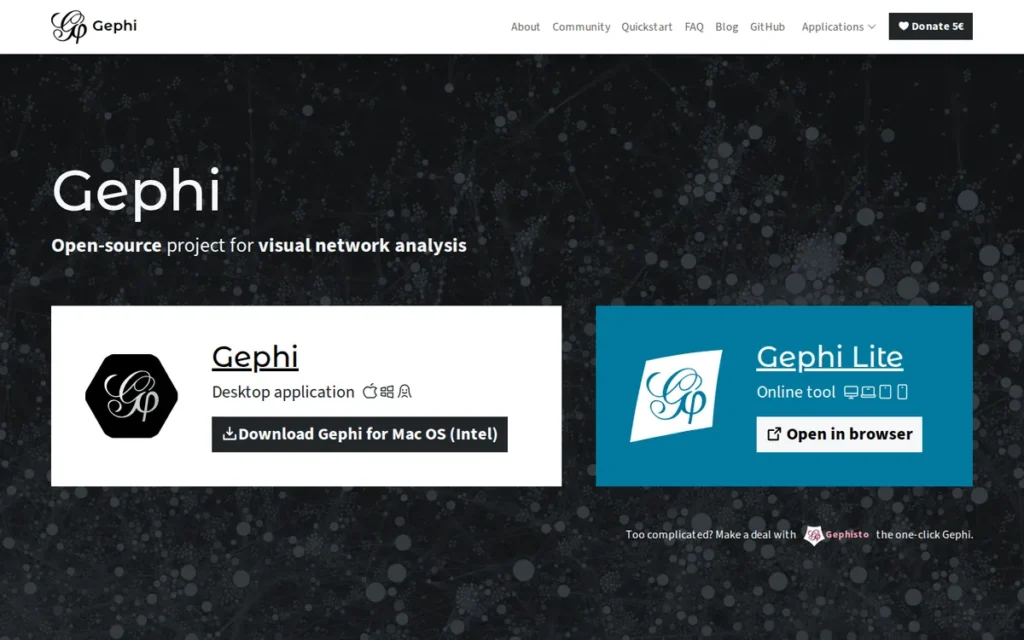
Category: Network Explorer, an open-source desktop application for interactive visualization and analysis of large node-edge graphs and networks.
At a Glance
- Category: Network Explorer
- Best For: Academic researchers, data scientists, and analysts needing interactive large-scale network visualization without coding
- Price Range: Free (open-source, no paid tiers, community-supported via optional donations)
- Primary Strength: Gephi is the highest-scoring open-source desktop tool in peer-reviewed benchmarking, rated 5 out of 5 for scalability in a published NIH comparative study PMC5540468, 2017, with documented capability for networks from 10 to approximately 10 million nodes via OpenGL rendering
- Biggest Limitation: Gephi’s data table caps visible attribute columns at 20 and does not support node or edge attribute inspection directly from the graph view, limiting heterogeneous data management workflows
- One-Line Summary: Gephi is the highest-scoring open-source desktop tool for large-scale network visualization in peer-reviewed benchmarking, rated 5 out of 5 for scalability PMC5540468, 2017 and documented for networks from 10 to approximately 10 million nodes via OpenGL rendering.
- Last Verified: May 2026
Overview
Gephi ranks #1 by scoring highest on Scalability (C1: peer-reviewed 5/5, PMC5540468, 2017) and Feature Depth (C2: ForceAtlas 2, 12+ file formats, parallel processing) (the two primary-weighted criteria) at zero total cost with no infrastructure prerequisite.
Gephi is an open-source interactive desktop application for exploring and analyzing large networks (handling graphs from 10 nodes to approximately 10 million using OpenGL rendering) built for academic researchers, data scientists, and analysts who need to visualize complex relational data without writing code. Gephi is sometimes called “Photoshop for graphs,” reflecting its position as the de facto standard for social network analysis, biological systems, and dynamic temporal networks in academic and research contexts.
Gephi’s broad file format support (12+ formats) and simultaneous parallel processing of layout, filtering, and analysis distinguish Gephi from tools that handle these operations sequentially.
Real-time interactive performance is well-maintained in the tens-of-thousands range, with documented performance decreasing on standard hardware above approximately 100,000 nodes based on published benchmark data.
Key Features
- ForceAtlas 2 Algorithm: Gephi’s proprietary ForceAtlas 2 algorithm: developed specifically for Gephi, produces force-directed layouts that organically reveal cluster patterns in social and biological networks and is widely cited in peer-reviewed network analysis literature as among the most effective force-directed algorithms in its class.
- 12+ File Format Support: Gephi supports over 12 graph file formats including GEXF, GDF, GML, GraphML, Pajek NET, GraphViz DOT, CSV, and UCINET DL, enabling direct import from virtually any graph data source without file conversion overhead.
- Built-In Analytical Metrics: Gephi provides built-in computation of degree centrality, betweenness centrality, clustering coefficient, modularity, and PageRank, all calculated directly within the Gephi visualization interface without requiring external analysis tools.
- OpenGL-Accelerated Rendering: Gephi renders using OpenGL-accelerated graphics, enabling simultaneous real-time interactive operations including layout computation, filtering, and node dragging on networks of tens of thousands of nodes, with capability documented up to approximately 10 million nodes (gephi.org, verified May 2026).
- Plugin Ecosystem: Gephi’s built-in plugin marketplace extends Gephi’s core capabilities with community-contributed layout algorithms, attribute management tools, and export integrations, all accessible without leaving the application.
Best For
Gephi is best for academic researchers, social network analysts, and data scientists who need interactive exploratory analysis of medium-to-large networks (from tens of thousands to millions of nodes) without JavaScript or Python programming, particularly for community detection, centrality analysis, and publication-quality network figure generation in fields such as computational social science, bibliometrics, and network biology. Gephi is not ideal for Python-pipeline-driven workflows, cloud collaboration, or live database-connected exploration.
Pricing
Gephi is completely free and open-source with no paid tiers, enterprise licensing fees, or subscription plans of any kind. Gephi is supported entirely by community donations and volunteer development. (Verified May 2026, gephi.org)
Strengths
- A peer-reviewed comparative study published in PubMed Central PMC5540468, 2017 rated Gephi 5 out of 5 for scalability (the highest score in the comparison) concluding: “Gephi clearly outperforms Cytoscape in terms of scalability and memory efficiency and, in our opinion, it is the best generic visualization tool for layouting large-scale networks.” This is the strongest independent benchmark available for any free desktop graph visualization tool.
- Gephi’s official documentation confirms capability for networks from 10 to approximately 10 million nodes via OpenGL-based rendering (gephi.org, verified May 2026), with real-time interactive performance well-maintained in the tens-of-thousands range, a scalability profile no other free desktop tool in this evaluation documents in published sources.
- Gephi won the Duke’s Choice Award at JavaOne 2010: one of the most prestigious Java innovation recognition awards, and participated in Google Summer of Code from 2009 to 2013, providing institutional validation of technical quality through competitive program selection. (gephi.org/about)
- Gephi’s development team re-engaged in 2021 following a period of reduced activity (2017–2021), with active community maintenance continuing as of May 2026, confirming ongoing viability for research-critical workflows despite its volunteer-driven development model. (gephi.org/about)
Users on r/datascience validated Gephi for academic network analysis:
“Gephi makes the best network graphics. Easy to use, some bugs (depending if you use more complex stuff) but unless you go with R I can really recommend Gephi. Used it for multiple analysis in my masters.” Posted by u/Yojihito
Takeaway: Academic researchers with real multi-project experience consistently recommend Gephi as the default network visualization tool, treating its minor bugs as acceptable trade-offs for its visual output quality.
Limitations
- Attribute Management Cap: Gephi’s data table caps visible columns at 20, attribute values display in abbreviated scientific notation without full text inspection, and node or edge attributes cannot be examined directly from the graph view, limiting workflows that require complex, heterogeneous data inspection.
“Gephi is very frustrating to use (can only view up to 20 attribute columns at once, can’t inspect node/edge attributes from the graph view, attribute values only allow you to copy the abbreviated scientific notation form etc.)”, r/datascience, 2023
Takeaway: Gephi’s attribute inspection UI is a workflow-breaking limitation for users managing complex, heterogeneous graph data, confirmed by a practitioner who switched tools specifically because of it.
- Performance Degradation at High Scale: Gephi’s real-time interactive performance degrades on standard hardware above approximately 100,000 nodes (published benchmarks show 3–5 FPS at 100,000 nodes, and community reports document unresponsive behavior at 384,000+ nodes (GitHub issue gephi/gephi #1947)) making hardware configuration a significant variable at the upper end of Gephi’s documented range.
- Desktop-Only Architecture: Gephi is desktop-only with no cloud deployment, no real-time collaboration, no multi-user sessions, no live database connection, and no REST API, users requiring collaborative or programmatic workflows need to evaluate alternative tools.
- No Enterprise Support SLA: Gephi’s volunteer development model provides no guaranteed enterprise support SLA, organizations requiring formal support commitments for mission-critical production workflows cannot rely on Gephi for those assurances.
Verdict
Gephi is the highest-scoring open-source desktop tool for large-scale network visualization in peer-reviewed benchmarking, rated 5 out of 5 for scalability in a NIH-published comparative study PMC5540468, 2017 and documented for networks from 10 to approximately 10 million nodes via OpenGL rendering. Gephi is the definitive choice for academic researchers and data scientists doing exploratory analysis of large networks without coding, particularly for community detection, centrality analysis, and publication-quality figure generation. Teams needing Python-pipeline integration should evaluate Cytoscape’s py4cytoscape API; teams needing live database-connected exploration should evaluate Neo4j Bloom instead.
2. D3.js: Best for Custom Web-Based Graph Applications
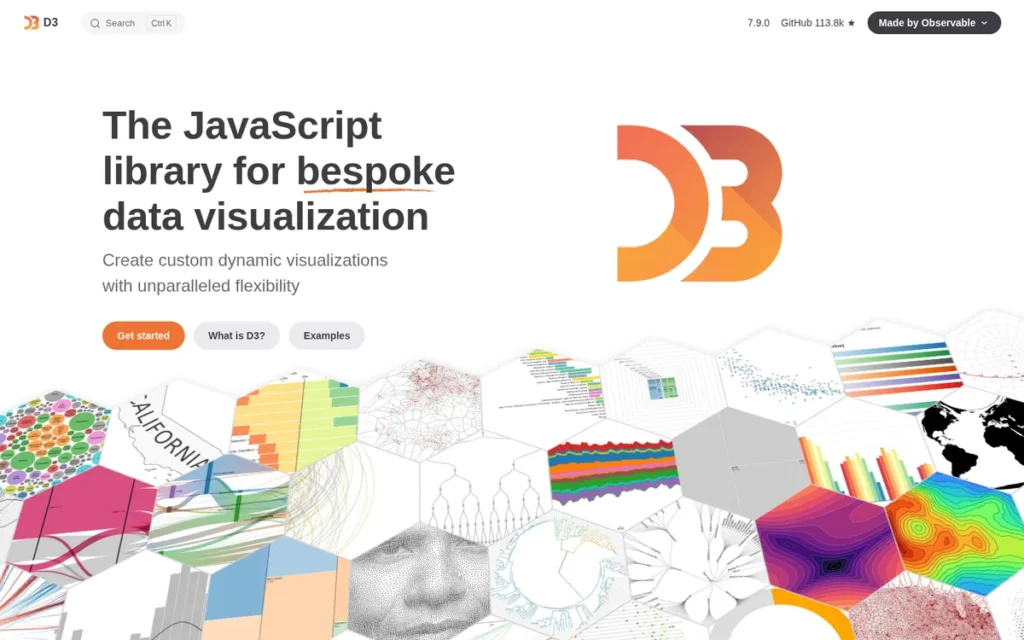
Category: Visualization Library, a JavaScript library that binds data to DOM elements to produce fully custom, interactive network visualizations in web applications, supporting SVG, Canvas, and WebGL rendering targets.
At a Glance
- Category: Visualization Library
- Best For: Software developers and data engineers building fully custom, production-grade web applications with bespoke network graph requirements and advanced JavaScript expertise
- Price Range: Free (open-source, ISC license: equivalent in permissiveness to MIT, no commercial tiers)
- Primary Strength: D3.js provides complete rendering control across SVG, Canvas, and WebGL with approximately 112,000 GitHub stars as of May 2026, the highest community adoption signal of any network visualization library in this evaluation (github.com/d3/d3, verified May 2026)
- Biggest Limitation: D3.js is a low-level visualization primitive, not a complete graph application framework, interactive UI features available out-of-the-box in other tools must be hand-coded from primitives, requiring advanced JavaScript expertise
- One-Line Summary: D3.js is the most widely adopted JavaScript network visualization library with approximately 112,000 GitHub stars as of May 2026, offering maximum rendering flexibility across SVG, Canvas, and WebGL for developers building fully custom, production-grade graph web applications.
- Last Verified: May 2026
Overview
D3.js ranks #2 on the strength of the highest community adoption metric in this evaluation (~112,000 GitHub stars as of May 2026) and the deepest feature ceiling, full rendering control across SVG, Canvas, and WebGL with complete customization of four independently configurable force simulation parameters.
D3.js (Data-Driven Documents) is a free, open-source JavaScript library enabling developers to create fully custom, interactive network visualizations by binding data to DOM elements and applying data-driven transformations, designed for software developers building production web applications where graph visualization must be custom-engineered rather than configured from pre-set defaults. D3.js was created by Mike Bostock during his PhD at Stanford University and refined at The New York Times, and has accumulated approximately 112,000 GitHub stars as of May 2026 (github.com/d3/d3).
D3.js is simultaneously the highest-ceiling and highest-investment tool in this evaluation: it offers complete control over every rendering detail but requires expert JavaScript knowledge, making it right for developers with sufficient timeline and wrong for quick prototypes or non-technical users.
Key Features
- Four-Force Physics Simulation: D3.js’s force simulation engine provides four independently configurable force types for network layouts:
- Link Force: clusters connected nodes together based on edge relationships
- Charge Force: repels overlapping or unconnected nodes to prevent visual crowding
- Collision Force: prevents node overlap in dense graph regions
- Center Force: provides a gravitational anchor keeping the overall layout centered
- Multi-Target Rendering Architecture: D3.js supports three rendering targets: SVG (high fidelity for smaller networks), Canvas (faster rendering at medium scale), and WebGL (highest performance for 10,000+ node graphs), giving developers an explicit performance upgrade path as dataset size grows without switching libraries or rewriting core logic.
- React Integration: D3.js integrates natively with React, where React manages component state and D3.js handles mathematical computation and DOM transformation, a combination that has become the dominant architecture for production-grade custom graph visualization UIs as of 2025–2026.
- Data-Source Agnostic: D3.js accepts any JSON-structured data source and connects to SQL databases, REST APIs, and streaming data feeds without requiring specific file format conversions, the most flexible data input option in this evaluation.
- ISC License: D3.js operates under the ISC license: equivalent in permissiveness to MIT, allowing unrestricted commercial use, modification, and embedding in proprietary applications without attribution requirements or licensing risk. (d3js.org)
Best For
D3.js is best for software developers and data engineers building production web applications where graph visualization must be fully custom-engineered (unique node shapes, complex interaction patterns, animated transitions, non-standard layouts) and where the team has advanced JavaScript expertise and sufficient development timeline. Non-technical users and teams prioritizing rapid prototyping should evaluate Vis.js as an accessible entry point, with a planned migration path to D3.js as requirements become more complex.
Pricing
D3.js is completely free under the ISC license with no commercial tiers, paid support packages, or enterprise licensing fees. The entire feature set, including all layout algorithms, rendering modes, and interactivity APIs, is available at zero cost. (Verified May 2026, d3js.org)
Strengths
- D3.js has accumulated approximately 112,000 GitHub stars as of May 2026 (github.com/d3/d3, verified May 2026) (the highest adoption signal of any graph visualization library in this evaluation) signaling a developer community depth that extends far beyond the specialized graph research audience.
“If you are willing to put the work D3.js package for JavaScript can do magic… Sky is the limit.”, u/geteum, r/datascience, 2023
Takeaway: Developer community consensus frames D3.js’s learning curve as a worthwhile long-term investment, the ceiling justifies the climb for teams with the expertise and timeline to build from primitives.
- Community confirmation of long-term value extends across multiple discussions: “D3. It is worth the time investment to learn.” (u/TwoKeezPlusMz, r/datascience, 2023), confirming that practitioners broadly view the learning curve as a worthwhile investment rather than a dealbreaker.
- D3.js was created by Mike Bostock during his PhD at Stanford University and refined during his tenure at The New York Times, an institutional pedigree that explains D3.js’s foundational influence across data journalism, scientific research, and enterprise application development over 15+ years. (d3js.org)
- D3.js’s multi-target rendering architecture (SVG → Canvas → WebGL) provides a staged performance optimization path: teams can begin with SVG for rendering fidelity and migrate incrementally to Canvas or WebGL as node counts grow without changing libraries or rewriting data transformation logic.
Limitations
- Missing Production UI Features: D3.js is a low-level visualization primitive, not a complete graph application framework, features that other tools provide out-of-the-box but must be hand-coded in D3.js include:
- Tooltip systems for node and edge hover interactions
- Node selection and multi-select UI controls
- Layout algorithm switching controls
- Zoom and pan navigation with minimap overlay
- Context menus and right-click event handlers
- Node grouping and clustering controls
“We tried D3 but it was missing features needed to build a full interactive UI.”, u/gkorland, r/reactjs, 2024
Takeaway: D3.js requires significant hand-coded feature work for production-grade graph application UIs, budget this engineering time before committing to D3.js as your framework.
- Expert Rendering Selection Required: D3.js’s large-scale performance requires expert rendering target selection, developers who default to SVG for 100,000-node networks will produce sluggish D3.js visualizations regardless of the library’s theoretical WebGL ceiling.
- Excludes Non-Technical Users: D3.js effectively excludes non-technical users entirely and is not appropriate for self-serve analyst graph exploration without developer mediation, teams without advanced JavaScript expertise should start with Vis.js.
Verdict
D3.js is the most widely adopted JavaScript network visualization library in the world, with approximately 112,000 GitHub stars as of May 2026, and represents the definitive choice for development teams building fully custom, production-grade graph web applications. The steep learning curve is real, D3.js requires advanced JavaScript expertise and significant development time to build features that higher-level tools provide out-of-the-box, making it suitable for teams with the skill and timeline to build from primitives. Teams without advanced JavaScript expertise should start with Vis.js and plan a D3.js migration as complexity grows; the ISC license enables commercial embedding at any stage without licensing risk.
3. Cytoscape: Best for Academic Research, Bioinformatics, and Attribute-Rich Network Analysis
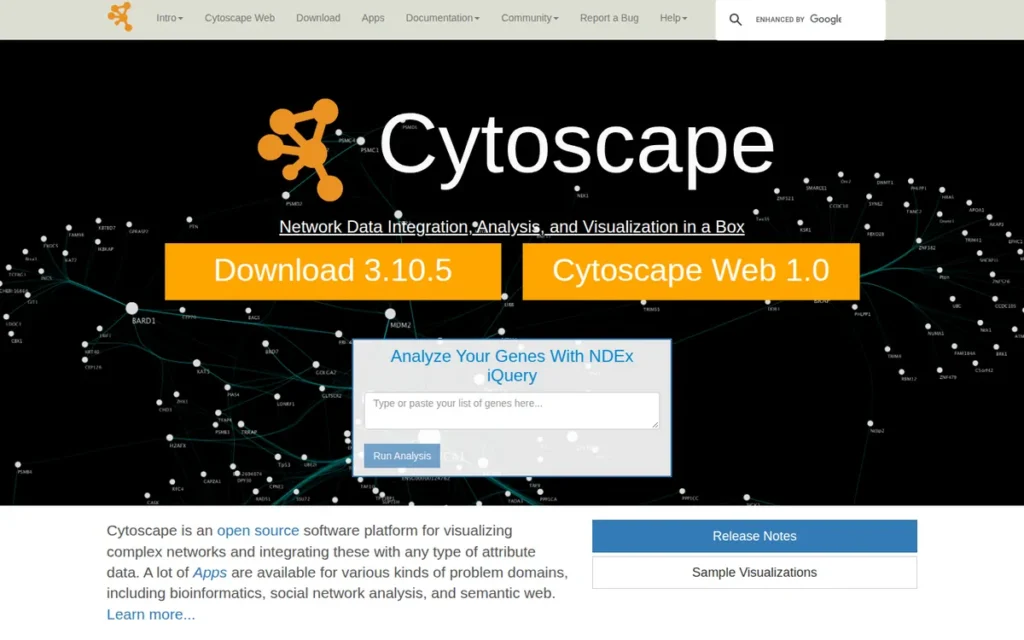
Category: Analysis Platform, a free, open-source desktop application and JavaScript library for complex network visualization and attribute-rich analytical workflows, with dominant adoption in bioinformatics and systems biology research since 2002.
At a Glance
- Category: Analysis Platform
- Best For: Academic researchers in life sciences, systems biology, and bioinformatics; data scientists needing deep attribute inspection, biological database integration, and Python-accessible network analysis on networks below approximately 10,000 elements
- Price Range: Free (open-source, NIH-backed; optional commercial yFiles layout plugin available at separate pricing, contact yworks.com for SDK pricing)
- Primary Strength: Cytoscape accumulates 1,000+ academic citations per year and approximately 17,600 downloads per month, with a peer-reviewed visual styles score of 5 out of 5 in NIH-published comparative benchmarking PMC5540468, 2017, the highest in its comparison class
- Biggest Limitation: Cytoscape’s desktop application experiences documented performance degradation beyond approximately 10,000 elements (nodes plus edges combined), earning a peer-reviewed scalability score of 3 out of 5 in PMC5540468, significantly below Gephi’s 5 out of 5 for the same metric
- One-Line Summary: Cytoscape is one of the most widely cited free network analysis platforms in published research, accumulating 1,000+ academic citations per year since 2002 with NIH institutional backing, a 300-app bioinformatics plugin ecosystem, and a peer-reviewed visual styles score of 5 out of 5 in published NIH benchmarking PMC5540468, 2017.
- Last Verified: May 2026
Overview
Cytoscape ranks #3 on strong scores across feature depth (peer-reviewed 5/5 visual styles, 300+ biological plugins, compound graph support described as “unique of its kind”), community adoption (1,000+ annual academic citations, 17,600 monthly downloads, NIH federal backing), and Python integration (py4cytoscape, CyREST), placing below Gephi specifically and decisively on scalability (peer-reviewed 3/5 vs. Gephi’s 5/5).
Cytoscape is a free, open-source desktop platform for complex network visualization and analysis, created in 2002 at the Institute for Systems Biology with continuous NIH funding, making Cytoscape the standard tool in bioinformatics, systems biology, and computational genomics research, with 1,000+ academic citations per year and approximately 17,600 monthly downloads as of 2024 (PMC6717989, 2024). Cytoscape’s 300-app App Store, described as “unique of its kind” in peer-reviewed benchmarking PMC5540468, 2017, transforms Cytoscape from a visualization tool into a complete bioinformatics analysis platform.
Cytoscape is available both as a desktop application and as Cytoscape.js, a web-based JavaScript library. The two differ meaningfully in performance ceiling and integration requirements and should be evaluated separately for desktop versus web deployment decisions.
Key Features
- Compound Graph Support: Cytoscape supports compound (nested, multi-level) graphs in addition to standard directed and undirected graphs, enabling visualization of hierarchical structures such as protein complexes nested within functional biological pathways, a graph type not supported in Gephi or Vis.js.
- 300-App Bioinformatics Ecosystem: Cytoscape’s App Store provides direct integration with biological databases including STRING, Reactome, and BioPAX, plus functional enrichment analysis, Gene Ontology annotation, and gene name mapping, transforming Cytoscape from a visualization tool into a complete bioinformatics analysis platform.
- Python and REST API: Cytoscape provides a Python API via the py4cytoscape package and an HTTP REST API (CyREST), enabling data scientists to load and manipulate graph data programmatically from Python or R workflows, a capability not natively available in Gephi.
- Peer-Reviewed Visual Style System: Cytoscape’s visual style customization received a peer-reviewed score of 5 out of 5 in a published NIH comparative study PMC5540468, 2017 (the highest in its comparison class) for granular control over node shape, color, size, border, label, and edge appearance properties.
- Layout Algorithm Breadth: Cytoscape offers multiple layout algorithms including the Compound Spring Embedder (CoSE) for nested graph structures, Hierarchical, Force-Directed (Fruchterman-Reingold), Circular, Concentric, Grid, and Euler layouts, with optional premium yFiles layouts available via separate commercial plugin from yWorks.
Best For
Cytoscape is best for academic researchers in bioinformatics, systems biology, and computational genomics who need deep analytical metrics, biological database integrations, and publication-quality network figures for networks below approximately 10,000 elements, as well as data scientists working in Python who need programmatic graph loading and analysis via py4cytoscape or CyREST. Researchers working with full protein interactomes (typically 20,000–100,000+ interactions) should evaluate Gephi for scalability; web developers should evaluate Cytoscape.js separately from the desktop application.
Pricing
Cytoscape desktop and Cytoscape.js are both completely free and open-source. Optional premium yFiles layout algorithms from yWorks require a separate commercial license, pricing is not publicly disclosed and requires direct contact with yWorks at yworks.com. The free core includes all standard layout algorithms and the full 300-app plugin ecosystem at zero cost. (Verified May 2026, cytoscape.org)
Strengths
- A peer-reviewed comparative study published in PubMed Central PMC5540468, 2017 awarded Cytoscape a visual styles score of 5 out of 5 (the highest in the comparison) and described Cytoscape’s App Store as “unique of its kind” for the breadth of biological analysis plugins, providing the strongest independent validation of Cytoscape’s standing as the premier tool for attribute-rich biological network visualization.
- Cytoscape has been continuously funded by NIH grants through the National Resource for Network Biology (NRNB) since Cytoscape’s creation in 2002 at the Institute for Systems Biology, the only tool in this evaluation with guaranteed federal institutional backing not dependent on community volunteer continuity or corporate sponsor commitment. (namin.seas.harvard.edu/pubs/cytoscape.pdf)
- Cytoscape accumulates approximately 17,600 downloads per month and over 1,000 direct academic citations per year as of 2024 (PMC6717989, 2024), confirming Cytoscape’s status as one of the most widely adopted specialized network analysis platforms in the global academic research community.
- Cytoscape’s HTTP REST API (CyREST) and py4cytoscape Python package allow data scientists to drive Cytoscape sessions programmatically from Python or R (loading data, applying layouts, and extracting visual outputs) a programmatic integration capability that Gephi does not offer natively.
Limitations
- 10,000-Element Scalability Ceiling: Cytoscape’s desktop application experiences documented performance degradation beyond approximately 10,000 elements (nodes plus edges combined), earning a peer-reviewed scalability score of 3 out of 5 in PMC5540468 (2017) (significantly below Gephi’s 5 out of 5 for the same metric) making Cytoscape unsuitable for full protein interactomes (typically 20,000–100,000+ interactions) without subsetting the data.
“We are currently transitioning out from Cytoscape since it can’t hold huge graphs.”, u/gkorland, r/reactjs, 2024
Takeaway: Cytoscape.js’s scalability ceiling is confirmed in a production application context (not just in benchmarks) validating that the 10,000-element threshold is a real-world constraint, not a theoretical one.
- Full Interactome Disqualification: Cytoscape’s performance ceiling disqualifies it for full-scale interactome visualization, researchers working above 10,000 elements should evaluate Gephi for desktop exploration, as Cytoscape’s unmatched analytical depth comes with this structural scalability trade-off.
- Web Library Ceiling Applies Separately: Cytoscape.js (the web library) carries its own performance ceiling that developers should evaluate independently from the desktop application before committing to web deployment.
Verdict
Cytoscape is one of the most widely cited free network analysis platforms in published research, accumulating 1,000+ academic citations annually with NIH institutional backing since 2002, a 300-app bioinformatics plugin ecosystem rated “unique of its kind” in peer-reviewed benchmarking, and the highest visual styles score (5/5) in published NIH comparative analysis PMC5540468, 2017. Cytoscape’s 10,000-element scalability ceiling is a hard practical limit, researchers working at interactome scale (20,000–100,000+ interactions) need Gephi instead. For bioinformatics researchers, Python-integrated data scientists, and teams requiring deep attribute inspection on networks within the threshold, Cytoscape has no equivalent free alternative in this evaluation.
4. Neo4j Bloom: Best for Enterprise Graph Database Exploration Within the Neo4j Ecosystem
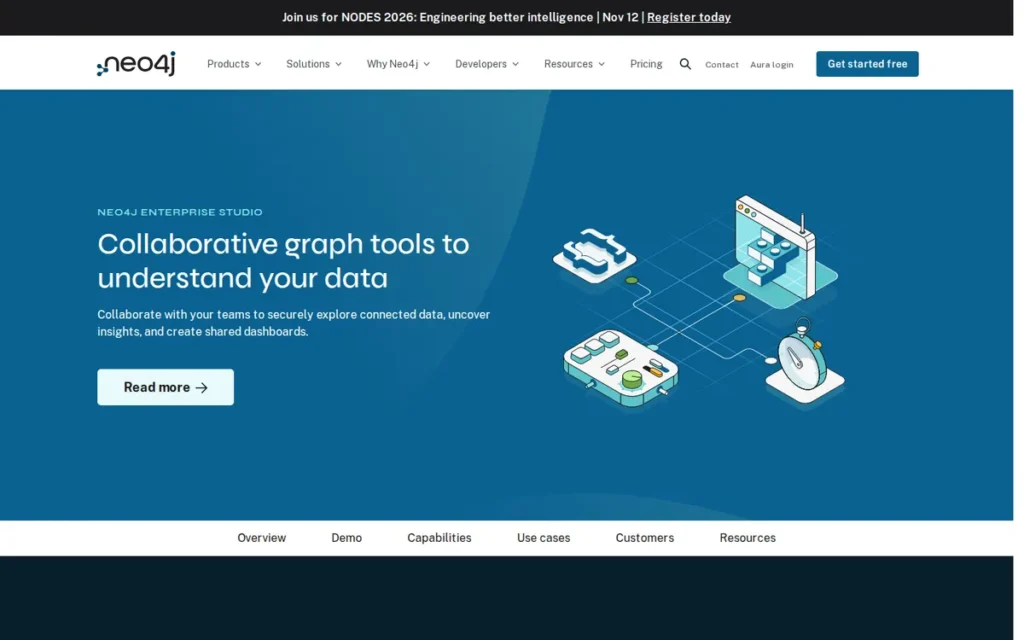
Category: Graph Database Explorer, a web-based visualization interface connecting natively to Neo4j graph databases, enabling interactive exploration through natural language search without requiring Cypher query knowledge.
At a Glance
- Category: Graph Database Explorer
- Best For: Enterprise organizations already operating a Neo4j graph database who need non-technical business analysts and domain experts to explore connected data without writing Cypher queries
- Price Range: AuraDB Professional ~$65/month (cloud); Enterprise self-hosted ~$36,000+/year minimum (custom pricing, verify at neo4j.com/pricing before procurement)
- Primary Strength: Neo4j Bloom enables non-technical users to explore complex graph data using near-natural language phrases that auto-generate Cypher queries and visualize results instantly, eliminating the graph query language barrier for business analysts entirely
- Biggest Limitation: Neo4j Bloom operates exclusively with Neo4j databases and cannot connect to any other graph database (Amazon Neptune, TigerGraph, JanusGraph) or relational data source, creating complete vendor lock-in to the Neo4j ecosystem
- One-Line Summary: Neo4j Bloom is the only database-native graph exploration interface in this evaluation, enabling natural language-driven visualization within the Neo4j ecosystem, backed by over $580 million in institutional venture funding including a $325 million Series F led by Eurazeo in June 2021.
- Last Verified: May 2026
Overview
Neo4j Bloom ranks #4 (below the three free open-source tools) because its vendor lock-in requirement (Neo4j database prerequisite) and enterprise pricing floor (~$36,000+/year self-hosted) generate the highest total cost of adoption in this evaluation, outweighing its unique natural language search advantage for all audiences except those already committed to Neo4j infrastructure.
Neo4j Bloom is a web-based graph visualization and exploration tool built natively on the Neo4j graph database platform, designed for enterprise organizations that need non-technical business analysts and domain experts to explore complex connected data through natural language search without writing Cypher queries. Neo4j Bloom cannot operate without an active Neo4j database connection. Neo4j was founded in 2007 in Sweden (headquartered in San Mateo, California, per neo4j.com/company, verified May 2026) and has raised over $580 million in venture funding including a $325 million Series F led by Eurazeo in June 2021 (Source: PRNewswire, June 17, 2021).
Neo4j Bloom is not a standalone visualization tool. Neo4j Bloom is a front-end visualization layer for an existing Neo4j database, organizations without Neo4j infrastructure cannot use Neo4j Bloom without first provisioning that database layer.
Key Features
- Natural Language Search: Neo4j Bloom’s natural language search interface accepts near-natural language phrases and automatically generates the corresponding Cypher query, executes it against the Neo4j database, and renders results as an interactive graph visualization, eliminating the Cypher knowledge requirement for non-technical users without requiring developer mediation.
- Perspective-Based Team Sharing: Neo4j Bloom’s perspective-based exploration system allows data engineers to create curated, role-based views of graph data shareable across team members, enabling non-technical stakeholders to explore safely bounded subsets of graph data without exposing sensitive schema details.
- Graph Data Science Integration: Neo4j Bloom integrates with the Neo4j Graph Data Science (GDS) library, enabling analysts to run graph algorithms (centrality, community detection, and pathfinding) directly from the Bloom visualization interface without switching to a separate analysis environment.
- Timeline Analysis: Neo4j Bloom includes timeline analysis capability for temporal graph data, enabling visualization of how relationships and entities evolve over time, a feature unavailable in most desktop and JavaScript graph visualization tools in this evaluation.
- Scene Actions: Neo4j Bloom supports scene actions: custom analytical workflows triggered from within the graph exploration interface, allowing data engineering teams to embed domain-specific procedures into the visualization experience for guided, repeatable business analysis.
Best For
Neo4j Bloom is best for enterprise organizations already operating or actively evaluating Neo4j as their graph database infrastructure who need to democratize graph exploration for non-technical stakeholders (business analysts, domain experts, and executives) without requiring Cypher query language training. Neo4j Bloom is not appropriate for organizations without Neo4j infrastructure, teams with budget constraints below the AuraDB Professional floor (~$65/month), ML researchers needing Python-native GNN workflow integration, or any team evaluating graph visualization independently of a graph database commitment.
Pricing
Neo4j Bloom is included with paid Neo4j AuraDB tiers: AuraDB Professional is approximately $65/month (cloud-hosted); AuraDB Enterprise requires a sales conversation for custom pricing. Self-hosted Neo4j Enterprise starts at approximately $36,000+/year minimum. A free AuraDB tier exists with significant graph size and Bloom access limitations. Bloom is not available as a standalone product, Neo4j database adoption is a prerequisite. Verify current pricing at neo4j.com/pricing before procurement; pricing is subject to change. (Research date: May 2026)
Strengths
- Neo4j has raised over $580 million in venture funding, including a $325 million Series F led by Eurazeo in June 2021 (Source: PRNewswire, June 17, 2021) (the strongest institutional financial backing of any company in this evaluation) providing development runway and enterprise-grade product durability that volunteer-maintained open-source tools structurally cannot match.
- Neo4j’s enterprise customer references include NASA, eBay, and Walmart (per customer references at neo4j.com/customers, as of May 2026; individual case study details not independently verified at the source level), confirming the underlying platform’s viability for large-scale connected data management in production enterprise environments.
- Neo4j Bloom’s natural language interface is uniquely differentiated among the seven tools in this evaluation: among all evaluated tools, no other tool allows a non-technical user to type a phrase describing a relationship pattern and receive a rendered graph visualization without prior query language training or developer mediation.
- The Neo4j platform holds a G2 rating of approximately 4.6 out of 5 from 200+ reviews (unverified secondary aggregator data, 2025), reflecting broad enterprise satisfaction with Neo4j’s graph modeling approach and Bloom’s intuitive exploration interface.
Limitations
Complete Vendor Lock-In: Neo4j Bloom operates exclusively with Neo4j databases and cannot connect to any of the following without ETL migration into Neo4j first:
- Amazon Neptune
- TigerGraph
- JanusGraph
- Any relational SQL database
- Any NoSQL data store (MongoDB, Cassandra, and others)
Adopting Neo4j Bloom means simultaneously committing to Neo4j as the organization’s graph database layer, a commitment carrying an enterprise self-hosted price floor of approximately $36,000+/year.
Enterprise Pricing Floor: Neo4j Bloom’s self-hosted enterprise minimum of approximately $36,000+/year (verify at neo4j.com/pricing) is a prerequisite infrastructure cost (not a visualization upgrade) making Neo4j Bloom the highest total-cost-of-adoption tool in this evaluation for organizations without existing Neo4j infrastructure.
“The concern is that there is a logical barrier between Neo4j’s Java backend, and PyTorch/native Python, which might inhibit the potential for customization, optimization, and experimentation with new or speculative GNN algorithms.”, r/MachineLearning, 2022
Takeaway: For ML researchers experimenting with graph neural networks, the Java-Python integration barrier is a material friction point affecting experimentation speed, a relevant consideration before adopting the Neo4j stack for GNN workflows.
- Infrastructure Prerequisite Before First Visualization: Unlike Gephi or Cytoscape (which can import a CSV and render immediately) Neo4j Bloom requires full graph database provisioning before the first visualization is produced, systematically understating total adoption cost when evaluated in isolation from that infrastructure commitment.
Verdict
Neo4j Bloom is the only database-native graph exploration interface in this evaluation that eliminates the Cypher query language barrier through natural language search, making it the definitive choice for enterprise organizations already operating Neo4j graph databases who need to extend exploration capabilities to non-technical business stakeholders. Neo4j Bloom’s vendor lock-in to Neo4j and enterprise pricing floor (~$36,000+/year self-hosted) are the primary limiting factors, procurement teams must account for total infrastructure cost before comparison with free tools. Teams without existing Neo4j infrastructure should evaluate open-source alternatives (Gephi, Cytoscape, D3.js) before committing to the Neo4j ecosystem.
5. Graphviz: Best for Automated, Code-Defined, and Reproducible Graph Diagrams
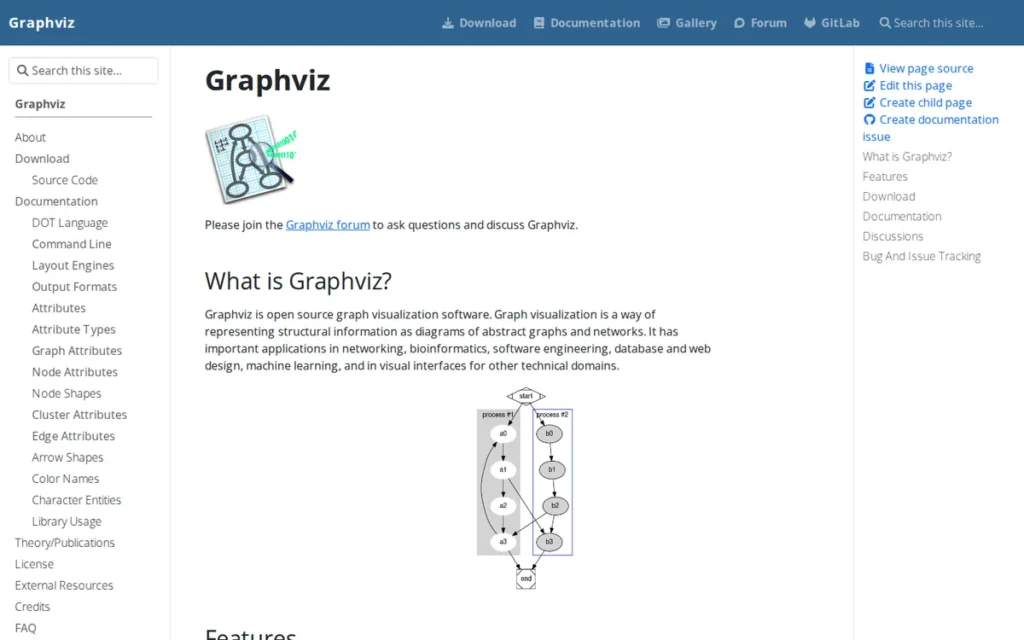
Category: Automated Diagrammer, a free, command-line graph layout system generating structured static diagrams from plain-text DOT language descriptions, optimized for automated, reproducible, code-defined graph rendering in CI/CD pipelines and documentation workflows.
At a Glance
- Category: Automated Diagrammer
- Best For: Software engineers, DevOps teams, and technical writers generating reproducible graph diagrams automatically from code in CI/CD pipelines, Sphinx documentation systems, or Jupyter-based batch reporting workflows
- Price Range: Free (open-source, Eclipse Public License 1.0: commercially permissive, allows unrestricted commercial use)
- Primary Strength: Graphviz’s Python package accumulates tens of millions of monthly downloads on PyPI (pypistats.org/packages/graphviz, verified May 2026), reflecting deep, entrenched adoption in automated documentation and developer toolchain workflows, the highest Python ecosystem adoption of any tool in this evaluation
- Biggest Limitation: Graphviz produces static, non-interactive diagram outputs only and scales poorly beyond approximately 1,000 nodes with its primary hierarchical (dot) layout engine, making it unsuitable for exploratory network analysis or large-scale interactive visualization
- One-Line Summary: Graphviz is the standard automated graph layout system, with tens of millions of monthly Python package downloads (pypistats.org, May 2026) and 30+ years of continuous development since its AT&T Bell Labs origin, generating reproducible static diagrams from DOT language definitions across 7+ layout configurations.
- Last Verified: May 2026
Overview
Graphviz ranks #5 (below Neo4j Bloom despite lower price and broader adoption) because Graphviz’s static-output-only constraint and ~1,000-node hierarchical ceiling exclude it from the core use cases of the primary audience (interactive network exploration and scalable analysis), while its automated documentation niche has lower overlap with the evaluation’s target user profiles.
Graphviz is a free, open-source automated graph layout system developed at AT&T Bell Labs in the early 1990s that generates structured diagram outputs from plain-text DOT language definitions, designed for software engineers and technical writers who need reproducible, version-controlled graph diagrams generated automatically from code rather than drawn manually. Graphviz’s Python package accumulates tens of millions of downloads per month on PyPI (pypistats.org/packages/graphviz, verified May 2026) and is embedded natively in Sphinx documentation generators, PlantUML, and Terraform.
Graphviz occupies a non-overlapping niche from interactive tools like Gephi and Cytoscape. Graphviz is the right tool for code-defined, batch-generated, version-controlled static diagrams, and structurally the wrong tool for exploratory large-scale network analysis.
Key Features
7+ Layout Engines: Graphviz provides 7+ layout engines serving distinct graph types:
- dot: hierarchical layered graphs using the Sugiyama method
- neato: undirected spring model for small to medium graphs
- fdp: force-directed for larger undirected graphs
- sfdp: scalable force-directed for very large graphs
- twopi: radial layout from a central root node
- circo: circular layout for cyclic structures
Changing one layout parameter produces dramatically different visual representations from identical input data. (graphviz.org/docs/layouts)
DOT Language Specification: Graphviz’s DOT language is a declarative, human-readable plain-text specification where users define nodes and relationships as text and the engine computes all visual positions automatically, making graph definitions natively compatible with version control (Git), code review workflows, and CI/CD automation pipelines.
Publication-Ready Export: Graphviz generates publication-ready outputs in SVG, PNG, PDF, and PostScript formats, with SVG output suitable for web embedding and PDF output suitable for academic publication without additional conversion steps.
Python API: Graphviz’s Python package provides a Python API for generating DOT-language graphs programmatically from data structures, enabling integration into Jupyter notebooks, data pipelines, and automated reporting workflows, accumulating tens of millions of monthly PyPI downloads (pypistats.org, May 2026).
Embedded Toolchain Presence: Graphviz is integrated natively into Sphinx documentation generators, PlantUML, and Terraform, making Graphviz’s layout capabilities accessible to millions of developers via existing tools without requiring direct installation or configuration.
Best For
Graphviz is best for software engineers, DevOps teams, and technical writers who need reproducible, automated graph diagrams from code (software dependency graphs, call graphs, state machine diagrams, data pipeline visualizations) in CI/CD pipelines, Sphinx documentation, or Jupyter batch reporting where code-defined, version-controlled, static diagrams are the requirement. Graphviz is not for interactive exploration, large-scale networks beyond approximately 1,000 nodes for hierarchical layouts, or self-serve analyst visualization.
Pricing
Graphviz is entirely free under the Eclipse Public License (EPL 1.0), a permissive license allowing commercial use, modification, and distribution. No commercial tiers, paid support packages, or enterprise licensing fees exist. (Verified May 2026, graphviz.org)
Strengths
- Graphviz’s Python package accumulates tens of millions of monthly downloads on PyPI (pypistats.org/packages/graphviz, verified May 2026) (the highest Python ecosystem adoption metric of any tool in this evaluation) reflecting deep, entrenched adoption into daily workflows across data science, software engineering, and technical documentation.
- Graphviz was developed at AT&T Bell Labs in the early 1990s and has maintained continuous active development for over 30 years (the longest durability track record of any tool in this evaluation) with the most recent stable release (version 14.1.5) published April 12, 2026, confirming ongoing active maintenance as of the research date. (gitlab.com/graphviz/graphviz/-/releases, verified May 2026)
This aligns with practitioner experience on r/SQLServer:
“I wanted to share a tool I like to use for creating simple dependency diagrams. I wouldn’t use it for something like schema design, but for quickly documenting and visualizing ‘this references that’, I find it helpful. It’s called Graphviz, which uses the DOT graph description language. It’s a simple but powerful language you can use to throw together diagrams of ranging complexity.” Posted by u/chadbaldwin
Takeaway: Graphviz earns practitioner loyalty precisely within its targeted documentation niche, its self-acknowledged scope limitation (“not for schema design”) reinforces credibility rather than undermining it, confirming the tool is well understood and correctly applied by the developers who rely on it.
- Graphviz is embedded as a core dependency in Sphinx (Python documentation generator), PlantUML (diagram-from-code platform), and Terraform (infrastructure-as-code documentation system), making Graphviz’s layout capabilities accessible to millions of developers who interact with Graphviz indirectly through these tools without requiring separate installation.
- Developer communities describe Graphviz as “the gold standard for declarative graphs in docs” and report daily usage in technical documentation workflows (danieleteti.it, 2024), evidence of entrenched position in the code-defined, version-controlled diagram niche.
Limitations
- Static Output Only: Graphviz is a static diagram generator, not an interactive network visualization tool, all Graphviz outputs are fixed image files (SVG, PNG, PDF) with no user interaction of any kind: no zoom-and-pan within the rendered graph, no filtering, no live data exploration, and no ability to rearrange nodes after rendering.
“Have you looked into Graphviz? I never used it in an interactive manner, but for static graphs I usually create them in Jupyter notebooks with the Python package.”, u/g0lem, r/datascience, 2023
Takeaway: Even community members recommending Graphviz qualify it as exclusively useful for static outputs, confirming that its category distinction (static documentation diagrams, not interactive network exploration) is widely understood by practitioners.
- Hierarchical Layout Ceiling (~1,000 Nodes): Graphviz’s primary hierarchical dot layout engine scales poorly beyond approximately 1,000 nodes due to the computational complexity of the Sugiyama layer-crossing minimization algorithm, limiting Graphviz to small-to-medium structured diagrams rather than exploratory network analysis. (graphviz.org/docs/layouts/dot)
- No Review Platform Data: Graphviz has no dedicated listing on G2 or Capterra, meaning no structured review platform rating data is available for prospective buyers evaluating Graphviz against SaaS-style alternatives, community forum discussions and GitHub issues are the primary feedback sources.
Verdict
Graphviz is the definitive automated graph layout system for code-defined, reproducible diagrams, accumulating tens of millions of monthly Python package downloads (pypistats.org, May 2026) and serving as an embedded dependency in Sphinx, PlantUML, and Terraform, evidence of entrenched adoption in developer documentation and CI/CD automation workflows that no other free tool in this evaluation approaches. Graphviz’s static-output-only constraint and ~1,000-node hierarchical layout ceiling make Graphviz complementary, not competing, with interactive tools like Gephi and D3.js. Teams needing both automated static diagrams and interactive exploration should evaluate Graphviz alongside Gephi or Cytoscape as paired tools for different stages of the same workflow.
6. Vis.js: Best for Rapid Web-Based Network Visualization Prototyping
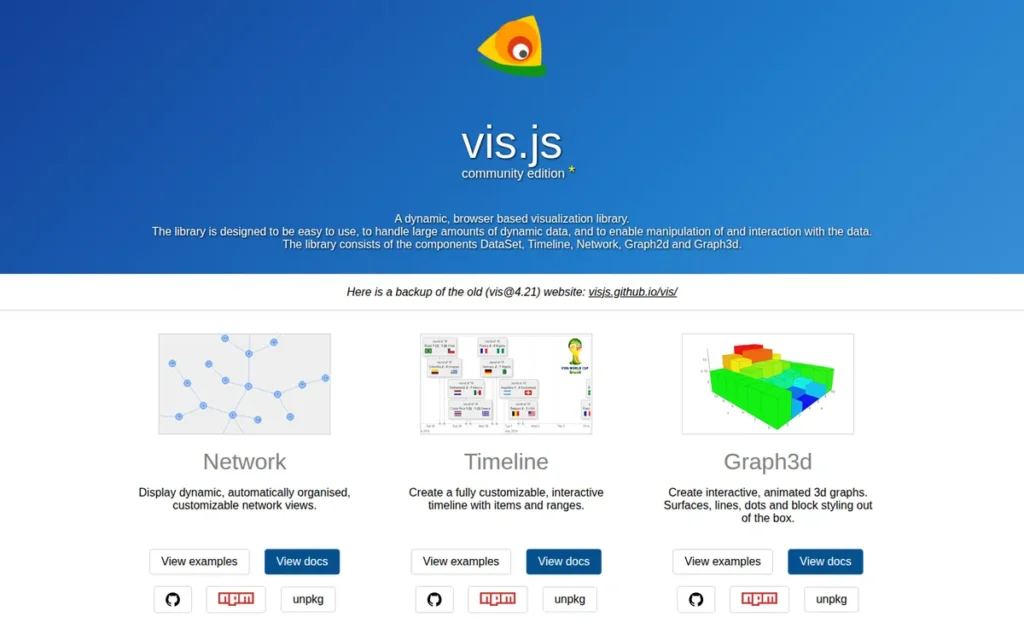
Category: Web Network Library, a free, open-source JavaScript library for browser-based dynamic node-edge graph visualization with built-in physics simulation, providing the fastest deployment path to interactive network visualizations in web applications.
At a Glance
- Category: Web Network Library
- Best For: JavaScript developers building web applications requiring quick-to-deploy interactive node-edge visualization for networks up to approximately 3,000–5,000 nodes, and data scientists accessing graph visualization via Python (Pyvis) or R (visNetwork) wrappers without JavaScript knowledge
- Price Range: Free (open-source, MIT license: most commercially permissive open-source license, no attribution required)
- Primary Strength: Vis.js provides the lowest time-to-prototype of any JavaScript network visualization library in this evaluation, with built-in physics simulation, a complete node/edge styling API, and Python (Pyvis) and R (visNetwork) wrappers extending graph visualization to data science workflows without JavaScript knowledge
- Biggest Limitation: Vis.js performance degrades meaningfully beyond approximately 3,000–5,000 nodes on Canvas rendering with no WebGL support path, and Vis.js is systematically excluded from developer discussions evaluating graph frameworks for serious large-scale (10,000+ node) applications
- One-Line Summary: Vis.js is a free, MIT-licensed JavaScript network visualization library providing the fastest path to interactive physics-simulated node-edge graphs in web applications, with Pyvis (Python/Jupyter) and visNetwork (R) wrappers extending its reach to data science workflows without JavaScript.
- Last Verified: May 2026
Overview
Vis.js ranks #6 on strong pricing value (MIT license), meaningful integration ecosystem (Pyvis, visNetwork, neovis.js), and lowest JavaScript learning barrier of any library in this evaluation, while placing below D3.js on both feature depth and community adoption, and below all other tools on documented scalability (~3,000–5,000 node Canvas-only ceiling).
Vis.js is a free, open-source JavaScript library (MIT license) for dynamic browser-based network visualization, originally created by Almende (a Dutch research company, per github.com/visjs/awesome-visjs, verified May 2026) and now maintained by the visjs community, designed for JavaScript developers who need interactive, physics-simulated node-edge graph visualization in web applications with significantly less configuration overhead than D3.js or Cytoscape.js.
A Python data scientist in a Jupyter notebook can produce an interactive Vis.js network graph using only Python, importing Pyvis, passing a NetworkX graph object, and calling .show(), without writing a single line of JavaScript. For data science teams, Vis.js is effectively a Python-native graph visualization tool, not a JavaScript one.
Vis.js is the fastest-to-deploy option in this evaluation with the clearest documented scalability ceiling: approximately 3,000–5,000 nodes on Canvas rendering, with no WebGL upgrade path available.
Key Features
- Built-In Physics Simulation: Vis.js’s vis-network module renders interactive node-edge graphs with built-in physics simulation on HTML Canvas, providing configurable forces for organic layout emergence without requiring manual node positioning, the fastest out-of-the-box setup path of any JavaScript network library in this evaluation.
- Complete Styling API: Vis.js provides a complete node and edge styling API including custom shapes, colors, sizes, images, labels, and arrowhead configurations, plus interaction event handlers for click, hover, drag, zoom, and pan, all configurable through JavaScript objects rather than custom SVG or Canvas drawing code.
- Built-In Clustering: Vis.js includes built-in clustering functionality that groups nodes into cluster representations to reduce rendered element count when datasets approach the Canvas performance ceiling, enabling visualization of networks somewhat above the comfortable 3,000–5,000 node range.
- Pyvis Python and Jupyter Integration: Pyvis, a Python package wrapping Vis.js (documented at arXiv:2006.04951), enables data scientists to generate interactive Vis.js network visualizations directly from Python data structures in Jupyter notebooks, eliminating the JavaScript requirement for Python-native graph visualization workflows.
- visNetwork R Integration: The visNetwork R package wraps Vis.js to provide interactive network visualization within R and RMarkdown environments, making Vis.js accessible to R-based statistical and social network analysis workflows without JavaScript expertise.
Best For
Vis.js is best for JavaScript developers building web applications requiring quick-to-deploy interactive node-edge visualizations (dashboards, internal tools, educational platforms, proof-of-concept demos) for networks under approximately 3,000–5,000 nodes where development speed is a higher priority than maximum performance. Vis.js is also best for Python data scientists accessing it via Pyvis in Jupyter notebooks and R analysts using visNetwork. Teams anticipating network growth above 5,000 nodes should plan a migration path to D3.js or a WebGL-based library as a budgeted engineering investment from the outset.
Pricing
Vis.js is completely free under the MIT license, allowing unrestricted commercial use, modification, distribution, and proprietary embedding without any attribution requirement. All features, vis-network, vis-data, vis-timeline, and vis-graph3d, are available at zero cost with no paid tiers or support packages. (Verified May 2026, visjs.org)
Strengths
- Vis.js has generated a documented multi-language wrapper ecosystem: Pyvis (Python/Jupyter, documented at arXiv:2006.04951), visNetwork (R package for statistical and social network workflows), and neovis.js (Neo4j data integration), extending Vis.js’s reach to Python data scientists and R statisticians who need interactive network visualization without any JavaScript knowledge.
In a discussion about Python packages for interactive network visualization on r/Python, u/meteoRock recommended Vis.js-based web visualization over desktop alternatives:
“I generally recommend developing web tools rather than GUI Python apps since they’re more convenient for users to interact with… Using npm, I was able to download the necessary JavaScript for the Django site. Below has some pretty good examples. A bit of a learning curve, but the results are a lot better in my opinion.” Posted by u/meteoRock
Takeaway: Python developers building interactive network visualization for web deployment consistently find Vis.js’s browser-based output a meaningful improvement over Python GUI tools, validating the deployment accessibility advantage the article attributes to Vis.js.
- Developer community feedback consistently describes Vis.js as “pretty nice, simple enough and well documented” (u/KapiteinNekbaard, r/reactjs, 2024), confirming Vis.js’s position as the lowest-friction entry point for JavaScript network visualization among practitioners who have deployed Vis.js in production.
- Vis.js operates under the MIT license: the most commercially permissive open-source license in this evaluation, enabling embedding in proprietary commercial SaaS applications, enterprise internal tools, and educational platforms without licensing risk, legal review overhead, or attribution complexity.
- Vis.js’s modular architecture separates vis-network, vis-data, vis-timeline, and vis-graph3d into independently installable npm packages, reducing JavaScript bundle size for applications that need only the network visualization component and enabling selective module adoption without carrying the full library weight.
Limitations
- Canvas-Only Rendering Ceiling: Vis.js’s Canvas-only rendering: approximately 3,000–5,000 nodes with no WebGL support path, is a hard constraint well-established in the developer community, systematically excluding Vis.js from serious large-scale (10,000+ node) developer evaluations.
“None can properly lay things out… for quality layout you will have to go outside GitHub: yFiles, Ogma and possibly GoJS.”, u/Majestic-Animator-52, r/reactjs, 2024
Takeaway: A practitioner with 25 years of graph visualization consulting experience does not include Vis.js among enterprise-quality production options, confirming Vis.js’s positioning as a prototyping tool rather than a large-scale production solution.
- No WebGL Upgrade Path: Unlike D3.js, which supports explicit migration from SVG to Canvas to WebGL as datasets grow, Vis.js has no WebGL rendering mode, teams building applications that may grow beyond 5,000 nodes must budget a migration to a different library as a planned engineering investment, not an unexpected cost discovered mid-project.
- Community Maintenance Fragmentation: Vis.js’s transition from Almende corporate sponsorship to community maintenance has fragmented documentation across modular packages (vis-network, vis-data, vis-timeline, vis-graph3d), complicating version tracking for teams managing dependency upgrades over time.
Verdict
Vis.js is the fastest path to interactive web-based node-edge visualization in 2026, providing physics-simulated graph rendering with a complete styling API and Python and R wrapper packages (Pyvis, visNetwork) that eliminate the JavaScript requirement for data science graph visualization workflows. Vis.js’s Canvas-only rendering ceiling (~3,000–5,000 nodes) and its systematic exclusion from serious large-scale developer evaluations are the primary factors limiting Vis.js’s ranking, teams building applications that may grow beyond this threshold should plan D3.js or WebGL-based library migration as a budgeted deliverable. The MIT license makes Vis.js risk-free for commercial rapid prototyping at any scale below its ceiling.
7. yEd Graph Editor: Best No-Code Graph Editor for Business Analysts and Non-Technical Users
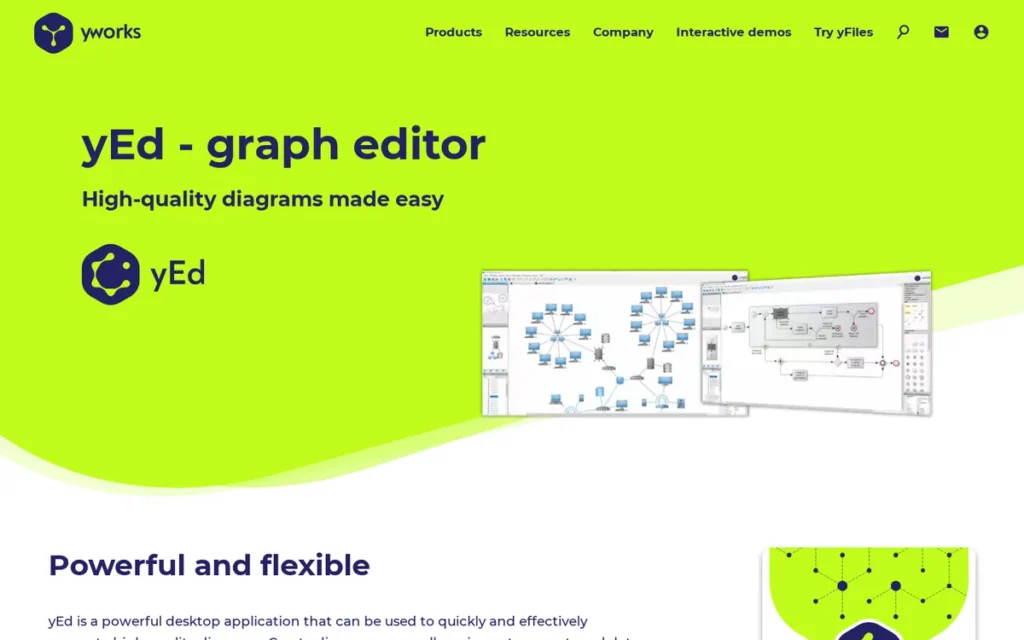
Category: Diagramming Editor, a free desktop application for manually creating and automatically arranging a wide variety of professional graph and diagram types from Excel or XML data, without any programming, coding, or database knowledge required.
At a Glance
- Category: Diagramming Editor
- Best For: Business analysts, project managers, and non-technical professionals who need professional-quality network diagrams, flowcharts, or organizational charts from Excel data without any programming, graph database, or JavaScript knowledge
- Price Range: Free (desktop application, all features included; yFiles commercial SDK for enterprise software developers priced separately, contact yworks.com for SDK licensing)
- Primary Strength: yEd Graph Editor enables non-technical users to import Excel spreadsheets and XML files and instantly generate automatically arranged professional network diagrams using 7+ commercial-grade layout algorithms derived from yWorks’s yFiles SDK, the only tool in this evaluation offering zero-code diagram creation from tabular data
- Biggest Limitation: yEd Graph Editor has no Python API, no R package, no HTTP REST API, and no command-line interface, making it completely unsuitable for programmatic, pipeline-driven, or data-science-integrated graph visualization workflows
- One-Line Summary: yEd Graph Editor is a free desktop application from yWorks that enables non-technical users to automatically arrange professional-quality network diagrams from Excel data using 7+ commercial-grade layout algorithms, the only tool in this evaluation requiring zero coding for full diagram creation and multi-format export.
- Last Verified: May 2026
Overview
yEd Graph Editor ranks #7 due to the complete absence of programmatic API integration and undocumented scalability benchmarks, which directly limit its utility for the primary audience of data analysts and developers, but yEd Graph Editor has no equivalent free alternative for the non-technical business analyst segment needing diagrams from Excel data.
yEd Graph Editor is a free desktop application by yWorks (Tübingen, Germany; yWorks has specialized in graph visualization SDK development since its founding in 2000, per yworks.com, verified May 2026) for creating, editing, and automatically arranging a wide variety of professional graph and diagram types, designed for business analysts, project managers, and non-technical professionals who need network diagrams, flowcharts, and organizational charts from Excel or XML data without programming knowledge. yEd Graph Editor’s one-click automatic layout capability, powered by algorithms from yWorks’s commercial yFiles SDK, arranges complex graph data instantly.
The yEd desktop application is the free end-user tool; the yFiles SDK is a separate commercial product licensed to enterprise software developers building graph visualization into their own applications. These two products share algorithm quality but serve entirely different buyer profiles.
Key Features
One-Click Automatic Layout: yEd Graph Editor’s automatic layout engine arranges complex graph data with a single click using 7+ professional algorithms:
- Hierarchical
- Organic (force-directed)
- Orthogonal
- Circular
- Tree
- Radial
- Family Tree
All are derived from yWorks’s commercial yFiles SDK and available at no cost in the yEd Graph Editor desktop application. (yworks.com/products/yed)
Excel and XML Import: yEd Graph Editor supports direct data import from Excel (.xls) spreadsheets and XML files, enabling business analysts and project managers to convert tabular relationship data into automatically arranged visual network diagrams without file format conversion or programming knowledge.
10+ Diagram Type Coverage: yEd Graph Editor covers 10+ diagram types in a single application (including BPMN process diagrams, UML class diagrams, semantic networks, flowcharts, organizational charts, mind maps, and family trees) serving as a free single-tool replacement for multiple specialized diagramming applications.
7+ Export Formats: yEd Graph Editor exports professional-quality outputs to 7+ formats including PNG, SVG, PDF, SWF, JPG, GIF, and HTML at no cost, producing publication-ready and web-embeddable diagram outputs from any layout type without additional conversion steps.
Commercial-Grade Layout Foundation: yEd Graph Editor is built on the commercial yFiles graph visualization SDK, providing desktop users access to layout algorithm quality that graph visualization expert communities identify as among the best available for production-grade applications, endorsed alongside Ogma and GoJS as one of three enterprise-quality layout solutions by a practitioner with 25 years of graph consulting experience. (u/Majestic-Animator-52, r/reactjs, 2024)
Best For
yEd Graph Editor is best for business analysts, project managers, and non-technical professionals who need professional-quality network diagrams, flowcharts, and organizational charts from Excel or XML data for presentations, documentation, or stakeholder communication, without coding, without a database, and without JavaScript. yEd Graph Editor is not appropriate for programmatic workflows, data-pipeline-driven visualization, or any use case requiring Python, R, REST API, or command-line integration.
Pricing
yEd Graph Editor desktop application is completely free for all personal and professional use, with no subscription fees, premium features, or usage limits of any kind. The commercial yFiles SDK (yFiles for HTML, Java, and .NET) used as yEd Graph Editor’s layout engine foundation is separately licensed for enterprise software developers embedding graph visualization in their own applications, pricing is not publicly disclosed and requires direct contact with yWorks at yworks.com. (Verified May 2026, yworks.com/products/yed)
Strengths
- A practitioner with 25 years of graph visualization consulting experience explicitly named yFiles, the commercial SDK powering yEd Graph Editor’s layout algorithms, as one of only three enterprise-quality solutions for production graph layout, stating “If you want quality layout you will have to go outside GitHub: yFiles, Ogma and possibly GoJS” (u/Majestic-Animator-52, r/reactjs, 2024), validating that yEd Graph Editor’s free layout technology is drawn from genuinely enterprise-grade algorithmic foundations.
- yEd Graph Editor covers more diagram types than any other tool in this evaluation (spanning BPMN, UML, flowcharts, organizational charts, mind maps, family trees, semantic networks, and social networks) based on feature documentation comparison at yworks.com/products/yed, gephi.org, cytoscape.org, graphviz.org, and visjs.org, as of May 2026.
- yEd Graph Editor’s one-click automatic layout from Excel import is the most accessible no-code graph creation workflow in any free tool in this evaluation, enabling business users who cannot write DOT language (Graphviz), JavaScript (D3.js, Vis.js), or graph query languages (Neo4j Bloom) to produce automatically arranged professional diagrams directly from spreadsheet data.
- yEd Graph Editor’s community recognition among practitioners is strong enough that developers recommend yEd Graph Editor with a bare URL and no elaboration (u/PhysPhD, r/datascience, 2023), indicating established tool status within technical communities who treat yEd Graph Editor as a known reference rather than a discovery.
Users on r/rstats shared firsthand experience with yEd in academic diagram workflows:
“yEd graph editor is another good alternative. There’s a small learning curve but I find it more convenient. I love it. I do a lot of structural equation modeling and I think it makes adding lines and line labels a lot easier. It’s not the best GUI but at least it’s free to everyone.” Posted by u/Naturalist90
Takeaway: Academic users in quantitative modeling workflows find yEd Graph Editor’s free-of-cost diagram quality worth the modest learning curve, an endorsement that reinforces its positioning as the definitive no-code option for professional diagram creation from tabular data.
Limitations
- No Programmatic API of Any Kind: yEd Graph Editor has no Python API, no R package, no HTTP REST API, and no command-line interface, making yEd Graph Editor architecturally incompatible with any workflow where graphs are generated automatically from data pipelines, scripts, databases, or programmatic data sources.
- Manual-Only Architecture: Unlike every other tool in this evaluation, yEd Graph Editor is exclusively a manual-interactive diagramming application, data scientists, developers, and researchers requiring graph visualization as a component of automated workflows will find yEd Graph Editor structurally unsuitable regardless of its diagram quality. The two workflows (manual diagram creation vs. programmatic data pipeline) are architecturally incompatible, not points on a spectrum.
- No Autosave: yEd Graph Editor lacks autosave: a limitation cited in G2 reviews (g2.com, 2025), creating meaningful risk of work loss during long diagramming sessions that all other tools in this evaluation avoid through auto-save or file-based save prompts.
- Undocumented Scalability Benchmarks: yEd Graph Editor’s performance benchmarks for large node counts are entirely undocumented, making objective scalability comparisons against the specific thresholds documented for Gephi (tens of thousands to millions), Cytoscape (~10,000 elements), and Vis.js (~3,000–5,000 nodes) impossible before purchase.
Verdict
yEd Graph Editor is the only tool in this evaluation that enables zero-code professional network diagram creation from Excel data with one-click automatic layout powered by yWorks’s commercial yFiles SDK, making yEd Graph Editor the definitive choice for business analysts and non-technical professionals who need professional diagrams without programming, infrastructure, or graph database knowledge. yEd Graph Editor ranks #7 due to the complete absence of programmatic API integration and undocumented scalability benchmarks, which directly limit its utility for the primary audience of data analysts and developers. Data scientists, developers, and researchers needing data-pipeline-driven or API-integrated graph visualization should evaluate Gephi, Cytoscape, D3.js, or Vis.js instead; for non-technical diagram creation from tabular data, yEd Graph Editor has no equivalent free alternative in this evaluation.
What Red Flags Should I Watch For When Evaluating Graph Visualization Software?
Four red flags indicate a graph visualization tool is wrong for your use case before evaluation begins: no documented scalability benchmarks, vendor lock-in without explicit disclosure, conflating BI dashboard tools with node-edge tools, and pricing that obscures infrastructure prerequisites. Identifying any one of these red flags early saves significant evaluation time.
Red Flag #1: No Documented Scalability Benchmarks
Any tool claiming broad scalability capability without providing specific sourced node-and-edge count thresholds is presenting unverifiable marketing rather than evaluation data. Every tool in this evaluation with documented thresholds reveals a specific ceiling: Gephi (tens of thousands to millions of nodes), Cytoscape (~10,000 elements), Vis.js (~3,000–5,000 nodes), and Graphviz (~1,000 nodes for hierarchical layouts).
A tool that cannot state its performance ceiling in numbers has either not been benchmarked at scale or is actively withholding the data. Ask every vendor the same question before evaluation: How many nodes and edges can your tool handle while maintaining interactive frame rates on standard hardware? If the answer is not a number with a source, treat scalability as unverified.
Red Flag #2: Vendor Lock-In Without Explicit Disclosure
Tools that require a specific database platform, cloud provider, or proprietary data format before the first visualization renders carry a hidden adoption cost that generic pricing pages rarely disclose. Neo4j Bloom cannot function without an active Neo4j database, making the ~$36,000+/year enterprise self-hosted floor for Neo4j a prerequisite cost, not an optional one.
Prospective buyers should always ask: What happens to my visualizations if I migrate away from this vendor’s infrastructure? before committing to any database-connected visualization tool.
Red Flag #3: Conflating BI Dashboard Tools with Node-Edge Network Tools
The word “graph” triggers both bar/line chart visualizations and node-edge network visualizations in search results, and many comparison lists mix these two fundamentally different categories without distinguishing them. Tableau, Power BI, and Looker Studio frequently appear in “best graph visualization tools” lists alongside Gephi and D3.js, but these tools serve different problems entirely.
Buyers who discover mid-project that their chosen “graph tool” doesn’t support node-edge layouts have encountered this category confusion red flag. Confirm explicitly that any tool under evaluation renders node-edge network structures before investing evaluation time.
Red Flag #4: Pricing That Hides Infrastructure Prerequisites
Some tools present attractive entry-level pricing while obscuring that meaningful enterprise deployment requires significant additional infrastructure spend. Neo4j Bloom appears to start at ~$65/month (AuraDB Professional) but enterprise self-hosted Neo4j licensing starts at approximately $36,000+/year. Always calculate total cost of adoption (including infrastructure, onboarding overhead, and migration risk) before comparing against free open-source alternatives requiring only a local installation.
What Questions Should I Ask Before Choosing a Graph Visualization Tool?
Four questions eliminate unsuitable graph visualization tools before any feature comparison begins: How many nodes and edges does your dataset contain? Will the visualization live in a web or desktop environment? Does your team need no-code, Python, or JavaScript access? Are you already committed to a graph database? Answering these four questions eliminates entire tool categories before any demo is scheduled.
Question #1: How Many Nodes and Edges Does My Current Dataset Contain, and What Is My Projected Growth Over 12 Months?
Think of scalability as a binary gate, not a spectrum: if your network will have 50,000 nodes, Cytoscape (~10,000 elements) and Vis.js (~5,000 nodes) are off the list before you open a feature comparison. A specific number answer eliminates multiple tools immediately. Networks projected above 10,000 nodes narrow the evaluation to Gephi and D3.js (with WebGL) before any feature review. Every minute spent evaluating a tool below your scalability requirement is a minute wasted.
Question #2: Will This Visualization Live in a Web Application, a Desktop Application, or a Local Analysis Session?
Web application deployment points to JavaScript libraries (D3.js, Vis.js, Cytoscape.js) or database-connected web tools (Neo4j Bloom). Desktop application or local analysis session points to desktop tools (Gephi, Cytoscape, yEd Graph Editor, Graphviz). CI/CD pipeline automation points exclusively to Graphviz. Deployment environment is a binary constraint that eliminates entire tool categories before any feature comparison begins, answering it first prevents wasted evaluation cycles.
Question #3: Does My Team Have Advanced JavaScript Expertise, or Do We Need a No-Code, Python-Accessible, or R-Accessible Option?
Advanced JavaScript expertise points to D3.js or Vis.js. Python workflows point to Cytoscape (py4cytoscape API), Graphviz (Python package, tens of millions of monthly PyPI downloads), or Vis.js (Pyvis wrapper). R workflows point to Vis.js (visNetwork package). Zero coding required points to yEd Graph Editor (Excel import). The honest answer prevents teams from selecting D3.js for a non-developer team and encountering the “missing features needed to build a full interactive UI” problem mid-project. (u/gkorland, r/reactjs, 2024)
Question #4: Am I Already Committed to a Graph Database Platform, and If So, Which One?
If the platform is Neo4j: Neo4j Bloom becomes a primary candidate, with vendor lock-in acknowledged as the explicit trade-off. If the platform is not Neo4j (Amazon Neptune, TigerGraph, JanusGraph): Neo4j Bloom is categorically unsuitable; evaluate open-source desktop or JavaScript library options instead. If no graph database exists: evaluating Neo4j Bloom in isolation from a Neo4j database commitment understates total cost of adoption by orders of magnitude, evaluate the free open-source tools first.
How Did We Rank These Graph Visualization Tools?
The seven graph visualization tools in this evaluation are ranked by a five-criterion weighted scoring framework: scalability thresholds, network graph feature depth, community adoption, pricing transparency, and integration ecosystem compatibility. Gephi ranks #1 by scoring highest on the two primary-weighted criteria (scalability (PMC5540468, 5/5) and feature depth) at zero cost with no infrastructure prerequisite. Every tool’s rank reflects its weighted aggregate score, not editorial preference or affiliate incentive.
How Did We Conduct the Evaluation?
The ranking methodology involved four sequential phases:
- Discovery: Multiple AI search engines and web research tools were queried to identify the most frequently recommended graph visualization tools for node-edge network data specifically, excluding BI dashboard tools that appear in broad “graph visualization” searches.
- Per-Entity Research: Each tool received dedicated independent research covering official documentation, peer-reviewed studies, PyPI and GitHub adoption metrics, pricing pages, and community forum discussions, with identical research depth regardless of anticipated ranking position.
- Community Sentiment Analysis: Reddit discussions on r/datascience, r/reactjs, and r/MachineLearning were analyzed for firsthand practitioner reports, including both endorsements and documented limitations with named users and approximate post dates.
- Cross-Reference Validation: Vendor-claimed statistics were cross-referenced against third-party sources (PubMed Central, pypistats.org, GitHub) before inclusion as fact. Claims without independent corroboration are labeled as vendor-reported or flagged as unverified throughout.
What Criteria Were Used to Rank Each Tool?
C1: Scalability and Documented Performance Thresholds (Primary weight): Scalability is the most cited go/no-go evaluation factor in practitioner communities. Specific documented thresholds allow binary screening before any evaluation investment begins. Unverifiable qualitative claims (“handles large graphs”) are not scored; only sourced numeric thresholds count.
C2: Network Graph Feature Depth (Primary weight): The target audience needs tools handling node-edge network structures specifically, not BI dashboards. Feature depth in layout algorithms, analytical metrics, graph type coverage, and interactivity determines whether a tool solves the core visualization problem.
C3: Community Adoption and Verified Reputation (Primary weight): Adoption signals indicate real-world stress-testing and available community support resources. Measurements include GitHub star counts (May 2026), academic citation rates (PubMed Central), monthly PyPI downloads (pypistats.org), and review platform ratings where available with verification status explicitly noted.
C4, Pricing Transparency and Total Cost of Adoption (Primary weight): Hidden costs, infrastructure prerequisites, vendor lock-in switching costs, enterprise pricing floors, are equally relevant as sticker price. A tool requiring $36,000+/year in database infrastructure before the first visualization renders has a fundamentally different cost profile than a free file-based tool.
C5: Integration Ecosystem and Tech Stack Compatibility (Secondary weight): Tools requiring complete workflow disruption have a higher effective cost than their sticker price suggests. Python and R integration pathways are decision-critical for the data science segment. For ML researchers experimenting with graph neural networks (GNNs) using PyTorch Geometric or DGL, Python-native integration is not merely convenient, it is a prerequisite for connecting graph visualization to training pipelines.
How Were Conflicting Evidence Sources Weighted?
When review platform ratings conflict with Reddit community sentiment, specificity and recency are weighted more heavily. A detailed 2024 Reddit post with named user and specific technical failure mode outweighs a generic 2022 G2 review for limitation documentation purposes. Peer-reviewed benchmarks (PubMed Central comparative studies) are treated as the highest-confidence evidence tier for capability claims.
How Were Vendor Claims Verified?
Vendor-reported statistics are labeled as such throughout this article. Only claims corroborated by at least one independent source (peer-reviewed publication, third-party package registry, named community discussion with verifiable post history) are stated as fact without qualification. G2 and Capterra rating figures for open-source tools not systematically listed on these platforms are flagged as “unverified secondary aggregator data” throughout.
When Is This Article Updated?
This article was last updated in May 2026. Data points flagged as time-sensitive (pricing, GitHub stars, PyPI download rates, platform ratings) should be independently verified at source before procurement decisions. The article is refreshed quarterly, or when major version releases, pricing structure changes, or significant community sentiment shifts are identified.
Independence Statement
PlugRoute has no affiliate relationships with any company listed. Rankings are determined entirely by research data and objective evaluation criteria.
Frequently Asked Questions About Graph Visualization Tools
What Is the Best Free Graph Visualization Tool for Large Networks in 2026?
Gephi is the best free graph visualization tool for large networks in 2026. Gephi earns a peer-reviewed scalability score of 5 out of 5 PMC5540468, 2017 and is documented for networks from 10 to approximately 10 million nodes, the only free desktop tool in this evaluation with a performance profile at this scale. For web-based large networks, D3.js with WebGL rendering is recommended for teams with advanced JavaScript expertise.
What Is the Difference Between Gephi and Cytoscape?
Gephi and Cytoscape serve different user profiles: Gephi for large-network exploration (peer-reviewed scalability 5/5, PMC5540468, 2017; documented for tens of thousands to millions of nodes) and Cytoscape for bioinformatics research with attribute-rich data (NIH-backed since 2002; 300+ biological plugins; Python API via py4cytoscape). Both are free. Choose Gephi above 10,000 elements; choose Cytoscape for biological database integration or Python API access below that threshold.
How Does PlugRoute Determine Its Tool Rankings?
PlugRoute ranks tools using a five-criterion weighted scoring framework applied identically to every evaluated tool, drawing on peer-reviewed studies, official documentation, third-party package download statistics (pypistats.org, GitHub), and named community discussions with source attribution. G2 and Capterra ratings are included where available but flagged as secondary aggregator data. Every tool receives equal research depth and equal structural treatment regardless of ranking position.
What Key Terms Should I Know Before Evaluating Graph Visualization Tools?
Six terms distinguish graph visualization tools from other data visualization software and clarify the node-edge network category covered in this comparison. Understanding these terms prevents the most common tool selection error: confusing BI dashboard tools (Tableau, Power BI) with node-edge network visualization tools (Gephi, D3.js, Cytoscape).
Node-Edge Graph: A node-edge graph (also called a network graph) is a data structure representing entities (nodes) and the relationships between them (edges), used to visualize systems where connections between items are as analytically important as the items themselves, examples include social networks, protein interaction networks, software dependency graphs, and knowledge graphs.
Force-Directed Layout: A force-directed layout algorithm positions nodes in a graph by simulating physical forces (typically attraction between connected nodes and repulsion between unconnected nodes) until the system reaches visual equilibrium, producing organic-looking layouts that reveal clusters and communities without manual node positioning. Gephi’s ForceAtlas 2 and Vis.js’s built-in physics simulation are examples of force-directed layout engines.
Scalability Ceiling: In graph visualization, a scalability ceiling is the documented maximum number of nodes and edges a tool can render with acceptable interactive performance, typically defined as maintaining real-time frame rates for layout computation, filtering, and node dragging. Scalability ceilings vary by orders of magnitude across tools in this evaluation: Gephi (tens of thousands to millions of nodes), Cytoscape (~10,000 elements), Vis.js (~3,000–5,000 nodes), and Graphviz (~1,000 nodes for hierarchical layouts).
Vendor Lock-In: Vendor lock-in describes a state where switching away from a specific tool or platform requires disproportionate effort (data migration, staff retraining, integration replacement) making the switch economically impractical despite better alternatives potentially existing. In this evaluation, Neo4j Bloom represents the highest vendor lock-in risk because Neo4j Bloom cannot connect to any non-Neo4j data source.
DOT Language: DOT is a plain-text graph description language used by Graphviz in which users define nodes, edges, and graph properties as structured text, and Graphviz’s layout engines compute all visual positions automatically. DOT files are human-readable, version-controllable with Git, and natively supported by Sphinx, PlantUML, and Terraform, making DOT the standard format for code-defined, reproducible graph diagrams in developer documentation and CI/CD workflows.
Glossary: Key Terms Used in This Comparison
Force-Directed Layout: A force-directed layout algorithm positions nodes in a graph by simulating physical forces (typically attraction between connected nodes and repulsion between unconnected nodes) until the system reaches visual equilibrium, producing organic-looking layouts that reveal clusters and communities without manual node positioning.
DOT Language: DOT is a plain-text graph description language used by Graphviz in which users define nodes, edges, and graph properties as structured text, and Graphviz’s layout engines compute all visual positions automatically. DOT files are human-readable, version-controllable with Git, and natively supported by Sphinx, PlantUML, and Terraform.
Scalability Ceiling: In graph visualization, a scalability ceiling is the documented maximum number of nodes and edges a tool can render with acceptable interactive performance, typically defined as maintaining real-time frame rates for layout computation, filtering, and node dragging. Scalability ceilings vary by orders of magnitude across tools: from approximately 1,000 nodes (Graphviz hierarchical layouts) to tens of millions (Gephi via OpenGL rendering).
Vendor Lock-In: Vendor lock-in describes a state where switching away from a specific tool or platform requires disproportionate effort (data migration, staff retraining, integration replacement) making the switch economically impractical despite better alternatives potentially existing. In this evaluation, Neo4j Bloom represents the highest vendor lock-in risk because it cannot connect to any non-Neo4j data source.
Compound Graph: A compound graph is a node-edge network structure that supports nested, multi-level hierarchies (such as nodes contained within parent nodes) enabling visualization of systems like protein complexes nested within biological pathways. Cytoscape supports compound graphs natively; Gephi and Vis.js do not.
Which Graph Visualization Tool Is Right for You?
Key Insights
- Choosing the wrong graph visualization tool means discovering its performance ceiling mid-project, every tool in this evaluation has a documented ceiling, from approximately 1,000 nodes (Graphviz hierarchical layouts) to tens of thousands to millions of nodes (Gephi’s documented capability range), and these differences span orders of magnitude.
- Scalability thresholds are the single fastest tool-elimination criterion before any feature comparison begins, a network projected to reach 50,000 nodes eliminates Cytoscape, Vis.js, and Graphviz before the first demo is scheduled.
- No single free tool optimally combines large-scale performance, Python/R programmatic integration, interactive web deployment, and no-code accessibility, each tool serves a distinct workflow, and selecting the right one requires honest assessment of deployment environment and team technical skills before evaluating features.
- The “graph visualization” category is split between interactive exploratory tools (Gephi, Cytoscape, yEd, Vis.js, D3.js) and automated static diagram generators (Graphviz), these two workflows are architecturally incompatible, and teams with both needs should select one tool from each category as paired solutions.
- Vendor lock-in risk is absent from six of seven tools in this evaluation, but is severe and irrevocable for Neo4j Bloom, organizations without existing Neo4j infrastructure should exhaust open-source alternatives before committing to the Neo4j ecosystem.
If your primary constraint is dataset size, begin evaluation with Gephi for desktop analysis and D3.js with WebGL for web deployment. If your constraint is programming environment, match the tool to your stack:
- Python data scientists should evaluate Cytoscape (py4cytoscape) or Vis.js (Pyvis)
- R analysts should evaluate Vis.js (visNetwork)
- JavaScript developers should evaluate D3.js or Vis.js based on timeline and scale requirements
- Non-technical business analysts working from Excel should use yEd Graph Editor: no equivalent free alternative exists in this evaluation
The two most commonly confused pairs deserve a direct answer. Gephi vs. Cytoscape: choose Gephi if your network exceeds 10,000 elements; choose Cytoscape if you need biological database integration or Python API access below that threshold. D3.js vs. Vis.js: choose Vis.js if deployment speed matters more than maximum customization, or your network stays below 5,000 nodes; choose D3.js if you need full rendering control, WebGL performance, or production-grade custom interactions.
Every tool in this evaluation can produce its intended output successfully when matched to the right use case. No tool is universally best, and no tool is universally wrong, the evaluation criteria in this article are designed to make the match, not to declare a winner for everyone.
Browse our related independent reviews on PlugRoute (including our graph database platform comparison, Python graph library evaluation, and open-source data analysis tool rankings) for deeper analysis of specific subcategories within the network data and connected data ecosystem. We update this guide quarterly. Last updated: May 2026.