Lucidchart and draw.io tie for the top score in PlugRoute’s 2026 diagramming ranking at 40/50. Lucidchart ranks #1 on the published tie-break for collaborative, data-linked team diagrams, and draw.io is the best free option. Microsoft Visio ranks #3 for Microsoft 365 organizations. The right tool depends on whether your job needs a structured diagrammer, a workshop whiteboard or diagrams-as-code.
Choosing one tool is harder than it should be because the products overlap. Free plans cap boards, files or shapes in different ways, and seat and billing rules vary by vendor. If you choose wrong, you pay for a subscription that doesn’t fit the diagrams you actually make.
PlugRoute has no affiliate relationships with any company listed, and rankings are determined entirely by research data and objective evaluation criteria.
“If we want something for a sales deck we make it in Lucid, not Mermaid.” (Reddit r/sideprojects, October 2026)
Takeaway: Practitioners use a polished visual tool for stakeholder diagrams and diagrams-as-code for change-controlled technical docs.
What Are the 3 Categories of Diagramming Software?
Diagramming software falls into three categories, and choosing the category before the product prevents most buying mistakes. Structured diagrammers build formal diagrams from shape libraries and notation standards. Whiteboards give teams freeform canvases for workshops. Diagrams-as-code tools render diagrams from text stored next to source code.
- Structured Diagrammers: Lucidchart, draw.io, Microsoft Visio and Wondershare EdrawMax build flowcharts, BPMN process maps, org charts, network diagrams and UML or ERD diagrams from standard shape libraries.
- Whiteboards: Miro and Figma FigJam give teams an infinite canvas for brainstorming, retrospectives and light flowcharts.
- Diagrams-as-Code: Mermaid renders diagrams from plain-text definitions that are version-controlled in Git alongside code and documentation.
A simple rule covers most teams: brainstorm on a whiteboard, formalize the result in a structured diagrammer, and version technical diagrams as code.
As one network engineer on r/NetworkDiagrams described:
“The issue wasn’t creating diagrams… it was maintaining them. Editing outdated diagrams that no one collaborates on is time-consuming, they don’t version cleanly, diffs are basically impossible, and once the network changes, the diagram is usually wrong again.” Posted by u/mmcashew
Takeaway: Keeping diagrams up to date, not drawing them in the first place, is the real long-term cost of diagramming software, so how a tool handles versioning should shape which category you pick.
How Do the Top Diagramming Tools Compare at a Glance?
Lucidchart and draw.io lead PlugRoute’s 2026 diagramming ranking with 40 of 50 points each, and Lucidchart ranks first on the tie-break. Microsoft Visio follows with 38 and Miro with 37. Mermaid scores 34, Figma FigJam 31 and Wondershare EdrawMax 28. All scores are based on evidence collected in November 2026.
| Rank | Company | Category | Best For | One-Line Summary | Key Capabilities | Primary Strength | Key Limitation |
|---|---|---|---|---|---|---|---|
| 1 | Lucidchart (40/50) | Structured Diagrammer | Collaborative, data-linked process maps and org charts | Lucidchart ranks #1 on a 40/50 tie-break for real-time, data-linked team diagrams and is rated 4.5/5 across 2,263 Capterra reviews. | Diagram generation from spreadsheets, SQL, AWS, Azure and GCP; real-time co-editing; BPMN, UML and ERD | Data linking plus SOC 2 Type II, ISO 27001 and FedRAMP Moderate | Free plan capped at 3 editable documents of 75 shapes; mainly online |
| 2 | draw.io (diagrams.net) (40/50) | Structured Diagrammer | Free, offline and privacy-conscious diagramming | draw.io is the strongest free diagramming tool in 2026, rated 4.6/5 across 773 Capterra reviews, with a no-account editor and offline desktop apps. | AWS, Azure, GCP, Cisco, UML, BPMN and ERD libraries; Mermaid and PlantUML import | $0 full editor with no watermark or file cap | No centralized team workspace; collaboration depends on connected storage |
| 3 | Microsoft Visio (38/50) | Structured Diagrammer | Microsoft 365 organizations and engineering diagrams | Microsoft Visio is the best fit for Microsoft 365 organizations, rated 4.54/5 across 3,284 Capterra reviews, with BPMN 2.0 and engineering diagrams in Plan 2. | BPMN 2.0, P&ID, floor plans, AutoCAD support, Excel Data Visualizer | Deepest stencil depth and vendor-published pricing | Desktop app is Windows-only; limited simultaneous editing |
| 4 | Miro (37/50) | Whiteboard | Workshops, brainstorming and agile planning | Miro is the best collaborative whiteboard for workshop-driven diagramming, rated 4.6/5 across 13,780 G2 reviews. | Infinite canvas, AI clustering, voting, timers, two-way Jira integration | Largest review base in the category | Free plan capped at 3 editable boards; slows at about 1,000 objects; no offline mode |
| 5 | Mermaid / Mermaid Chart (34/50) | Diagrams-as-Code | Software architecture and docs kept in Git | Mermaid is the most widely embedded diagrams-as-code syntax in this review, and Mermaid Chart is rated 4.7/5 across only 10 Capterra and G2 reviews. | Sequence, class, ER, C4 and Gantt diagrams; MCP server | Diagrams stay version-controlled with code | No pixel-level layout control; very few platform reviews |
| 6 | Figma FigJam (31/50) | Whiteboard | Design teams already using Figma | Figma FigJam is the best low-cost whiteboard for design-led teams, with $3 editor seats and a 4.8/5 rating from only 37 Capterra reviews. | Figma Design connection, widgets, voting, FigJam AI | Lowest published paid seat in this review | Light diagramming only; no offline mode |
| 7 | Wondershare EdrawMax (28/50) | Structured Diagrammer | Mac users wanting Visio-style desktop or one-time purchase | Wondershare EdrawMax is a cross-platform Visio alternative with .vsdx support and a perpetual license, rated 4.5/5 across 142 G2 reviews. | Up to 280 diagram types, VSD/VSDX import and export, desktop on Windows, macOS and Linux | Cross-platform desktop app with perpetual license | Conflicting prices across Edraw’s own pages; watermarked free exports |
Which Diagramming Software Should I Choose for My Use Case?
Choose by your top priority. Lucidchart fits data-linked team process maps, draw.io fits free, offline or private work, and Microsoft Visio fits Microsoft 365 organizations. Miro and Figma FigJam fit workshops. Mermaid fits diagrams versioned with code, and Wondershare EdrawMax fits Mac users who want a Visio-style desktop app.
| Your #1 Priority | Recommended Tool | Why | Acceptable Alternative |
|---|---|---|---|
| Team process maps and org charts linked to data | Lucidchart | Generates and updates diagrams from spreadsheets, SQL and cloud environments | Microsoft Visio Plan 2 (Excel Data Visualizer) |
| Free, offline or private files | draw.io | $0 editor, offline desktop apps, storage you choose | Microsoft Visio Plan 2 (offline desktop on Windows) |
| Already on Microsoft 365, or need BPMN or P&ID | Microsoft Visio | Basic web version included in eligible plans; Plan 2 adds BPMN 2.0 and P&ID | Lucidchart (Microsoft 365 App Certification) |
| Workshops and brainstorming | Miro | Unlimited free collaborators, voting, timers and AI clustering | Figma FigJam |
| Diagrams versioned with code | Mermaid | Text diagrams render natively in GitHub and GitLab | draw.io (VS Code extension, Mermaid import) |
| Design team already in Figma | Figma FigJam | Direct connection to Figma Design; $3 seat | Miro |
| Mac user who wants a Visio-style desktop app or a one-time purchase | Wondershare EdrawMax | Desktop on macOS and Linux with .vsdx support and a perpetual license | draw.io (free macOS desktop app) |
| FedRAMP or government compliance | Lucidchart | FedRAMP Moderate through Lucid GovSuite | Microsoft Visio |
What Are the Best Diagramming Software Tools in 2026?
PlugRoute’s 2026 ranking puts Lucidchart first and draw.io second, tied at 40/50. Five more tools follow with scores from 38 down to 28 points. Every entry below uses the same nine-part structure, from the At a Glance block to the verdict. All prices and ratings were verified in November 2026, and any evidence that couldn’t be verified is flagged in its entry.
1. Lucidchart: Best Overall for Teams Needing Collaborative, Data-Linked Diagrams
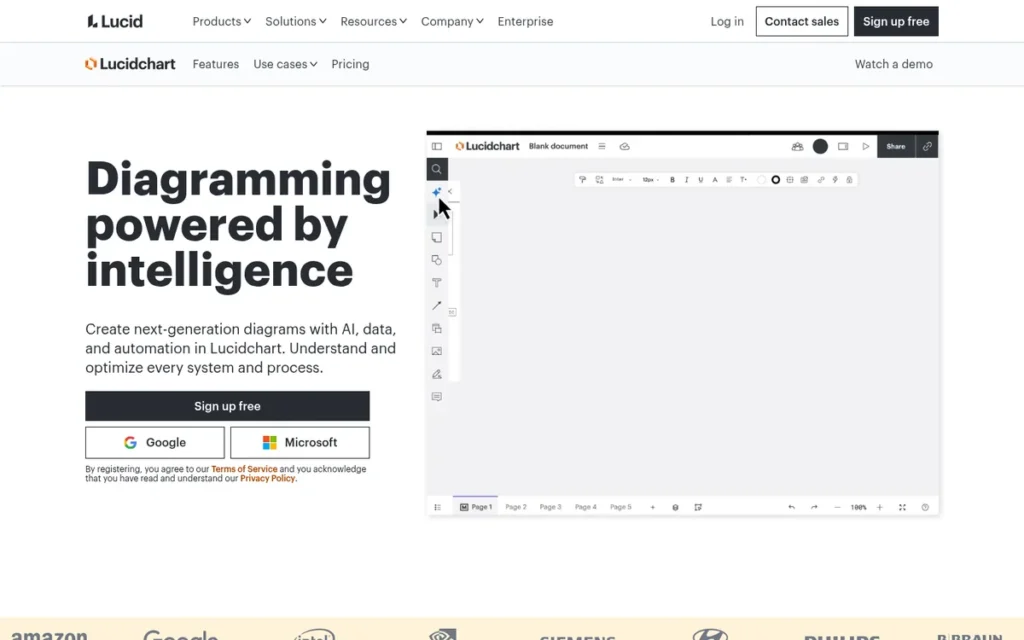
Category: Structured Diagrammer. Builds formal diagrams from shape libraries and notation standards.
At a Glance
- Category: Structured Diagrammer
- Best For: Cross-functional teams, operations managers and business analysts who need polished, data-linked process maps, swimlane diagrams and org charts edited in real time
- Price Range: Free (3 editable documents, 75 shapes each); Individual $9/user/month billed annually; Team and Enterprise tiers
- Primary Strength: Lucidchart combines real-time co-editing with the deepest data linking in this review, generating and updating diagrams from spreadsheets, SQL and cloud environments.
- Biggest Limitation: Lucidchart’s free plan caps users at 3 editable documents of 75 shapes each, and Trustpilot reviewers report per-user price increases.
- One-Line Summary: Lucidchart ranks #1 in PlugRoute’s 2026 diagramming ranking on a 40/50 tie-break, pairing real-time co-editing and data-linked diagram generation with SOC 2 Type II, ISO 27001 and FedRAMP Moderate certifications, rated 4.5/5 across 2,263 Capterra reviews.
- Last Verified: November 2026
Overview
Lucidchart is a cloud-based structured diagramming tool from Lucid Software. It combines real-time co-editing with data-linked diagram generation, and it is built for cross-functional teams that need polished flowcharts, BPMN process maps, swimlane diagrams and org charts.
Lucidchart scored 40 of 50 points in PlugRoute’s weighted ranking, tying draw.io for first. Lucidchart ranks #1 on the published tie-break because it scored 5 on diagramming capability (C1) and draw.io scored 4. Lucidchart scored 5 on collaboration (C4) and 3 on both pricing (C3) and data control (C5).
Key Features
- Lucidchart generates diagrams from Google Sheets, Excel, CSV, SQL, AWS, Azure and GCP environments, UML markup, text prompts and attached files (Lucid, November 2026).
- Lucidchart’s conditional formatting updates shapes when linked data changes, so an org chart built from an HR spreadsheet refreshes when the spreadsheet changes instead of needing a redraw (Lucid, November 2026).
- Lucidchart supports real-time co-authoring, comments and revision history for flowcharts, BPMN, UML, ERDs, network diagrams and wireframes (Lucid, November 2026).
- Lucidchart’s Lucid AI creates, refines and summarizes diagrams and runs on Microsoft Azure OpenAI Service (Lucid, November 2026).
- Lucidchart holds Microsoft 365 App Certification and integrates with Google Workspace, Confluence, Jira, Salesforce and Slack (Lucid, November 2026).
Best For
Lucidchart is best for business analysts, operations managers and cross-functional teams who do business process mapping, flowcharts and org charts that must stay tied to live data and be edited together in real time.
Pricing
Lucidchart pricing as published by Lucid (Lucid, November 2026):
- Lucidchart Free costs $0 and allows 3 editable documents with 75 shapes each and 100 templates.
- Lucidchart Individual costs $9 per user per month, billed annually.
- Lucidchart also sells Team and Enterprise tiers. Buyers should check their current per-user rates on lucidchart.com/pricing before purchase.
Strengths
- Lucidchart holds a 4.5/5 rating from 2,263 Capterra reviews, and reviewers praise its ease of use, templates, real-time collaboration and integrations (Capterra, November 2026).
- Lucidchart’s data linking covers spreadsheets, SQL and three major cloud providers, which is the broadest data-driven diagramming documented in this review (Lucid, November 2026).
- Lucidchart lists SOC 2 Type II, ISO 27001:2022 and FedRAMP Moderate (through Lucid GovSuite) on its Trust Center, and Lucid states that customer data is not used to train third-party AI models (trust.lucid.co, November 2026).
- Lucidchart is the only tool in this review for which PlugRoute found documented Microsoft 365 App Certification (Microsoft Learn, November 2026).
- Lucidchart is the tool engineers in one Reddit thread name for polished, stakeholder-facing diagrams such as sales decks, though this is community context from a single thread (Reddit r/sideprojects, October 2026).
Users on r/serverless shared their experience:
“I have used all of the above and ended up landing on LucidCharts, mostly because of their (so-so) google docs integration. Google doc collaboration and integration brings some really nice workflow options to the table.” Posted by u/ServerNoMore
Takeaway: Collaborative workflow integration is what wins practitioners over to Lucidchart, even when they rate its Google Docs integration as only middling.
Limitations
Lucidchart’s most consequential trade-off is that its polish and data linking require a cloud subscription. The free plan stops at 3 editable documents of 75 shapes each, and Individual costs $9 per user per month billed annually (Lucid, November 2026).
- Lucidchart draws Trustpilot complaints about per-user price increases and a switch from monthly to annual billing (Trustpilot, November 2026).
- Lucidchart’s cross-platform aggregate rating falls to 4.1/5 across 9,651 reviews once billing-focused platforms are included (Toolradar, November 2026).
- Lucidchart works mainly online and offers limited offline use, so teams that need fully local files should look at draw.io or Microsoft Visio Plan 2 (Lucid Help Center, November 2026).
- Lucidchart is reported by some reviewers to lag on very large diagrams and to import .vsdx files imperfectly, but PlugRoute could not tie these reports to a single dated source.
- Lucidchart’s certifications vary by deployment, because FedRAMP Moderate applies through Lucid GovSuite, so security reviewers should confirm which certifications cover their own plan.
Verdict
Lucidchart ranks #1 in PlugRoute’s 2026 diagramming ranking on a 40/50 tie-break, because it pairs the top diagramming-capability score with the strongest collaboration evidence of any structured tool.
Lucidchart fits teams that build process maps and org charts together in real time. Solo users, and teams that need offline, locally stored files, can get similar diagramming value from draw.io at $0. Teams should confirm the billing basis with Lucid before committing to annual seats.
2. draw.io (diagrams.net): Best Free Diagramming Software and Best for Offline, Private Files
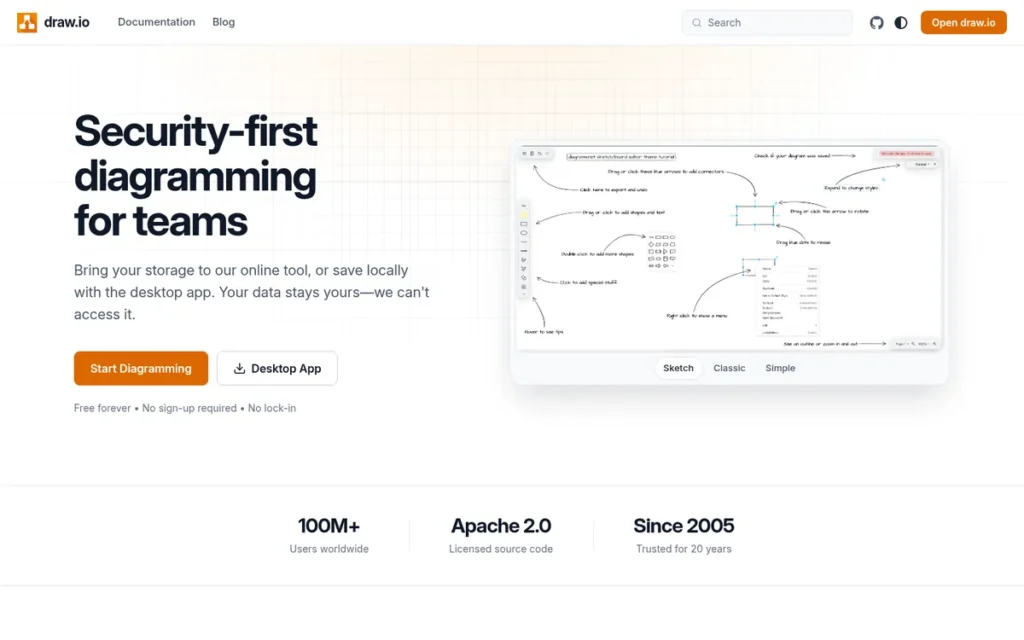
Category: Structured Diagrammer. Builds formal diagrams from shape libraries and notation standards.
At a Glance
- Category: Structured Diagrammer
- Best For: Solo users, budget-limited teams, and anyone who needs offline or air-gapped work or full control over where diagram files are stored
- Price Range: Free ($0 web and desktop editor); paid Confluence and Jira apps priced per user band on the Atlassian Marketplace
- Primary Strength: draw.io offers a complete structured diagramming editor at $0, with no account or watermark, and saves files to storage the user chooses.
- Biggest Limitation: draw.io has no centralized team workspace, so comments, permissions and version history depend on the connected storage service.
- One-Line Summary: draw.io (diagrams.net) is the strongest free diagramming tool in 2026, scoring 40/50 in PlugRoute’s ranking as an open-source, no-account editor with offline desktop apps and user-controlled file storage, rated 4.6/5 across 773 Capterra reviews.
- Last Verified: November 2026
Overview
draw.io (also called diagrams.net) is a free, open-source diagramming editor from JGraph Ltd that runs in a browser or as an offline desktop app. It is built for individuals and teams who want structured flowcharts, network diagrams and architecture diagrams without an account or subscription.
draw.io scored 40 of 50 points in PlugRoute’s weighted ranking, tying Lucidchart for first. draw.io ranks #2 on the published tie-break because its diagramming capability score (C1) is 4 and Lucidchart’s is 5. draw.io scored a perfect 5 on both pricing (C3) and data control (C5) and 3 on collaboration (C4).
Key Features
- draw.io includes shape libraries for AWS, Azure, GCP, Cisco, UML, BPMN and ERD diagrams, which cover network, cloud architecture and process work without add-ons (drawio.com, November 2026).
- draw.io offers a free desktop app for Windows, macOS and Linux that works fully offline, including on restricted networks, and its web app keeps working offline once a diagram has loaded (drawio.com, November 2026).
- draw.io saves files to the user’s device, Google Drive, OneDrive, Dropbox, GitHub or GitLab, and JGraph states that draw.io does not store diagram data on its own servers (drawio.com, November 2026).
- draw.io imports Mermaid and PlantUML text and offers a VS Code extension, so developers can keep visual diagrams next to their code (drawio.com, November 2026).
- draw.io’s source code is published under the Apache 2.0 license on GitHub (drawio.com, November 2026).
Best For
draw.io is best for solo diagrammers, small teams avoiding subscriptions, and privacy-conscious or offline users. It covers flowcharts, network diagrams and architecture diagrams without handing files to a vendor’s cloud.
Pricing
draw.io pricing as published by JGraph (drawio.com, November 2026):
- draw.io’s web and desktop editor costs $0, with no paid tier, no watermark and no account required.
- draw.io’s paid products are the Confluence and Jira apps, priced per user band on the Atlassian Marketplace.
- draw.io’s Marketplace tier prices could not be verified from the Atlassian Marketplace listing as of November 2026, so buyers should check the live listing.
Strengths
- draw.io for Confluence shows about 60,000 installs on the Atlassian Marketplace. The listing also claims more installs than all other native Confluence diagram apps combined, but that is an unaudited vendor claim (Atlassian Marketplace, November 2026).
- draw.io holds 4.6/5 from 773 verified Capterra reviews and 4.4/5 from 450 G2 reviews, and one Capterra reviewer calls it “simple, free and doesn’t get in the way” (Capterra; G2, November 2026).
- draw.io was the top-voted answer when a Reddit user who couldn’t afford Visio asked for diagramming software, though the thread is old and the sample is small (Reddit r/technicalwriting, 2019).
- draw.io’s privacy model rests on an architecture anyone can inspect, because the Apache 2.0 source code is public (GitHub, November 2026).
Limitations
draw.io’s most consequential trade-off is the lack of a centralized team workspace. Comments, permissions and version history work differently in Google Drive, Confluence and GitHub (drawio.com, November 2026).
- draw.io’s simultaneous group editing is described as clumsy by Capterra reviewers, and some reviewers call its interface “a bit dated” (Capterra, November 2026).
- draw.io receives G2 complaints about lag on large diagrams, limited symbols for complex work, and AI generation that is “not smooth” (G2, November 2026).
- draw.io publishes no SOC 2 report or ISO 27001 certificate. Its security documentation instead says the architecture keeps diagram data off draw.io servers, so regulated buyers must assess that model without third-party audits (drawio.com, November 2026).
This aligns with community sentiment on r/software:
“So, I’m using this web application called Draw.io, and it’s not a bad software, except every time I add more and more shapes or images, it kept slowing, and lagging to the point where some of my shapes or images suddenly moved from one place to the next when I don’t want it to. It’s even forcing me to wait till it responds, but I have NO patients for it at all, and I wanna resume what I’m doing, and get it done sooner.” Posted by u/Shades96
Takeaway: draw.io’s web editor can slow down badly as shapes and images pile up, so heavy users should test their largest real diagram before standardizing on it.
Verdict
draw.io is the best free diagramming tool in 2026, combining a complete structured editor, offline desktop apps and user-controlled storage at $0.
draw.io is the only tool in this review that offers a full structured editor at $0 with no file cap. Teams that need a shared workspace with built-in permissions, live co-editing or data-linked diagrams may outgrow draw.io and should compare it with Lucidchart.
3. Microsoft Visio: Best for Microsoft 365 Organizations and Engineering-Grade Diagrams
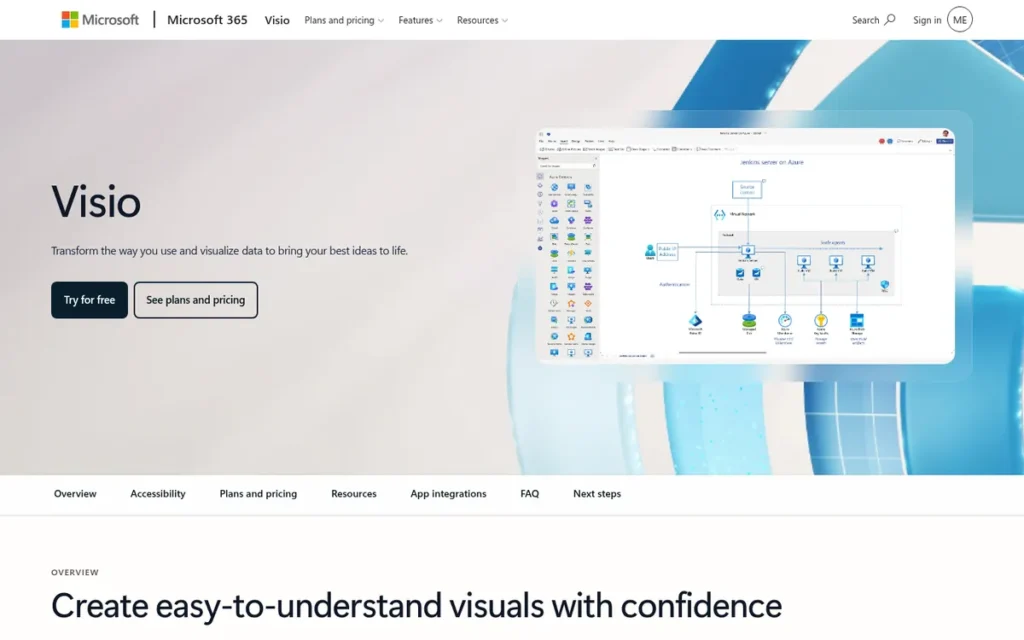
Category: Structured Diagrammer. Builds formal diagrams from shape libraries and notation standards.
At a Glance
- Category: Structured Diagrammer
- Best For: Microsoft 365 organizations, IT and network engineers, and process teams that need BPMN, P&ID or engineering diagrams
- Price Range: Basic web version included in eligible Microsoft 365 commercial plans; $5–$15/user/month billed annually; $309.99–$579.99 one-time for one PC
- Primary Strength: Microsoft Visio offers the deepest standards and engineering stencil support in this review and publishes its own subscription and perpetual pricing.
- Biggest Limitation: Microsoft Visio’s desktop app is Windows-only, and reviewers report limited simultaneous editing and sharing friction with non-Visio users.
- One-Line Summary: Microsoft Visio is the best diagramming choice for Microsoft 365 organizations in 2026, scoring 38/50 in PlugRoute’s ranking, with a basic web version included in eligible plans, BPMN 2.0 and engineering diagrams in Plan 2, and a 4.54/5 rating across 3,284 Capterra reviews.
- Last Verified: November 2026
Overview
Microsoft Visio is Microsoft’s professional diagramming application. It is sold as a basic web version in eligible Microsoft 365 plans, as two subscriptions and as perpetual 2024 licenses. It is built for organizations that need process, network, engineering and org-chart diagrams inside Microsoft’s ecosystem.
Microsoft Visio scored 38 of 50 points in PlugRoute’s weighted ranking. Microsoft Visio earned 5 on diagramming capability (C1) and 4 on both pricing (C3) and data control (C5). Microsoft Visio lost points on collaboration (C4: 3) and on platform support (C6: 2), because its desktop app runs only on Windows.
Key Features
- Microsoft Visio Plan 1 adds advanced org-chart layouts, cross-functional swimlane flowcharts, network, Azure and AWS diagrams, ERDs and UML class diagrams to the web and Teams editor (Microsoft Support, November 2026).
- Microsoft Visio Plan 2 adds the Windows desktop app, offline and local files, 250,000+ shapes, BPMN 2.0, P&ID, floor plans and AutoCAD support (Microsoft Support, November 2026).
- Microsoft Visio Data Visualizer generates and refreshes flowcharts and org charts from Excel tables, a capability tied to Plan 2 (Microsoft, November 2026).
- Microsoft Visio works inside Microsoft 365 and Teams, so diagrams can be created and shared without leaving the Microsoft ecosystem (Microsoft Support, November 2026).
- Microsoft Visio uses the .vsdx format, the de facto interchange standard that competing tools try to import faithfully (Rework, November 2026).
Best For
Microsoft Visio is best for organizations already on Microsoft 365. It also suits IT, network and process engineers who need BPMN 2.0, P&ID or AutoCAD-compatible diagrams on Windows.
Pricing
Microsoft Visio pricing as published by Microsoft (Microsoft, November 2026):
- Microsoft Visio’s basic web version is included in eligible Microsoft 365 commercial plans.
- Microsoft Visio Plan 1 costs $5 per user per month, billed annually.
- Microsoft Visio Plan 2 costs $15 per user per month, billed annually.
- Microsoft Visio Standard 2024 costs $309.99 and Visio Professional 2024 costs $579.99 as one-time purchases for one PC. Neither license receives the ongoing feature updates of Plan 1 and Plan 2.
Strengths
- Microsoft Visio holds 4.54/5 across 3,284 Capterra reviews, the largest Capterra sample in this review, and reviewers praise its familiarity, stencil depth and Microsoft integration (Capterra, November 2026).
- Microsoft Visio publishes its own subscription and perpetual prices, and Plan 1 at $5 per user per month is the cheapest paid entry point among the structured tools reviewed (Microsoft, November 2026).
- Microsoft Visio Plan 2 is the only tool reviewed that documents BPMN 2.0, P&ID, floor plans and AutoCAD support together in one product (Microsoft Support, November 2026).
- Microsoft Visio earns TrustRadius praise for version history that helps compare process changes and for its coverage of network, process, org and floor-plan diagrams (TrustRadius, November 2026).
Limitations
Microsoft Visio’s most consequential trade-off is that its deepest capabilities sit in Plan 2’s Windows-only desktop app. Mac teams cannot run the full product natively (Microsoft Support, November 2026).
- Microsoft Visio holds a lower 4.2/5 across 694 G2 reviews. G2 reviewers cite limited simultaneous editing, compatibility problems with non-Visio users and high cost (G2, November 2026).
- Microsoft Visio draws GetApp complaints about pricing, connector alignment, version compatibility and a learning curve (GetApp, November 2026).
- Microsoft Visio’s split between the included version, Plan 1 and Plan 2 confuses buyers, and one Reddit user calls Visio “probably overkill” for simple flowcharts (Reddit r/technicalwriting, 2019).
- Microsoft Visio’s desktop license can be a cost barrier for individuals. One Reddit user wrote, “I’ve looked at Visio but I don’t have the money to buy the desktop version” (Reddit r/technicalwriting, 2019).
- Microsoft Visio’s compliance coverage is inherited from Microsoft 365, and PlugRoute did not verify Visio-specific certification scope.
Users on r/serverless noted:
“I use draw.io or visio depending on who is paying for the visio licence. Both are great tools.” Posted by u/Wandie87
Takeaway: Practitioners rate Microsoft Visio highly, but who pays for the licence often decides whether they use it or switch to free draw.io.
Verdict
Microsoft Visio is the strongest diagramming choice for Microsoft 365 organizations and engineering-grade diagrams in 2026, because it pairs the deepest standards support in this review with vendor-published pricing.
Microsoft Visio buyers should first check whether the basic web version is already included in their plan. Mac users and teams that co-edit heavily in real time should compare Microsoft Visio with Lucidchart or draw.io before committing.
4. Miro: Best for Workshops, Brainstorming and Team Whiteboarding

Category: Whiteboard. A freeform infinite canvas for collaborative workshops and brainstorming.
At a Glance
- Category: Whiteboard
- Best For: Distributed teams that run workshops, brainstorms, retrospectives and agile planning, and diagram as part of that work
- Price Range: Free (unlimited collaborators, 3 editable boards); Starter $8 and Business $20/member/month billed annually; Enterprise custom
- Primary Strength: Miro has the largest review base in the category, at 4.6/5 across 13,780 G2 reviews, plus broad real-time collaboration and integrations.
- Biggest Limitation: Miro is a whiteboard first, its free plan caps teams at 3 editable boards, and its own documentation says performance can degrade at about 1,000 objects.
- One-Line Summary: Miro is the best collaborative whiteboard for workshop-driven diagramming in 2026, scoring 37/50 in PlugRoute’s ranking and rated 4.6/5 across 13,780 G2 reviews, though its free plan allows only 3 editable boards and it is not designed for formal engineering diagrams.
- Last Verified: November 2026
Overview
Miro is an infinite-canvas collaboration workspace that combines whiteboarding, sticky-note workshops, AI clustering and diagram templates. It is built for distributed teams that run workshops, brainstorms and agile ceremonies more often than they produce formal, standards-based diagrams.
Miro scored 37 of 50 points in PlugRoute’s weighted ranking. Miro earned the top reputation score (C2: 5) and a collaboration score of 5 (C4). Miro lost points on diagramming capability (C1: 3) and on scale (C6: 2), because its own documentation reports slowdowns at about 1,000 objects.
Key Features
- Miro provides templates for flowcharts, process maps, org charts, journey maps, service blueprints, architecture diagrams, mind maps and agile boards on one canvas (Miro, November 2026).
- Miro AI clusters and summarizes sticky notes and turns prompts or documents into diagrams, timelines and decks (Miro, November 2026).
- Miro supports live cursors, voting and timers for facilitated real-time workshops (Miro, November 2026).
- Miro offers a two-way Jira integration, and some Jira features require a paid tier (Miro Help Center, November 2026).
- Miro claims SOC 2, SOC 3, ISO 27001 and ISO 42001 certifications for enterprise security review (Miro, as reported by Toollers, November 2026).
Best For
Miro is best for distributed product, agile and cross-functional teams whose diagramming happens inside workshops, brainstorms and planning sessions rather than in formal, standards-based documentation.
Pricing
Miro pricing as published by Miro (Miro, November 2026):
- Miro Free costs $0 and allows unlimited collaborators but only 3 editable boards.
- Miro Starter costs $8 per member per month, billed annually.
- Miro Business costs $20 per member per month, billed annually.
- Miro Enterprise is custom-priced.
- Miro changed ownership when Bending Spoons completed its acquisition on October 26, 2026, so buyers on multi-year contracts should review renewal and pricing terms (Bending Spoons SEC filing, October 2026).
Strengths
- Miro holds 4.6/5 across 13,780 G2 reviews, the highest review volume in the category, and 4.7/5 across 1,707 Capterra reviews (G2; Capterra, November 2026).
- Miro’s free plan allows unlimited collaborators, so occasional workshop participants can join without a paid seat (Miro Help Center, November 2026).
- Miro earns consistent praise from G2 and Capterra reviewers for real-time collaboration, templates, voting, live cursors and its Slack and Jira integrations (G2; Capterra, November 2026).
- Miro claims SOC 2, SOC 3, ISO 27001 and ISO 42001, and it is the only tool in this review that claims ISO 42001 for AI management (Miro, as reported by Toollers, November 2026).
Users on r/userexperience shared their experience:
“Miro is surprisingly robust. I had thought of it initially as a whiteboarding tool but it is solid for a lot more things.” Posted by u/zoinkability
Takeaway: UX practitioners find Miro handles flow diagramming better than its whiteboard-only reputation suggests.
Limitations
Miro’s most consequential trade-off is that its open canvas suits workshops better than formal BPMN, network or engineering diagrams. One Reddit user says Figma and Miro “are great for whiteboarding,” then recommends a separate tool when work leans on organizing research materials (Reddit r/userexperience, 2021).
- Miro’s own help documentation says performance can degrade at about 1,000 objects and recommends keeping boards under 5,000 objects, with a hard cap of 100,000 (Miro Help Center, November 2026).
- Miro’s free plan caps teams at 3 editable boards (Miro Help Center, November 2026).
- Miro has about 53 Trustpilot reviews, mostly negative, that report unexpected charges, auto-renewals, collaborators allegedly creating paid seats and boards freezing in live sessions. That sample is small and skews toward billing problems (Trustpilot, November 2026).
- Miro has no offline mode, and Miro’s help center says offline editing isn’t currently planned and recommends exporting boards as PDF, image or CSV (Miro Help Center, November 2026).
Verdict
Miro is the best choice in 2026 for teams whose diagramming happens inside workshops and brainstorms, backed by the largest review base in the category.
Miro is not the right primary tool for formal BPMN, network or engineering documentation. Teams should plan around Miro’s 3-editable-board free cap and review seat-billing settings before inviting many collaborators.
5. Mermaid / Mermaid Chart: Best for Diagrams-as-Code and Software Architecture Documentation
Category: Diagrams-as-Code. Renders diagrams from text definitions stored alongside code.
At a Glance
- Category: Diagrams-as-Code
- Best For: Software developers, architects and technical writers who want diagrams version-controlled with code and documentation
- Price Range: Free (open source); Mermaid Chart $0–$20/user/month billed annually only; Enterprise custom
- Primary Strength: Mermaid keeps diagrams as version-controlled text that renders natively in GitHub, GitLab, Notion and Obsidian, so documentation diagrams stay in sync with code.
- Biggest Limitation: Mermaid offers no pixel-level layout control, and its auto-layout becomes hard to read on larger diagrams.
- One-Line Summary: Mermaid is the most widely embedded diagrams-as-code syntax in this review, scoring 34/50 in PlugRoute’s ranking. It is a free, open-source text format that renders natively in GitHub and GitLab, and Mermaid Chart is rated 4.7/5 across only 10 combined Capterra and G2 reviews.
- Last Verified: November 2026
Overview
Mermaid is an open-source, text-based diagramming syntax that renders flowcharts and sequence, class, ER, C4 and Gantt diagrams from Markdown-style code. It is built for developers and technical writers who keep diagrams in Git and review diagram changes in pull requests, just like code.
Mermaid scored 34 of 50 points in PlugRoute’s weighted ranking. Mermaid earned 5 on pricing (C3) and 4 on both collaboration (C4) and data control (C5). Mermaid scored 2 on reputation (C2) because Mermaid Chart has only 10 reviews across Capterra and G2, far below PlugRoute’s 200-review confidence threshold.
Key Features
- Mermaid renders flowchart, sequence, class, state, ER, Gantt, C4, architecture, mindmap, timeline and Sankey diagrams from plain-text definitions (Mermaid, November 2026).
- Mermaid renders natively in GitHub (since February 2022), GitLab, Notion and Obsidian, so diagrams appear inline in repositories and docs (Mermaid, November 2026).
- Mermaid Chart plugins extend Mermaid to Confluence, Jira, VS Code, JetBrains, Google Docs, Word and PowerPoint (Mermaid, November 2026).
- Mermaid offers an MCP server so AI assistants such as Claude, Cursor and VS Code can generate and edit diagrams (Mermaid, November 2026).
- Mermaid Chart adds a visual editor, AI generation with credit allowances, real-time collaboration and team administration on paid tiers (mermaid.ai, November 2026).
Best For
Mermaid is best for engineering and DevOps teams that document software architecture, API call sequences and data models. These diagrams must stay version-controlled and reviewable alongside code.
Pricing
Mermaid pricing as published by the vendor (mermaid.ai, November 2026):
- Mermaid’s open-source library is free.
- Mermaid Chart Basic costs $0 for up to 3 diagrams, with limited AI.
- Mermaid Chart Plus costs $10 per user per month billed annually, with unlimited diagrams and 300 AI credits per year.
- Mermaid Chart Premium costs $20 per user per month billed annually, with 2,000 AI credits, collaboration and unlimited free viewers.
- Mermaid Chart Enterprise is custom-priced and includes SSO.
- Mermaid Chart’s paid plans are billed annually only. Third-party sources that quote $6.67–$10 under the older Free, Pro and Team plans are out of date.
Strengths
- Mermaid has rendered natively on GitHub since February 2022, the largest adoption signal documented in this review, so diagrams display inline without plugins (Mermaid, November 2026).
- Mermaid Chart publishes current tiers of $0, $10 and $20 per user per month, and the open-source library costs nothing (mermaid.ai, November 2026).
- Mermaid is called “the king” for change-controlled API call-sequence diagrams committed in Markdown by one developer, though this is a single community opinion (Reddit r/sideprojects, October 2026).
- Mermaid stores diagrams as text in the user’s own repository, so access control, history and offline availability follow the team’s existing Git workflow (Mermaid, November 2026).
Limitations
Mermaid’s most consequential trade-off is that it gives up layout control for version control. Mermaid offers no pixel-level positioning, and its styling is verbose and limited (GitHub community style guides, November 2026).
- Mermaid’s auto-layout produces “spaghetti” once a diagram has more than a few boxes, according to one Reddit user, and community style guides treat about 50 nodes as the practical readability limit on GitHub (Reddit r/sideprojects, October 2026; GitHub community style guides, November 2026).
- Mermaid renders differently across platforms because GitHub does not support the ELK layout engine, and its syntax is a barrier for non-technical colleagues (GitHub community style guides, November 2026).
- Mermaid is a poor fit for org charts and polished executive visuals (GitHub community style guides, November 2026).
- Mermaid Chart holds 4.7/5 on Capterra from 3 reviews and 4.7/5 on G2 from 7 reviews, which is too few for confidence under PlugRoute’s 200-review threshold (Capterra; G2, November 2026).
Users on r/homelab noted:
“Mermaid isn’t designed for network topologies and it needs tweaks/modifications to attempt to diagram them. It is made to do business and process flows really well though.” Posted by u/xamboozi
Takeaway: Mermaid handles business and process flows well but struggles with network topology diagrams, so it can’t serve as a team’s only diagramming tool.
Verdict
Mermaid is the best tool in 2026 for keeping software architecture and documentation diagrams in sync with code, because its diagrams live as version-controlled text that renders natively in GitHub and GitLab.
Mermaid is the wrong choice for polished stakeholder visuals, org charts or large diagrams that need precise layout. Many engineering teams pair Mermaid for repository docs with a visual tool such as Lucidchart or draw.io for presentation diagrams.
6. Figma FigJam: Best for Design-Led Teams Already Using Figma
Category: Whiteboard. A freeform infinite canvas for collaborative workshops and brainstorming.
At a Glance
- Category: Whiteboard
- Best For: Product design teams already working in Figma that need user flows, journey maps and workshop boards
- Price Range: Free (3 FigJam files) plus $3–$5/editor/month; Enterprise custom
- Primary Strength: Figma FigJam offers the lowest published paid seat in this review and connects directly to Figma Design files.
- Biggest Limitation: Figma FigJam is built for light diagramming and workshops, not formal BPMN, network or engineering diagrams, and it has no offline mode.
- One-Line Summary: Figma FigJam is the best low-cost whiteboard for design-led teams in 2026, scoring 31/50 in PlugRoute’s ranking, with paid seats from $3 per editor per month and a 4.8/5 Capterra rating that rests on only 37 reviews.
- Last Verified: November 2026
Overview
Figma FigJam is an online whiteboard from Figma for brainstorming, user flows, journey maps, light flowcharts and retrospectives. It is built for design-led product teams that already work in Figma Design and want the lowest-priced paid seat in this review.
Figma FigJam scored 31 of 50 points in PlugRoute’s weighted ranking. Figma FigJam earned 4 on both pricing (C3) and integration (C4). Figma FigJam lost points on diagramming capability (C1: 2), on reputation (C2: 3) because of a small review sample, and on scale (C6: 2).
Key Features
- Figma FigJam connects directly to Figma Design files, so teams can move between planning boards and design work in one ecosystem (Figma, November 2026).
- Figma FigJam includes widgets, voting, timers, stamps, emotes and audio chat for running workshops and retrospectives (Capterra, November 2026).
- Figma FigJam AI generates diagrams from prompts, sorts and clusters sticky notes, and summarizes workshop output (Figma, November 2026).
- Figma FigJam integrates with Jira, Slack and Microsoft Teams for product and engineering handoffs (Figma, November 2026).
- Figma FigJam is covered by Figma’s SOC 2 Type II and ISO 27001 certifications (Figma, via Professionals Toolkit review, November 2026).
Best For
Figma FigJam is best for product and design teams already paying for Figma who need user flows, journey maps, brainstorms and retrospectives at the lowest per-seat cost.
Pricing
Figma FigJam pricing as published by Figma (Figma, November 2026):
- Figma FigJam Starter is free, with 3 FigJam files in the team space plus unlimited drafts.
- Figma FigJam Professional costs $3 per editor per month billed annually, or $5 billed monthly.
- Figma FigJam Organization costs $5 per editor per month billed annually, and Enterprise is custom-priced.
- Figma’s 2025 seat model includes FigJam in a Collab seat ($3 per month annual, $5 monthly) that also covers Figma Slides, Buzz and Specs. Dev seats ($10/$12) and Full seats ($12/$16) cost more.
Strengths
- Figma FigJam’s Professional seat costs $3 per editor per month billed annually, the lowest published paid seat among the seven tools reviewed (Figma, November 2026).
- Figma FigJam holds 4.8/5 on Capterra with about 90% of reviewers likely to recommend it, but that rating comes from only 37 reviews. The Figma platform overall holds 4.7/5 across 878 reviews (Capterra, November 2026).
- Figma FigJam is covered by Figma’s SOC 2 Type II and ISO 27001 certifications, which matters to security reviewers comparing whiteboards (Figma, via Professionals Toolkit review, November 2026).
- Figma FigJam earns Capterra praise for its easy interface, templates and smooth movement between planning and design work (Capterra, November 2026).
Limitations
Figma FigJam’s most consequential trade-off is that it is built for lightweight, design-adjacent collaboration. Capterra reviewers note its limits compared with specialized diagram tools for formal BPMN, network or engineering work (Capterra, November 2026).
- Figma FigJam has no offline mode, and Capterra and G2 reviewers report lag on large boards (Capterra; G2, November 2026).
- Figma FigJam lets participants post sticky notes outside the visible area, which one facilitator says pulls time away from leading the discussion (Reddit r/userexperience, October 2024).
- Figma FigJam’s free Starter plan allows only 3 team-space files, and Figma’s 2025 seat changes drew complaints about seat-based billing (Capterra, November 2026).
- Figma FigJam’s current G2 score and review count could not be verified from G2 as of November 2026.
Verdict
Figma FigJam is the best-value whiteboard in 2026 for design-led teams already in Figma, with the lowest published paid seat in this review.
Figma FigJam is not a substitute for a structured diagramming tool when formal process, network or architecture diagrams are required. Figma FigJam’s 4.8/5 Capterra rating should be read cautiously, because it rests on only 37 reviews.
7. Wondershare EdrawMax: Best for Mac Users Wanting a Visio-Style Desktop App or a Perpetual License
Category: Structured Diagrammer. Builds formal diagrams from shape libraries and notation standards.
At a Glance
- Category: Structured Diagrammer
- Best For: Mac and Linux users and individuals who want a Visio-style desktop app, .vsdx compatibility or a one-time purchase instead of a subscription
- Price Range: Free (watermarked) plus about $5.90–$15.90/month; $99/year individual annual plan also shown; perpetual $198 promotional ($245 listed)
- Primary Strength: Wondershare EdrawMax offers a cross-platform desktop app with .vsdx import and export and a perpetual license option.
- Biggest Limitation: Wondershare EdrawMax shows conflicting prices across its own pages, watermarks free exports and draws auto-renewal and refund complaints.
- One-Line Summary: Wondershare EdrawMax is a cross-platform Visio alternative in 2026, scoring 28/50 in PlugRoute’s ranking, for Mac and Linux users who want desktop diagramming with .vsdx support and a perpetual license, rated 4.5/5 across 142 G2 reviews.
- Last Verified: November 2026
Overview
Wondershare EdrawMax is a cross-platform diagramming application for Windows, macOS, Linux, web and mobile that advertises up to 280 diagram types and Visio file import and export. It is built for Mac users and individuals who want a Visio-style desktop tool or a perpetual license.
Wondershare EdrawMax scored 28 of 50 points in PlugRoute’s weighted ranking. Wondershare EdrawMax earned 4 on diagramming capability (C1) and 3 on both data control (C5) and scale (C6). Wondershare EdrawMax lost points on pricing transparency (C3: 2) and collaboration (C4: 2).
Key Features
- Wondershare EdrawMax advertises up to 280 diagram types, 1,500+ built-in templates and 26,000+ symbols, though Edraw’s own pages give different counts (Edraw, November 2026).
- Wondershare EdrawMax runs as a desktop app on Windows, macOS and Linux, and also on web and mobile (Edraw, November 2026).
- Wondershare EdrawMax imports and exports VSD and VSDX files, imports CAD and SVG, and exports to PDF, Office formats, SVG and HTML (Edraw, November 2026).
- Wondershare EdrawMax’s Edraw AI generates flowcharts, mind maps and slides from prompts and analyzes documents, code and images on token quotas (Edraw, November 2026).
- Wondershare EdrawMax offers a perpetual license as well as monthly and annual subscriptions (Edraw, November 2026).
Best For
Wondershare EdrawMax is best for Mac and Linux users who need Visio-compatible desktop diagramming. It also suits individuals who would rather make a one-time purchase than pay an ongoing subscription.
Pricing
Wondershare EdrawMax pricing could not be verified as a single figure from Edraw’s own pages as of November 2026. The figures shown on those pages are (Edraw, November 2026):
- Wondershare EdrawMax Free costs $0, with 500 AI tokens, 100 MB of cloud storage and watermarked exports.
- Wondershare EdrawMax Basic costs $7.90 per month, or $5.90 per month billed annually.
- Wondershare EdrawMax Unlimited costs $15.90 per month, or $11.90 per month billed annually.
- Wondershare EdrawMax’s store also shows a $99-per-year individual plan (listed at $119), which conflicts with the $5.90 Basic price.
- Wondershare EdrawMax’s perpetual license costs $198 (listed at $245) and includes perpetual desktop use, 3 years of cloud and mobile access and 1 year of upgrades.
- Wondershare EdrawMax team pricing appears as about $9.92 per user per month (Capterra, November 2026).
Strengths
- Wondershare EdrawMax holds 4.5/5 on both G2 (142 reviews) and Capterra (205 reviews), and Capterra reviewers praise it as an affordable Visio alternative that works on Mac (G2; Capterra, November 2026).
- Wondershare EdrawMax is one of only two tools in this review, alongside Microsoft Visio, that sells a perpetual license (Edraw, November 2026).
- Wondershare EdrawMax earns G2 praise for its template library, breadth of diagram types, easy PDF and Word export, and AI text extraction (G2, November 2026).
- Wondershare EdrawMax imports and exports .vsdx files on macOS and Linux, so non-Windows users can exchange files with Visio-based teams (Edraw, November 2026).
Limitations
Wondershare EdrawMax’s most consequential trade-off is that its broad feature set comes with the least transparent pricing in this review, because Edraw’s own pages show several conflicting prices (Edraw, November 2026).
- Wondershare EdrawMax watermarks free exports, and review analyses report auto-renewal and refund problems, upselling and a cluttered interface (Saascrmreview; Rework, November 2026).
- Wondershare EdrawMax’s feature counts conflict across Edraw pages (260 vs 280 diagram types, 26,000 vs 50,000+ symbols), and its 25M+ user figure is self-reported with no named customers (Edraw, November 2026).
- Wondershare EdrawMax has thinner documented collaboration and integration evidence than the cloud-first tools in this review.
- Wondershare EdrawMax pages claim ISO 27001 and GDPR compliance, but regulated or government buyers should still request certificate scope and data-residency terms (Edraw, November 2026).
Verdict
Wondershare EdrawMax is a credible Visio alternative in 2026 for Mac and Linux users who want desktop diagramming with .vsdx support and the option to buy once.
Wondershare EdrawMax’s rank is held back by conflicting pricing, watermarked free exports and documented billing complaints, not by limited diagram coverage. Buyers should confirm the checkout price and turn off auto-renewal if they don’t want it.
What Do Free Diagramming Plans Actually Include?
Most free diagramming plans cap work at about three boards, files, documents or diagrams. draw.io’s full editor is the exception, with no cap at all. Microsoft Visio’s basic web version costs nothing extra only if your Microsoft 365 commercial plan includes it. Wondershare EdrawMax’s free tier watermarks exports instead of capping files.
| Tool | Free Plan | Main Free-Plan Limit | Typical Upgrade Trigger |
|---|---|---|---|
| Lucidchart | Free plan | 3 editable documents; 75 shapes per document (Lucid Help Center, November 2026) | Exceeding 3 documents or 75 shapes |
| draw.io | Full web and desktop editor, $0 | No editable-file cap or watermark | Wanting the paid Confluence or Jira apps |
| Microsoft Visio | Basic web version in eligible Microsoft 365 commercial plans | Advanced diagrams need Plan 1 or Plan 2 | Needing BPMN, P&ID, desktop or offline work |
| Miro | Unlimited collaborators | 3 editable boards | Needing a fourth active board |
| Mermaid | Open source unlimited; Mermaid Chart Basic $0 | Mermaid Chart Basic allows 3 diagrams | Wanting hosted collaboration or more AI credits |
| Figma FigJam | Starter, free | 3 FigJam files in team space plus unlimited drafts | Needing more shared team files |
| Wondershare EdrawMax | Free, 500 AI tokens, 100 MB storage | Watermarked exports | Needing clean exports for clients or documents |
PlugRoute checked every free-plan limit above in November 2026 against vendor pages and the sources named in each entry.
How Much Does Diagramming Software Cost in 2026?
In 2026, paid diagramming software starts at $3 per editor per month for Figma FigJam. It reaches $20 per user or member per month for Mermaid Chart Premium and Miro Business. Microsoft Visio and Wondershare EdrawMax also sell one-time licenses. Wondershare EdrawMax is the only tool whose own pages show conflicting prices.
| Tool | Entry Paid Price | Billing Basis | One-Time Option | Vendor-Verified? (Nov 2026) |
|---|---|---|---|---|
| Lucidchart | $9 (Individual) | Per user per month, billed annually | None documented | Yes |
| draw.io | $0 (editor); Atlassian apps per user band | Per user band (Confluence/Jira apps) | Not applicable | Yes (editor); Marketplace tiers not verified |
| Microsoft Visio | $5 (Plan 1); $15 (Plan 2) | Per user per month, billed annually | $309.99 Standard; $579.99 Professional 2024 (one PC, no feature upgrades) | Yes |
| Miro | $8 (Starter); $20 (Business) | Per member per month, billed annually | None documented | Yes |
| Mermaid Chart | $10 (Plus); $20 (Premium) | Per user per month, billed annually only | Not applicable | Yes |
| Figma FigJam | $3 (Professional) | Per editor per month, billed annually ($5 monthly) | None documented | Yes |
| Wondershare EdrawMax | $5.90 (Basic); $99/year individual annual also shown | Per month, billed annually ($7.90 monthly) | $198 promotional; $245 listed | Conflicting across Edraw pages |
Each vendor meters AI features differently (vendor pages, November 2026):
- Mermaid Chart includes 300 AI credits per year on Plus and 2,000 on Premium (mermaid.ai, November 2026).
- Wondershare EdrawMax runs Edraw AI on token quotas, with 500 tokens on the free plan (Edraw, November 2026).
- Lucidchart’s Lucid AI runs on Microsoft Azure OpenAI Service, and Lucid states customer data is not used to train third-party models (Lucid, November 2026).
- Miro AI and Figma FigJam AI usage allowances were not documented in the sources PlugRoute reviewed.
- draw.io’s AI generation is described as “not smooth” by G2 reviewers (G2, November 2026).
Which Diagramming Tools Work Offline and Keep My Files Private?
draw.io gives users the most control over their files, because its desktop apps work fully offline and files stay in storage the user chooses. Mermaid keeps diagrams as text in your own Git repository. Microsoft Visio Plan 2 and Wondershare EdrawMax offer desktop apps. Lucidchart, Miro and Figma FigJam are cloud-first.
| Tool | Offline Access | Where Files Live | Desktop / OS | Claimed Certifications | AI Training Policy |
|---|---|---|---|---|---|
| Lucidchart | Limited | Lucid cloud | Web | SOC 2 Type II, ISO 27001:2022, FedRAMP Moderate via GovSuite (verified, trust.lucid.co) | Customer data not used to train third-party models |
| draw.io | Full offline desktop, suitable for air-gapped or restricted networks; web works offline once loaded | User’s device or chosen cloud/Git service | Windows, macOS, Linux | None published | Not documented |
| Microsoft Visio | Plan 2 desktop with local files, suitable for restricted networks | Microsoft 365 or local (Plan 2) | Windows desktop; web | Inherited from Microsoft 365; scope not verified | Not documented |
| Miro | No offline mode (Miro Help Center) | Miro cloud | Web | SOC 2, SOC 3, ISO 27001, ISO 42001 (claimed) | Not documented |
| Mermaid | Yes, via local Git repository | User’s repository (Mermaid Chart: hosted) | Runs wherever Markdown renders | Not documented; Enterprise SSO | Not documented |
| Figma FigJam | No offline mode | Figma cloud | Web | SOC 2 Type II, ISO 27001 | Not documented |
| Wondershare EdrawMax | Desktop app | Local or Edraw cloud (100 MB free, 1 GB Basic) | Windows, macOS, Linux, web, mobile | ISO 27001 and GDPR claimed; SOC 2 mentioned | Not documented |
Which Diagramming Tool Fits Flowcharts, Org Charts, Process Maps and Software Architecture?
For flowcharts and org charts, Lucidchart is the strongest team pick and draw.io is the strongest free pick. For business process mapping in BPMN 2.0, Microsoft Visio Plan 2 and Lucidchart lead. For software architecture kept with code, Mermaid fits best. draw.io suits visual cloud architecture diagrams.
- Lucidchart is the strongest pick for team flowcharts and org charts, because it builds org charts from spreadsheets and refreshes them when the data changes (Lucid, November 2026).
- Microsoft Visio Plan 2 is the strongest pick for formal business process mapping, because it documents BPMN 2.0 alongside Data Visualizer flowcharts built from Excel (Microsoft Support, November 2026).
- draw.io covers flowcharts, org charts and BPMN process maps for free, though users must redraw charts by hand when the underlying data changes.
- Mermaid is the best fit for software architecture documentation that must stay in sync with code, while draw.io suits visual architecture diagrams that use AWS, Azure and GCP shapes.
- Wondershare EdrawMax and draw.io are the main Visio alternatives on a Mac, because both run as native macOS desktop apps. Lucidchart also works in any Mac browser.
- Miro or Figma FigJam is a better choice than a structured diagrammer for live workshops, while formal process, network or architecture diagrams belong in a structured tool.
What Red Flags Should I Watch For When Evaluating Diagramming Software?
PlugRoute’s November 2026 evidence showed six red flags, each documented for at least one ranked diagramming tool. Most of them surface only after a team has bought seats or migrated its diagrams. Check every shortlisted tool against these warning signs before you sign an annual contract:
- Restrictive free-plan caps limit most free tiers to about 3 boards, files or documents.
- Seat creep and auto-renewal billing raise costs after purchase.
- Prices that conflict or are missing on vendor pages make budgets unreliable.
- High ratings from tiny review samples overstate how much confidence a rating deserves.
- Proprietary formats raise the cost of switching tools later.
- Performance limits on large diagrams appear only at real working scale.
Red Flag #1: Free Plans That Cap Editable Boards or Documents
Free diagramming plans can stall real team work within weeks. Miro, Figma FigJam and Mermaid Chart Basic cap free users at 3 boards, files or diagrams. Lucidchart’s free plan allows 3 documents of 75 shapes each (vendor pages, November 2026).
For example, a team running weekly retros, a roadmap and a process map fills all 3 Miro boards before its fourth workshop. draw.io’s free editor has no file cap.
Red Flag #2: Seat Creep and Auto-Renewal Billing
Billing surprises are a recurring Trustpilot complaint for several diagramming vendors, and they usually show up only after a team has committed to annual seats. Reviewers describe four patterns (Trustpilot, November 2026; Saascrmreview and Rework analyses, November 2026):
- Miro Trustpilot reviewers report unexpected charges and collaborators allegedly creating paid seats.
- Lucidchart Trustpilot reviewers report per-user price increases and a switch from monthly to annual billing.
- Wondershare EdrawMax reviewers report auto-renewal and refund problems.
- Figma FigJam buyers raised seat-billing complaints after Figma’s 2025 seat-type changes.
Some of these samples are small, such as Miro’s roughly 53 Trustpilot reviews, so read them as warning signs, not proof.
Red Flag #3: Prices You Cannot Verify on the Vendor’s Own Page
A price you find only on third-party comparison sites may be out of date. In November 2026, Wondershare EdrawMax was the only tool in this review whose own pages showed conflicting prices: $5.90 per month billed annually on one page and $99 per year on another. Always confirm the checkout price and billing basis directly.
Red Flag #4: High Ratings From Tiny Review Samples
A high rating from a small sample is weaker evidence than a slightly lower rating from thousands of reviewers. Figma FigJam’s 4.8/5 Capterra rating rests on 37 reviews, while Miro’s 4.7/5 Capterra rating rests on 1,707 (Capterra, November 2026). PlugRoute treats samples under 200 reviews as lower-confidence.
Red Flag #5: Proprietary Formats That Make Leaving Expensive
Diagrams in a proprietary format can be costly to migrate if you switch tools later. Microsoft Visio’s .vsdx is the de facto interchange standard, but some Lucidchart reviewers report imperfect .vsdx import. Before committing, check that a tool exports .vsdx, SVG, PDF or plain text such as Mermaid.
Red Flag #6: Performance Limits on Large Diagrams
Large-diagram performance problems usually surface only after a team has committed to a tool. Miro’s own documentation says performance degrades at about 1,000 objects, and community guides treat about 50 nodes as Mermaid’s readability limit on GitHub (Miro Help Center; GitHub community style guides, November 2026). Reviewers also report lag in Lucidchart, draw.io and Figma FigJam.
What Questions Should I Ask Before Choosing Diagramming Software?
Six questions narrow seven diagramming tools to one or two candidates, and the first is whether you need a new tool at all. Ask them in order, because each answer removes options before you compare features or prices. The six questions are:
- Does a tool I already pay for cover this job?
- Do I need a structured diagrammer, a whiteboard or diagrams-as-code?
- Where will my diagram files be stored, and do I need offline access?
- How will guests and occasional collaborators be billed?
- Which ecosystem must the tool integrate with?
- How large will my biggest diagrams get?
Question #1: Does a tool I already pay for (such as Visio in Microsoft 365) cover this job?
Many organizations already own a diagramming tool they don’t use. Microsoft Visio’s basic web version is included in eligible Microsoft 365 commercial plans (Microsoft, November 2026). Some practitioners use PowerPoint for simple diagrams (Reddit r/technicalwriting, 2019). Check your existing licenses before buying a new subscription.
Question #2: Do I need a structured diagrammer, a whiteboard or diagrams-as-code?
Your main diagramming job decides the category. For formal process, network or org charts, choose a structured diagrammer such as Lucidchart, draw.io, Microsoft Visio or Wondershare EdrawMax. For workshops, choose a whiteboard such as Miro or Figma FigJam. Choose Mermaid for diagrams that must stay versioned with code.
Question #3: Where will my diagram files be stored, and do I need offline access?
File storage and offline access vary widely between tools. draw.io stores files wherever you choose and works offline on desktop, and Mermaid stores text in your repository. Miro and Figma FigJam have no offline mode, and Lucidchart works mainly online. Ask each vendor for storage location and data-residency terms.
Question #4: How will guests and occasional collaborators be billed?
Seat rules decide what a team actually pays. Miro’s free plan allows unlimited collaborators, but Trustpilot reviewers report collaborators generating paid seats (Trustpilot, November 2026). Figma’s 2025 seat types also confuse buyers. Before inviting outside participants, ask each vendor exactly which roles count as paid seats.
Question #5: Which ecosystem (Microsoft 365, Google, Atlassian, Figma, GitHub) must it integrate with?
Integration fit often matters more than features. Lucidchart and Microsoft Visio suit Microsoft 365, and draw.io for Confluence shows about 60,000 installs (Atlassian Marketplace, November 2026). Figma FigJam connects to Figma Design, and Mermaid renders natively in GitHub and GitLab.
Question #6: How large will my biggest diagrams get?
Diagram size determines whether performance limits will affect you. Miro documents slowdowns at about 1,000 objects, and Mermaid becomes hard to read beyond about 50 nodes (Miro Help Center; GitHub community style guides, November 2026). Reviewers report lag on large diagrams in several other tools, so test your largest real diagram during any trial.
How Did We Rank These Diagramming Software Tools?
PlugRoute scored 7 diagramming tools from 1 to 5 on six published criteria and doubled the four primary criteria, for a maximum of 50 points. Evidence came from vendor documentation, review platforms and Reddit. It was collected and re-verified on November 5, 2026. PlugRoute did no hands-on performance testing, so the rankings reflect documented evidence, not lab results.
PlugRoute counts each primary criterion twice (×2) and each secondary criterion once (×1):
- Diagramming Capability and Job Fit (C1, primary, ×2) matters because a tool that can’t produce the diagram types your job needs fails regardless of its other strengths.
- Verified User Reputation (C2, primary, ×2) matters because independent ratings, weighted by review volume, are the strongest available evidence that a tool works in practice.
- Pricing Transparency and Free-Plan Value (C3, primary, ×2) matters because readers must compare caps and billing terms to avoid buying the wrong subscription.
- Collaboration and Ecosystem Integration (C4, primary, ×2) matters because teams need real-time co-editing and a fit with Microsoft 365, Google, Atlassian, Figma or GitHub.
- Data Control, Offline Access and Security (C5, secondary, ×1) matters because readers raised privacy, offline work and file location as explicit concerns.
- Scale, Platform Support and Documented Limitations (C6, secondary, ×1) matters because lag, missing macOS support and layout problems often surface only after purchase.
| Rank | Tool | C1 | C2 | C3 | C4 | C5 | C6 | Weighted Total |
|---|---|---|---|---|---|---|---|---|
| 1 | Lucidchart | 5 | 4 | 3 | 5 | 3 | 3 | 40 |
| 2 | draw.io | 4 | 4 | 5 | 3 | 5 | 3 | 40 |
| 3 | Microsoft Visio | 5 | 4 | 4 | 3 | 4 | 2 | 38 |
| 4 | Miro | 3 | 5 | 3 | 5 | 3 | 2 | 37 |
| 5 | Mermaid / Mermaid Chart | 3 | 2 | 5 | 4 | 4 | 2 | 34 |
| 6 | Figma FigJam | 2 | 3 | 4 | 4 | 3 | 2 | 31 |
| 7 | Wondershare EdrawMax | 4 | 3 | 2 | 2 | 3 | 3 | 28 |
PlugRoute applied these scoring rules and disclosures:
- PlugRoute breaks ties using the higher C1 score. That rule decided one tie: Lucidchart ranks above draw.io (both 40/50) because Lucidchart’s C1 score is 5 and draw.io’s is 4.
- PlugRoute raised Lucidchart’s C3 and C5 scores from 2 to 3 on November 5, 2026, after verifying Lucid’s published pricing and its SOC 2 Type II, ISO 27001:2022 and FedRAMP Moderate certifications.
- PlugRoute’s top spot depends on that change. If Lucidchart’s C5 had stayed at 2, draw.io would rank #1 at 40 against Lucidchart’s 39.
- PlugRoute scored Mermaid’s C2 at 2 because Mermaid Chart has only 10 reviews across Capterra and G2. With a C2 of 4, Mermaid would total 38 and tie Microsoft Visio, then rank #4 on the C1 tie-break (3 vs 5).
- PlugRoute treated ratings from fewer than 200 reviews as lower-confidence and used Trustpilot only as context.
- PlugRoute excluded IcePanel, SmartDraw, PlantUML, D2, Structurizr and dedicated BPM suites for lack of comparable evidence, so this ranking doesn’t cover the whole market.
In PlugRoute’s 2026 ranking, a tie-break separates the #1 and #2 diagramming tools, not points. Lucidchart leads on capability, and draw.io leads on price and control. Readers who don’t need live co-editing should treat the two as equal picks.
PlugRoute has no affiliate relationships with any company listed, and rankings are determined entirely by research data and objective evaluation criteria.
What Are the Most Common Questions About Choosing Diagramming Software?
The most common questions about choosing diagramming software are which free tool works for teams, whether Lucidchart is worth paying for over draw.io, and how PlugRoute builds its rankings. Each answer below leads with a direct recommendation drawn from the same November 2026 evidence as the ranked entries.
What is the best free diagramming software for teams in 2026?
draw.io is the best free diagramming software for teams in 2026. Its full web and desktop editor costs $0, with no account, watermark or editable-file cap (drawio.com, November 2026). draw.io shares files through storage such as Google Drive or Confluence. Miro’s free plan suits workshop teams, with unlimited collaborators but only 3 editable boards (Miro Help Center, November 2026).
Is draw.io good enough, or is Lucidchart worth paying for?
draw.io is good enough when one person builds diagrams and shares them through Google Drive, OneDrive or Confluence (drawio.com, November 2026). Lucidchart’s paid plans start at $9 per user per month, billed annually. They pay off when several people co-edit live or when diagrams must refresh from spreadsheets, SQL or cloud data (Lucid, November 2026). Both scored 40/50.
How does PlugRoute determine its diagramming software rankings?
PlugRoute ranks diagramming software with a published 50-point weighted score across six criteria, and the four primary criteria count double. Evidence comes from vendor documentation, review platforms and Reddit, collected in November 2026, with no hands-on testing. Ties go to the higher job-fit score, which placed Lucidchart (40/50) above draw.io (40/50).
What Do Key Diagramming Software Terms Mean?
Structured Diagrammer: A tool that builds formal diagrams such as flowcharts, org charts, network diagrams and process maps from standard shape libraries and notation standards. Pick this category when you need precise, standards-based documentation rather than freeform brainstorming.
Whiteboard: An infinite, freeform canvas built for team workshops, brainstorming, retrospectives and light flowcharts. Whiteboards are strong for live collaboration but are not designed for formal BPMN, network or engineering diagrams.
Diagrams-as-Code: An approach where diagrams are written as plain-text definitions and rendered automatically, so they can be stored in Git next to source code. Changes can be reviewed and versioned like code, but you give up pixel-level control over layout.
BPMN 2.0: Business Process Model and Notation, a standard notation for formal business process maps. Teams doing formal process mapping should check whether a tool supports it and which plan includes it.
P&ID: Piping and instrumentation diagrams, an engineering diagram type used in technical and industrial work. Only some structured tools support P&ID, often on a higher paid tier.
.vsdx: The Visio file format, widely used as the de facto standard for exchanging diagrams between tools. Strong .vsdx import and export lowers switching costs and lets non-Windows users share files with Visio-based teams, though import quality varies.
Data Linking: A feature that generates diagrams from sources such as spreadsheets, SQL or cloud environments and updates shapes when that data changes. For example, an org chart built from an HR spreadsheet can refresh by itself instead of being redrawn by hand.
Free-Plan Cap: The limit a free tier places on usage, often around 3 editable boards, files, documents or diagrams, or watermarked exports. Caps decide how quickly a team has to upgrade, so compare them before you commit work to a free plan.
Per-Seat Billing: Pricing charged per user, member or editor, usually per month and often billed annually only. Buyers should ask which roles count as paid seats, because invited collaborators can drive up costs without anyone noticing.
Perpetual License: A one-time purchase instead of an ongoing subscription. It can cost less over time, but it may not include ongoing feature updates, or it may limit upgrades and cloud access to a set period.
AI Credits or Tokens: Usage allowances that cap how much a plan’s AI features can generate or analyze. Allowances differ by vendor and tier, so heavy AI users should check the quota before buying.
SOC 2 Type II and ISO 27001: Third-party security certifications that buyers’ security reviewers use to judge a vendor’s controls. Ask which deployment or plan a certification actually covers, because coverage can vary or be inherited from a parent platform.
FedRAMP Moderate: A US government security authorization level needed for many government and regulated buyers. It may apply only to a specific government offering, not to every plan.
Which Diagramming Software Tool Is Right for You?
Key Insights
- Lucidchart ranks #1 in PlugRoute’s 2026 diagramming ranking, winning a 40/50 tie-break with draw.io by pairing top diagramming capability with the strongest collaboration evidence.
- draw.io is the best free diagramming tool in 2026, scoring 40/50 with a $0 editor, offline desktop apps and user-controlled storage.
- Microsoft Visio is the strongest choice for Microsoft 365 organizations, and its basic web version is included in eligible commercial plans.
- Miro has the largest review base in the category (4.6/5 across 13,780 G2 reviews) and suits workshop-driven diagramming.
- Mermaid keeps software architecture diagrams in sync with code, but it trades away layout control, and Mermaid Chart has only 10 platform reviews.
- Figma FigJam offers the lowest published paid seat at $3 per editor per month, and Wondershare EdrawMax offers a perpetual license for Mac and Linux users.
Many teams combine tools instead of forcing one to do everything. A common pattern is to brainstorm in Miro or Figma FigJam, formalize the result in Lucidchart, draw.io or Microsoft Visio, and version technical diagrams in Mermaid alongside code.
Pricing, free-plan caps and AI features in this category change often, so recheck each vendor’s current terms before you sign. For more comparisons, read PlugRoute’s full scoring methodology and other independent PlugRoute software reviews. We update this guide quarterly. Last updated: November 5, 2026.