Last updated: November 2026 · Prices and ratings verified November 2026
The best content analytics software in 2026 is Contentsquare for measuring which on-page content elements drive engagement and revenue, Matomo for privacy-first analytics you fully own, and Hotjar for affordable heatmaps paired with reader surveys. “Content analytics” covers five different measurement jobs, so no single tool fits every team.
Generic traffic tools show page views. They do not show what readers do inside an article or which authors and topics perform best. Buyers also mistake SEO research suites for on-site measurement, and quote-only pricing makes it hard to compare costs side by side.
As one user on r/marketing described:
“I’ve been tearing my hair out for the last couple of months trying to get an idea of how many sales we’re getting from each channel and the CPAs but I can’t get to any number that I actually trust! Is anyone else in a similar situation or is it just me?” Posted by u/mahow
Takeaway: Marketers using general-purpose analytics often can’t trust their numbers enough to tie content and channels to sales, which is why matching a tool to a specific measurement job matters.
PlugRoute has no affiliate relationships with any company listed. Rankings are determined entirely by research data and objective evaluation criteria.
Only 48% of enterprise marketers say they measure content effectively (Content Marketing Institute, 2025). This guide sorts seven tools by the job each one does, scores them on six published criteria, and states what each tool does not measure.
What Are the 5 Categories of Content Analytics Tools?
Content analytics tools fall into five categories, each built for a different measurement job: Behavioral Analyzers (Contentsquare, Hotjar), Editorial Intelligence (Chartbeat, Parse.ly), Privacy-First Measurers (Matomo), Revenue Attributors (Dreamdata) and Search & Competitive Researchers (Semrush). Each category does one job well and has a blind spot that another category covers.
Here is what each category does and does not do:
- Behavioral Analyzers such as heatmap software measure clicks, scroll depth, session replay and element-level exposure on your pages. Behavioral Analyzers do not report author, section or tag performance.
- Editorial Intelligence platforms measure engaged time and attention time by article, author, section and tag, often in real time. Editorial Intelligence platforms do not provide full B2B revenue attribution.
- Privacy-First Measurers provide unsampled, first-party traffic and conversion data that you control. Privacy-First Measurers do not offer native editorial content intelligence.
- Revenue Attributors tie content touches to accounts, CRM pipeline and closed revenue. Revenue Attributors do not provide real-time or editorial signals.
- Search & Competitive Researchers analyze topics, competitors and search or AI-answer visibility. Search & Competitive Researchers cannot measure engagement on your own site.
| Category | Tools in This Ranking | What It Measures | What It Does NOT Measure |
|---|---|---|---|
| Behavioral Analyzer | Contentsquare, Hotjar | Page and element behavior, journeys, reader feedback | Author, topic and section performance |
| Editorial Intelligence | Chartbeat, Parse.ly | Engaged time by article, author, section, tag | Full B2B revenue attribution |
| Privacy-First Measurer | Matomo | Unsampled first-party traffic and conversions | Native editorial intelligence |
| Revenue Attributor | Dreamdata | Account journeys tied to pipeline and revenue | Real-time or editorial signals |
| Search & Competitive Researcher | Semrush | Search visibility, keyword gaps, AI-answer visibility | Behavior on your own site |
Semrush tells you what to write. Contentsquare and Hotjar show how readers behave on the page, Chartbeat and Parse.ly show how each story performs, Matomo keeps the data yours, and Dreamdata shows what the content earned.
Is Free Content Analytics Software Enough?
Free content analytics software is enough for basic traffic, search and page-behavior questions. It is not enough for author-level editorial insight, element-level revenue measurement or B2B attribution. PlugRoute treats GA4, Microsoft Clarity and Google Search Console as an unranked baseline because they were not scored on the same six criteria as the ranked tools.
Here is what each free baseline tool does and where it stops:
- Google Analytics 4 (GA4) reports page views and acquisition, but GA4 does not show what readers do inside an article or which authors and topics perform best.
- Microsoft Clarity offers free heatmaps and session recordings, but Microsoft Clarity has no comparable built-in surveys (SoftwareCompare, 2026).
- Google Search Console is Google’s free search performance tool. PlugRoute’s research did not profile Google Search Console, so this guide gives no ratings or figures for it.
Many teams keep GA4 for acquisition reporting and add specialist tools for content-level questions (PlugRoute analysis of comparison sources, 2026).
Three ranked tools also have free tiers:
- Matomo On-Premise is free, open-source and self-hosted.
- Contentsquare Free covers up to 200,000 sessions per month, and Hotjar customers use the same plan.
- Dreamdata Free includes B2B web analytics for up to 5 seats with 2 months of history.
On-site analytics tools, free and paid, share one blind spot: they cannot see how often your content appears inside AI answers. Semrush’s AI visibility tracking is the only partial answer in this ranking. On-site analytics can only measure the visitors who click, and with AI answers, more readers never click through at all.
These dated figures show how large the shift is:
- Chartbeat data cited by the Reuters Institute showed Google organic referrals to 2,576 publisher sites falling 33% globally and 38% in the US between November 2024 and November 2025 (Search Engine Land, 2026).
- The same Chartbeat data showed sites with under 10,000 daily pageviews losing about 60% of that traffic over two years, compared with about 22% for large publishers (Technology.org, 2026).
- Pew Research Center found that users clicked a traditional result on 8% of searches showing an AI Overview, versus 15% without one (Pew Research Center, 2025).
- Similarweb found that zero-click rates for Google news-related searches rose from 56% to 69% between May 2024 and May 2025 (Similarweb, 2025).
How Do the Top Content Analytics Tools Compare at a Glance?
Contentsquare leads PlugRoute’s overall ranking with 35.0 of 45 points, followed by Matomo at 32.5 and Hotjar at 32.0. Only 6.5 points separate first from seventh, so match the Category column to your measurement job before you look at rank. The overall rank reflects the strength of the evidence, but fit with your measurement job should decide what you buy.
| Rank | Company | Category | Best For | One-Line Summary | Key Capabilities | Primary Strength | Key Limitation |
|---|---|---|---|---|---|---|---|
| 1 (35.0/45) | Contentsquare | Behavioral Analyzer | Mid-size and enterprise content and UX teams | Contentsquare shows which specific page elements drive engagement, conversion and revenue. | Zone-based heatmaps, replay, journeys, A/B testing | Element-level revenue measurement | Steep learning curve; needs developer help |
| 2 (32.5/45) | Matomo | Privacy-First Measurer | Privacy-regulated and technical small teams | Matomo provides unsampled, fully owned analytics, free to self-host or as managed cloud. | Self-hosting, no sampling, CNIL configuration | Data ownership and published pricing | No native editorial intelligence |
| 3 (32.0/45) | Hotjar | Behavioral Analyzer | Small teams needing heatmaps plus surveys | Hotjar pairs heatmaps and recordings with on-page surveys for small teams. | Heatmaps, recordings, surveys, AI summaries | Fast setup; shows both what and why | Session caps; no author or topic views |
| 4 (30.5/45) | Dreamdata | Revenue Attributor | B2B teams proving pipeline impact | Dreamdata connects content touches to accounts, pipeline and closed revenue. | Multi-touch attribution, CRM sync, warehouse export | Content-to-revenue linkage | Quote-only paid tier; 4–8 week ramp |
| 5 (29.5/45) | Chartbeat | Editorial Intelligence | High-traffic newsrooms | Chartbeat shows newsrooms live reader attention and tests headlines in real time. | Real-time dashboard, Heads Up Display, headline testing | Minute-by-minute editorial signals | No public pricing; aimed at 5M+ pageviews |
| 6 (29.0/45) | Semrush | Search & Competitive Researcher | SEO-led content planning | Semrush helps teams choose topics and track AI-answer visibility but does not measure their own site. | Keyword research, content toolkit, AI visibility | Largest review base; public pricing | Modeled traffic, not first-party |
| 7 (28.5/45) | Parse.ly | Editorial Intelligence | Publishers needing author, section and tag analytics | Parse.ly measures engaged time by article, author, section and tag with raw data access. | Heartbeat engaged time, data pipeline, WordPress editor tools | Deepest editorial taxonomy in this ranking | No list price; thin review evidence |
Quick Decision Framework
| Your #1 Priority | Recommended Tool | Why | Acceptable Alternative |
|---|---|---|---|
| See which page elements drive revenue | Contentsquare | Zone-based metrics include revenue for each element | Hotjar (page-level only) |
| Privacy compliance or owning your data | Matomo | Unsampled, self-hostable, documented CNIL configuration | Matomo Cloud from about €29/month (if you cannot self-host) |
| Small team wanting heatmaps plus surveys | Hotjar | Behavior data and reader feedback in one script | Microsoft Clarity (no built-in surveys) |
| Proving B2B pipeline impact | Dreamdata | Account-based attribution synced with your CRM | Parse.ly Content Value tier (lighter conversions) |
| Live headline and homepage decisions | Chartbeat | Real-time attention data and headline testing | Parse.ly |
| Choosing topics and tracking AI search visibility | Semrush | Competitor research and AI-answer tracking | None ranked here (Ahrefs, not evaluated in this ranking, is a common alternative) |
| Author, section and tag analytics with raw data | Parse.ly | Heartbeat engaged time and a warehouse pipeline | Chartbeat |
| $0 budget | GA4 + Microsoft Clarity + Google Search Console | Covers traffic, page behavior and search basics | Matomo self-hosted (if you have technical staff) |
Pick the tool that matches your top measurement priority: Contentsquare for element-level revenue proof, Matomo for data ownership, Hotjar for heatmaps plus surveys, Dreamdata for B2B pipeline attribution, Chartbeat for live newsroom decisions, Semrush for topic research and Parse.ly for author and tag analytics.
What Are the 7 Best Content Analytics Tools, Ranked?
The seven best content analytics tools for 2026 are Contentsquare, Matomo, Hotjar, Dreamdata, Chartbeat, Semrush and Parse.ly, in that order, based on PlugRoute’s six weighted criteria. Chartbeat and Parse.ly rank lower mainly because they publish no pricing and have thin public evidence, so newsrooms should still shortlist both.
1. Contentsquare: Best Overall for Measuring Which Content Drives Engagement and Revenue
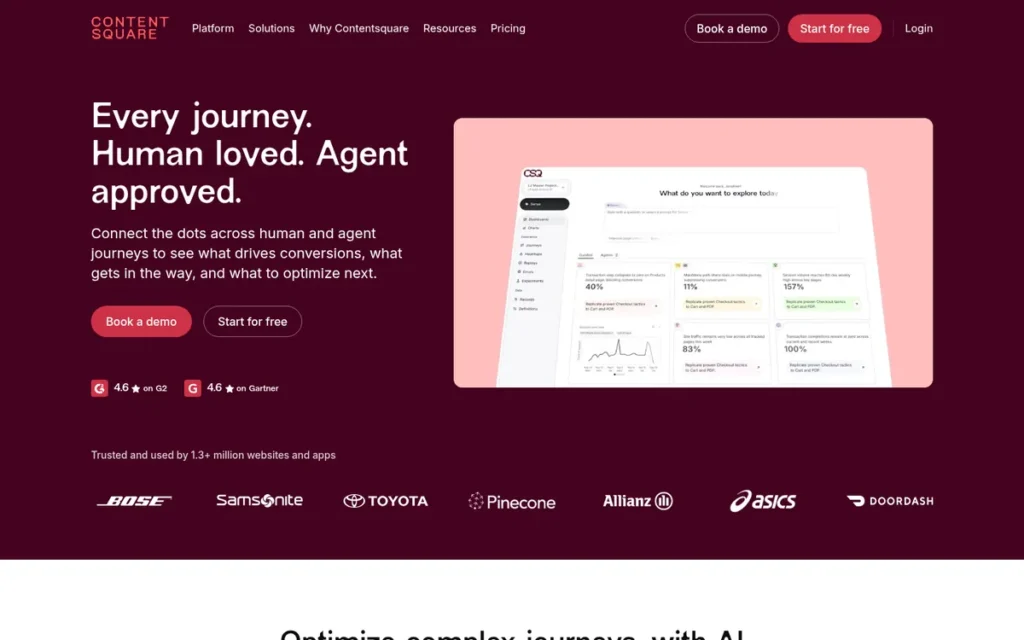
Category: Behavioral Analyzer, measures how visitors interact with page content through heatmaps, session replays and journeys.
PlugRoute Score: 35.0/45 (C1 4 · C2 4.5 · C3 4 · C4 4 · C5 2 · C6 4). Why #1: Contentsquare is the only tool that scored 4 or higher on all three double-weighted criteria; it lost the most points on implementation effort.
At a Glance
- Category: Behavioral Analyzer
- Best For: Mid-sized and enterprise marketing, UX and content teams that need element-level evidence of which content blocks drive engagement and revenue.
- Price Range: Free (up to 200K sessions/month); Growth from $39–$49/month (billing term and region vary); Pro and Enterprise by quote.
- Primary Strength: Contentsquare measures exposure, clicks, conversion and revenue for each page element, the most granular on-page content measurement in this ranking.
- Biggest Limitation: Contentsquare has a steep learning curve, and page mapping often requires significant coordination with a development team.
- One-Line Summary: Contentsquare is an enterprise experience analytics platform that shows which specific page elements and content blocks drive engagement, conversion and revenue, with a free tier for testing.
- Last Verified: November 2026
Overview
Contentsquare is an enterprise digital experience analytics platform that measures how visitors interact with individual page elements and content blocks, built for marketing, UX and content teams at mid-sized and large organizations that need to know which sections drive engagement and revenue.
Contentsquare does not measure editorial taxonomy such as author, section or tag performance, and Contentsquare does not track off-site search visibility. Page-level tools tell you an article converted. Contentsquare’s zone-based metrics can show whether visitors saw and clicked the inline product block or the end-of-article CTA before converting.
Contentsquare was founded in Paris in 2012 and has owned Hotjar, #3 in this ranking, since 2021 (Contentsquare, 2021).
Key Features
- Contentsquare zone-based heatmaps report exposure rate, attractiveness rate, clicks, conversion and revenue for each page element.
- Contentsquare session replay and journey analysis show the paths visitors take across pages and where they drop off.
- Contentsquare includes product analytics from its 2023 Heap acquisition, along with voice-of-customer tools and error and performance monitoring.
- Contentsquare offers A/B testing on Pro and higher tiers, and Sense AI insights on Growth and higher tiers.
- Contentsquare’s Free plan covers up to 200,000 sessions per month, with one project and one month of data retention.
Best For
Contentsquare is best for mid-sized and enterprise teams that need to prove which on-page content elements contribute to conversion and revenue, and that have developer support for implementation.
Pricing
Contentsquare pricing was verified in November 2026 from two sources that disagree on the Growth price (Contentsquare, 2026; G2, 2026):
- Contentsquare Free costs $0 for up to 200,000 sessions per month, one project and one month of data.
- Contentsquare Growth starts at about $39–$49 per month depending on billing term and region, with three projects, 13 months of data and about 7,000 to 10 million sessions per month.
- Contentsquare Pro has no public price, and Contentsquare Enterprise is quoted based on session volume, modules and data retention.
Contentsquare Free and Growth are the same plans Hotjar customers buy, because Hotjar became part of the Contentsquare Group on July 1, 2025 (Contentsquare, 2025).
Strengths
- Contentsquare holds a 4.6/5 rating from 747 G2 reviews as of November 2026, the highest-volume G2 rating above 4.5 in this ranking (G2, 2026).
- Contentsquare reports that L’Occitane increased mobile conversion by 25% (Contentsquare, 2024), and an AWS partner case study on the same project reports a 15% overall conversion lift (AWS, 2026).
- Contentsquare had more than 1,300 enterprise customers as of its 2024 press kit and has raised over $1.4B, including a 2022 round at a $5.6B valuation (Contentsquare, 2024; Contentsquare, 2022).
- Contentsquare is one of three ranked tools, alongside Matomo and Hotjar, that publish both a free tier and a public paid tier (PlugRoute analysis, 2026).
Limitations
Contentsquare’s analytical depth comes at the cost of easy setup. G2 reviewers report that page mapping required “significant coordination with the development team,” which small teams without developers may struggle to provide (G2, 2026).
- G2 reviewers describe Contentsquare as “pricey” with a steep learning curve, Contentsquare Pro and Enterprise pricing is quote-only, and sources disagree on whether Growth costs $39 or $49 (G2, 2026).
- G2 reviewers describe Contentsquare report exports as clunky and say Contentsquare replays can lag on long pages (G2, 2026).
- Contentsquare offers no author, section or tag rollups, so editorial teams using Contentsquare still need a dedicated editorial tool.
Users on r/analytics noted:
“The implementation needs to be stellar for it to be useful, or else your user journeys will be wildly noisy with bad data, bots, internal sessions. Best used on ecommerce sites where it can find predictable friction points in web visits that may go undetected.” Posted by u/The_Paleking
Takeaway: Contentsquare finds friction points well, but only after a careful implementation; a weak setup fills its journey data with bots and internal noise.
Verdict
Contentsquare is the strongest all-round content analytics choice in this ranking for teams that need element-level proof of which on-page content drives revenue, backed by a 4.6/5 G2 rating across 747 reviews as of November 2026.
The Contentsquare Free and Growth tiers let small teams test before committing, but enterprise depth requires developer time and quote-based pricing. Skip Contentsquare if you lack developer support or only need author-level editorial reporting.
2. Matomo: Best Privacy-First and Best Free Self-Hosted Content Analytics
Category: Privacy-First Measurer, first-party, unsampled traffic and conversion analytics that you can host and control yourself.
PlugRoute Score: 32.5/45 (C1 3 · C2 3 · C3 5 · C4 3 · C5 2.5 · C6 5). Why #2: Matomo earned the only perfect scores for pricing transparency and data trust, but its content-level depth depends on paid bundles; it leads Hotjar by 0.5 points.
At a Glance
- Category: Privacy-First Measurer
- Best For: Privacy-regulated organizations, public-sector and EU-based teams, and budget-limited small businesses with the technical capacity to self-host.
- Price Range: Free (self-hosted core); Cloud from about €29/month (50K hits); On-Premise premium bundles from €230/month billed annually.
- Primary Strength: Matomo gives organizations full ownership of unsampled first-party analytics data, either self-hosted for free or in a managed cloud.
- Biggest Limitation: Matomo has no native editorial content intelligence, and self-hosting at scale requires ongoing database tuning, upgrades and security work.
- One-Line Summary: Matomo is a privacy-first, open-source analytics platform that gives organizations unsampled, fully owned traffic and conversion data, free to self-host or available as a managed cloud service.
- Last Verified: November 2026
Overview
Matomo is a privacy-first, open-source web analytics platform and Google Analytics alternative that provides unsampled first-party traffic and conversion data under the customer’s full control, built for privacy-regulated organizations and budget-conscious teams that want to own their data.
Matomo does not natively provide editorial intelligence, such as engaged-time rollups by author, section or tag. Matomo heatmaps and session recordings require paid premium bundles.
Matomo’s open-source model lets organizations inspect the code and add community plugins, while self-hosters carry the security and upgrade work themselves (Matomo, 2026).
Key Features
- Matomo On-Premise is free open-source software that organizations can host on their own infrastructure.
- Matomo does not sample data, and Matomo states that it does not pool or reuse customer data (Matomo, 2026).
- Matomo can be configured to qualify for France’s CNIL consent exemption, which excludes user IDs, cross-domain tracking, A/B testing, heatmaps and session recordings (Matomo, 2026).
- Matomo premium bundles add heatmaps and session recording, media analytics, funnels, form analytics, custom reports and multi-channel attribution.
- Matomo offers a separate Content Optimization Bundle for content-specific analysis.
Best For
Matomo is best for organizations under strict privacy rules, and for small businesses with in-house technical skills that want free, fully owned analytics without data sampling.
Pricing
Matomo pricing, verified November 2026 (Matomo, 2026):
- Matomo On-Premise core software is free.
- Matomo Cloud starts at about €29 per month for 50,000 hits, with published hit-metered tiers up to 10 million hits.
- Matomo On-Premise premium bundles cost €230 (Team), €1,209 (Business) and €2,834 (Enterprise) per month billed annually, or about €275, €1,450 and €3,400 month-to-month.
Matomo bundle prices are quoted in euros in current sources, so confirm currency and billing basis at checkout.
Strengths
- Matomo holds a 4.7/5 rating from 62 Capterra reviews (value 4.7, ease of use 4.5) and 4.2/5 from about 97 G2 reviews as of November 2026 (Capterra, 2026; G2, 2026).
- Matomo publishes complete Cloud and On-Premise bundle pricing and offers a free self-hosted core, the most transparent pricing in this ranking.
- Matomo reports use on more than 1.4 million websites in 190+ countries on G2, and Capterra lists 1.5 million or more; both are vendor figures (G2, 2026; Capterra, 2026).
- Matomo documents a CNIL consent-exemption configuration and says it holds ISO 27001 certification, which is a vendor claim (Matomo, 2026).
Limitations
With Matomo, you get control at the cost of convenience. Self-hosting Matomo at scale requires database tuning, upgrades and security maintenance, which small teams have to staff and budget for themselves.
- G2 reviewers report that Matomo is slow on large datasets, and Matomo’s paid plugins add up quickly (G2, 2026).
- Matomo’s interface is described as dated, and Matomo lacks editorial content intelligence, according to Plausible, a competing vendor (Plausible, 2026).
- Matomo’s consent exemption excludes heatmaps and session recordings, so a French publisher running Matomo without a consent banner cannot also record those visitors’ sessions.
Verdict
Matomo is the best content analytics option in this ranking for privacy-regulated organizations and technically capable small teams, offering free self-hosted, unsampled analytics with fully published pricing as of November 2026.
Budget for hosting and maintenance, or for Matomo Cloud from about €29 per month, and check which features break the consent exemption. Skip Matomo if you need author or section reporting and do not plan to add an editorial tool.
3. Hotjar (by Contentsquare): Best for Small Teams That Need Heatmaps Plus On-Page Surveys
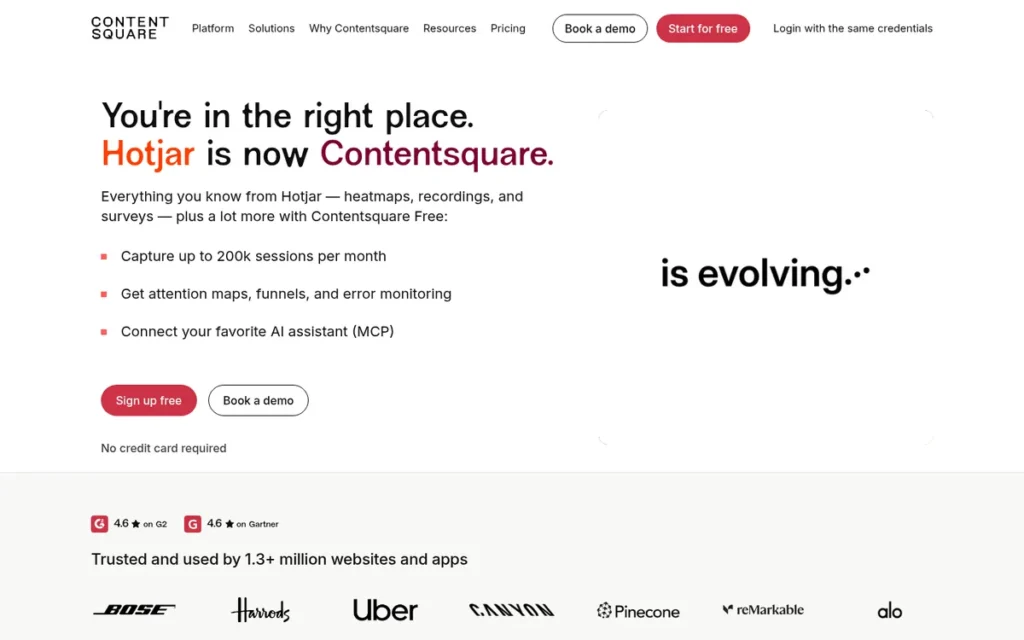
Category: Behavioral Analyzer.
PlugRoute Score: 32.0/45 (C1 3 · C2 3.5 · C3 4 · C4 3 · C5 5 · C6 3). Why #3: Hotjar earned the only perfect implementation score in this ranking; it lost points on content depth and session caps.
At a Glance
- Category: Behavioral Analyzer
- Best For: Small and mid-sized marketing and content teams that want heatmaps and recordings plus on-page surveys asking readers why they behave as they do.
- Price Range: Free (up to 200K sessions/month); Growth from about $39–$49/month, scaling with sessions (sold as Contentsquare plans since July 2025).
- Primary Strength: Hotjar combines heatmaps and session recordings with built-in surveys, so teams can see both what readers do and why.
- Biggest Limitation: Hotjar does not report performance by author, topic or section without custom configuration, and data may be sampled or stop once sessions exceed the plan allowance.
- One-Line Summary: Hotjar is a behavioral analytics tool owned by Contentsquare that pairs heatmaps and session recordings with on-page surveys, giving small teams an affordable way to see what readers do and ask them why.
- Last Verified: November 2026
Overview
Hotjar is a behavioral analytics and user feedback tool, owned by Contentsquare since 2021, that combines heatmap software, session recordings and on-page surveys, built for small and mid-sized marketing and content teams that want to understand how readers interact with pages.
Hotjar does not measure editorial performance by author or topic, and Hotjar does not measure revenue.
Hotjar became part of the Contentsquare Group on July 1, 2025, and Hotjar plans are now sold as Contentsquare Free and Growth plans (Contentsquare, 2025).
Key Features
- Hotjar Observe provides heatmaps, session recordings, funnels and trends that show how visitors move through pages.
- Hotjar scroll maps show content teams whether readers reach key article sections and calls to action.
- Hotjar Ask provides surveys and feedback widgets that collect reader explanations directly on the page.
- Hotjar Engage supports recruiting and running user interviews.
- Hotjar generates AI summaries of session recordings and feedback responses.
Best For
Hotjar is best for small marketing and content teams that want behavior data and reader feedback in one easy-to-install tool without enterprise complexity.
Pricing
Hotjar pricing, verified November 2026, follows Contentsquare’s plans because hotjar.com/pricing now redirects to Contentsquare (Contentsquare, 2025):
- Hotjar’s Free plan covers up to 200,000 sessions per month, one month of data and one project (Toolradar, 2026).
- Hotjar Growth starts at about $39 per month billed annually or $49 per month billed monthly at 7,000 sessions (Toolradar, 2026; Capterra, 2026).
- Hotjar Growth scales with sessions to about $739 per month at 200,000 sessions, according to third-party pricing analyses (Humblytics, 2026).
Confirm current Hotjar terms on contentsquare.com/pricing before buying.
Strengths
- Hotjar holds a 4.6/5 rating from about 545 Capterra reviews and 4.3/5 from 345 G2 reviews as of November 2026 (Capterra, 2026; G2, 2026).
- Hotjar’s built-in surveys are its main differentiator, because Microsoft Clarity offers free heatmaps and recordings but no comparable surveys (SoftwareCompare, 2026).
- Hotjar scored 5/5 on implementation effort in PlugRoute’s scoring, the only perfect C5 score in this ranking, because Hotjar installs by script and delivers data the same day.
- Hotjar and Contentsquare together reached nearly 1 million websites in 180+ countries when the acquisition was announced (Contentsquare, 2021).
Limitations
Hotjar’s low cost and simplicity come at the cost of complete data. Once sessions exceed the Hotjar plan allowance, data may be sampled or collection may stop, which makes recordings and funnels less representative (UX Crush, 2026).
- G2 reviewers describe Hotjar recording caps as restrictive and also report a learning curve and slow loading (G2, 2026).
- Hotjar holds a 1.6/5 Trustpilot rating, driven by complaints about price increases, billing and support (Trustpilot, 2026).
- Hotjar Growth pricing scales steeply with sessions, and a dated community thread flagged the page-speed cost of Hotjar’s tracking script (Reddit r/AskMarketing, 2020).
This aligns with community sentiment on r/marketing:
“If GA’s been set up properly I would stick with that as your source of “truth”. I wouldn’t use Hotjar to analyze stats & numbers, but mores to gain a better sense of how users are behaving on the site (e.g. through click maps, scroll maps, and recordings).” Posted by u/ethanethier
Takeaway: Hotjar works best for understanding behavior through click maps, scroll maps and recordings, not as a source of truth for session counts, which still belongs to a properly configured GA4.
Verdict
Hotjar is the most accessible behavioral analytics tool in this ranking for small content teams that want heatmaps and reader surveys in one place, holding a 4.6/5 Capterra rating across roughly 545 reviews as of November 2026.
Watch Hotjar’s session caps and billing terms closely, and confirm current pricing on Contentsquare’s plan pages. Skip Hotjar if you do not need surveys, because free tools such as Microsoft Clarity cover heatmaps and recordings.
4. Dreamdata: Best for B2B Teams Proving Content’s Impact on Pipeline and Revenue
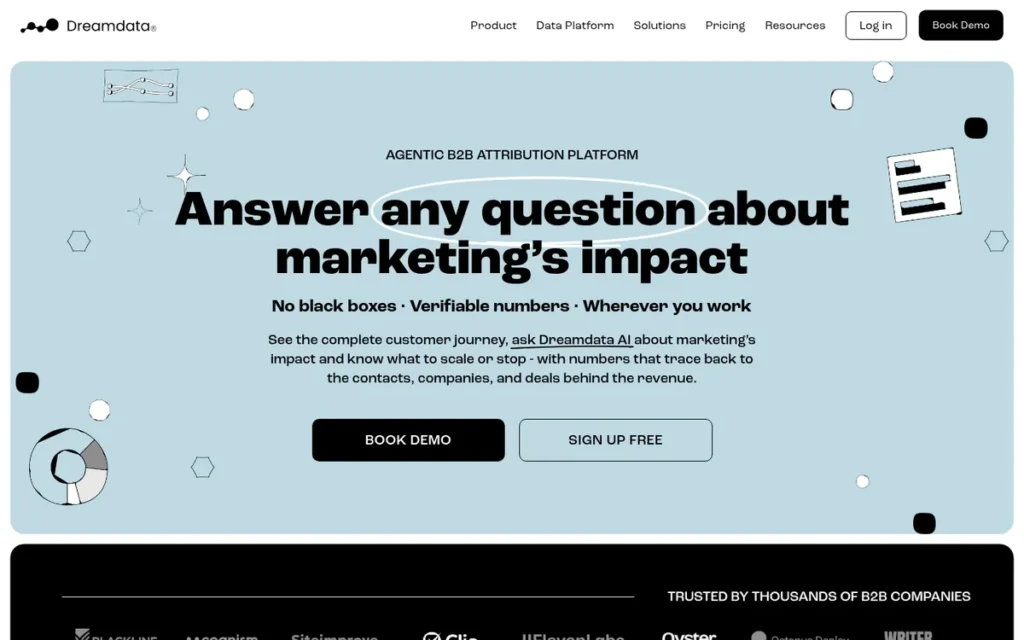
Category: Revenue Attributor, connects content and marketing touchpoints to accounts, pipeline and closed revenue.
PlugRoute Score: 30.5/45 (C1 4 · C2 4.5 · C3 2.5 · C4 2.5 · C5 2 · C6 4). Why #4: Dreamdata tied Contentsquare on review evidence, but quote-only paid pricing and developer-dependent setup cost it points.
At a Glance
- Category: Revenue Attributor
- Best For: B2B marketing teams with clean CRM data and enough deal volume that need to prove content’s influence on pipeline and closed-won revenue.
- Price Range: Free tier (5 seats, 2 months of history); paid Attribution plans by quote.
- Primary Strength: Dreamdata links content and marketing touchpoints to accounts, pipeline and closed revenue through account-based multi-touch attribution.
- Biggest Limitation: Dreamdata needs developer-assisted setup and clean CRM data, and reportedly takes 4–8 weeks before attribution data becomes useful.
- One-Line Summary: Dreamdata is a B2B revenue attribution platform that connects content touches to accounts, pipeline and closed revenue, rated 4.7/5 across 279 G2 reviews as of November 2026.
- Last Verified: November 2026
Overview
Dreamdata is a B2B revenue attribution platform that connects content and marketing touchpoints to accounts, pipeline and closed revenue, built for B2B marketing teams that need to prove content ROI and pipeline influence rather than just traffic.
Dreamdata does not provide real-time editorial signals or author and section analytics. Dreamdata also needs enough deal volume to produce useful attribution.
Dreamdata started as a three-person Copenhagen office and reports raising $55M in Series B funding (Dreamdata, 2026).
Key Features
- Dreamdata provides multi-touch attribution, content attribution reports and account-based customer journeys.
- Dreamdata integrates with HubSpot, Salesforce, Google Ads and LinkedIn Ads to connect marketing touches with CRM stages.
- Dreamdata combines anonymous website visits and ad impressions with CRM data at the account level.
- Dreamdata exports data to BigQuery or Snowflake for warehouse-based analysis.
- Dreamdata’s free tier includes B2B web analytics, cookie and cookieless tracking, and engagement scoring.
Best For
Dreamdata is best for B2B marketing teams that already run HubSpot or Salesforce, have consistent deal volume, and are under pressure to show content’s contribution to revenue.
Pricing
Dreamdata pricing, verified November 2026 (G2, 2026):
- Dreamdata Free costs $0 and includes up to 5 seats, 2 months of history, 3 stage models and 1 sync.
- Dreamdata’s paid Attribution tier is quote-based, and dollar amounts for other Dreamdata tiers could not be verified.
- Dreamdata reviewers report a large price jump from free to paid, possible implementation fees and annual contracts (Software Finder, 2026; Usermaven, 2026).
Ask Dreamdata for a written quote that includes implementation costs.
Strengths
- Dreamdata holds a 4.7/5 rating from 279 G2 reviews and 4.8/5 from 56 Capterra reviews as of November 2026, the highest average B2B rating in this ranking (G2, 2026; Capterra, 2026).
- Dreamdata is the only product in this ranking built primarily to link content touches to CRM pipeline and revenue, a problem 56% of B2B marketers report (Content Marketing Institute, 2025). Parse.ly and Matomo offer lighter attribution features.
- Dreamdata publishes B2B go-to-market benchmarks covering 414 companies, using vendor-reported data from Dreamdata’s customer network (Dreamdata, 2026).
- Dreamdata onboarding with HubSpot, Salesforce and ad platforms “worked smoothly,” according to one G2 reviewer (G2, 2026).
Limitations
Dreamdata’s revenue-level insight comes at the cost of fast setup. Software Advice reviewers say Dreamdata setup needs developer help. Sona, a competing vendor, reports that Dreamdata takes 4–8 weeks to produce useful attribution data (Software Advice, 2026; Sona, 2026).
- Dreamdata users must upload data by spreadsheet for ad platforms that lack an API (Software Advice, 2026).
- G2 reviewers cite a steep Dreamdata learning curve, too many reports to navigate, and thin funnel and comparison reporting (G2, 2026).
- Dreamdata has no editorial or real-time view, and low-volume Dreamdata accounts may not generate enough deal data for reliable attribution.
Users on r/marketing noted:
“For starters, you will never arrive at the truth of your total sales through the lens of digital analytics. It simply isn’t possible in the modern multi-device, cookie compliance era, where you expect some combination of self-service online journeys combined with sales rep prompted buying experiences. So once you onboard that fact and let that seep deep into your bones, then the project of analytics is not about making things correct, it’s about getting enough of a general sense that gives you information to drive the business forward.” Posted by u/Psyched_to_Learn
Takeaway: Experienced marketers treat digital attribution as directional rather than exact, and that limit applies to any attribution platform, Dreamdata included.
Verdict
Dreamdata is the only attribution-first platform in this ranking and the best fit for B2B teams that must prove content’s influence on pipeline and revenue, with a 4.7/5 G2 rating across 279 reviews as of November 2026.
Success with Dreamdata depends on clean CRM data, deal volume and developer time, so start on the free tier to check data quality. Skip Dreamdata if you run a low-volume site or need content-level engagement rather than revenue attribution.
5. Chartbeat: Best for Newsrooms Making Real-Time Headline and Homepage Decisions
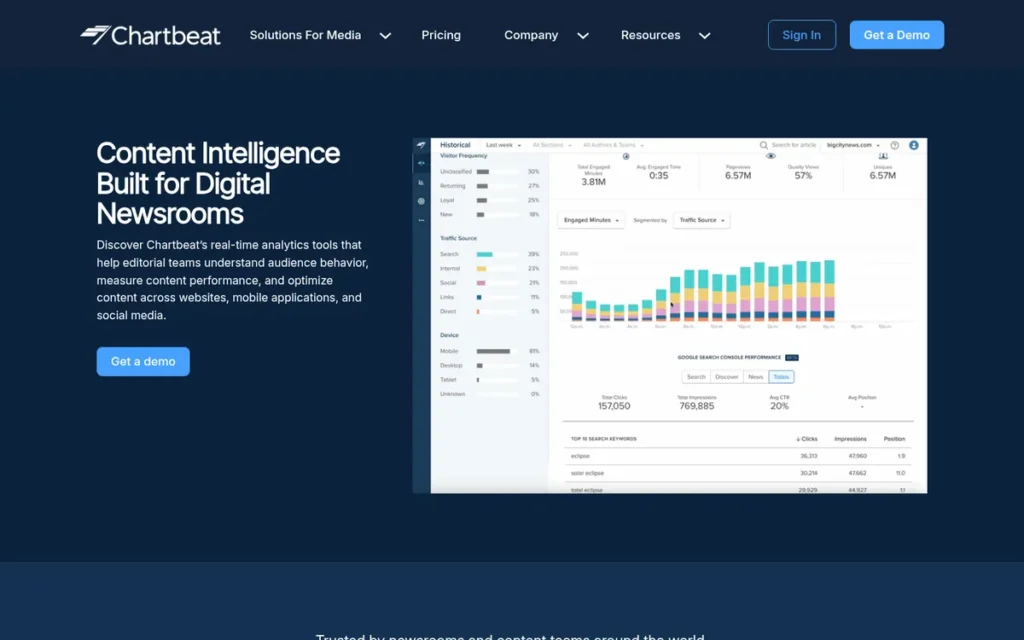
Category: Editorial Intelligence, article-level engagement analytics that guide publishing and editorial decisions.
PlugRoute Score: 29.5/45 (C1 5 · C2 3.5 · C3 1 · C4 3.5 · C5 3 · C6 4). Why #5: Chartbeat tied for the top content-depth score, but its pricing-transparency score of 1, double-weighted, cost it 8 points against a perfect score.
At a Glance
- Category: Editorial Intelligence
- Best For: Newsrooms and digital publishers with roughly 5M+ monthly pageviews that make live headline, homepage and story-placement decisions.
- Price Range: Pricing on request (pageview-based Basic, Plus, Premium and custom tiers; free trial available).
- Primary Strength: Chartbeat delivers real-time attention data and headline testing that let editors improve stories and homepage placement within minutes.
- Biggest Limitation: Chartbeat publishes no dollar pricing, is built mainly for high-traffic publishers, and does not suit lead-generation or B2B use cases.
- One-Line Summary: Chartbeat is a real-time editorial analytics platform used by 60,000+ media brands that shows newsrooms live reader attention and lets them test headlines as stories run.
- Last Verified: November 2026
Overview
Chartbeat is a real-time newsroom analytics platform for digital publishers that tracks live attention time, engaged time and scroll depth, built for editorial teams that make minute-by-minute decisions about headlines, homepage placement and story promotion.
Chartbeat does not replace general web analytics, and Chartbeat does not serve B2B lead generation. Chartbeat keeps up to 13 months of history, which limits deep historical analysis.
Chartbeat also publishes industry research on publisher traffic, including organic referral trends across 2,576 publisher sites (Search Engine Land, 2026).
Key Features
- Chartbeat’s real-time dashboard shows concurrent readers, engaged time, scroll depth and recirculation for live content.
- Chartbeat’s Heads Up Display overlays click-through and scroll data directly on the publisher’s live pages.
- Chartbeat supports headline and image testing so editors can compare variants while stories are live.
- Chartbeat includes a video dashboard, Conversions + Recommendations, and up to 13 months of historical data.
- Chartbeat integrates with Slack, WordPress and Brightcove, and offers iOS and Android apps plus real-time API endpoints.
Best For
Chartbeat is best for high-traffic newsrooms and media organizations doing audience development, where live audience signals directly shape headlines, homepage curation and story promotion.
Pricing
Chartbeat pricing, verified November 2026 (G2, 2026; Chartbeat, 2026):
- Chartbeat publishes no dollar pricing, and Chartbeat prices depend on monthly pageviews.
- Chartbeat offers Basic, Plus (Basic plus one premium feature) and Premium tiers, plus custom enterprise plans.
- Chartbeat provides a free trial and multi-year discounts, and Chartbeat is aimed mainly at sites above about 5 million monthly pageviews.
Strengths
- Chartbeat holds a 9.2/10 rating from 117 TrustRadius reviews, with real-time reporting rated 9.4/10, as of November 2026 (TrustRadius, 2026).
- Chartbeat holds a 4.4/5 rating from 69 G2 reviews as of November 2026 (G2, 2026).
- Chartbeat serves more than 60,000 media brands in 70+ countries, according to its vendor profiles (G2, 2026; TrustRadius, 2026).
- Chartbeat reports that an unnamed national daily grew revenue by 15% and an unnamed UK newspaper group grew subscriber revenue by 30%; both case studies are vendor-reported (Chartbeat, 2026).
Limitations
Chartbeat’s focus on real-time editorial work comes at the cost of breadth. Chartbeat publishes no dollar pricing, and Capterra reviewers repeatedly cite Chartbeat’s cost (Capterra, 2026).
- Chartbeat caps history at about 13 months, and one G2 reviewer noted that Chartbeat gives no insight into which topics will trend in the coming days (G2, 2026).
- Chartbeat has a small Capterra sample of 17 reviews, which lowers confidence in Chartbeat’s 4.8/5 Capterra score (Capterra, 2026).
- Chartbeat is aimed at sites above about 5 million monthly pageviews, so smaller publishers may pay for real-time Chartbeat capability they cannot act on (G2, 2026).
Verdict
Chartbeat is the most real-time-focused editorial analytics tool in this ranking for high-traffic newsrooms that make live headline and homepage decisions, rated 9.2/10 across 117 TrustRadius reviews as of November 2026.
Chartbeat’s rank reflects opaque pricing and thin review samples, not weak capability, so smaller publishers should test Chartbeat’s value during the free trial. Skip Chartbeat if you run a B2B lead-generation site or publish under about 5 million monthly pageviews.
6. Semrush: Best for SEO-Led Content Research and AI Search Visibility Tracking
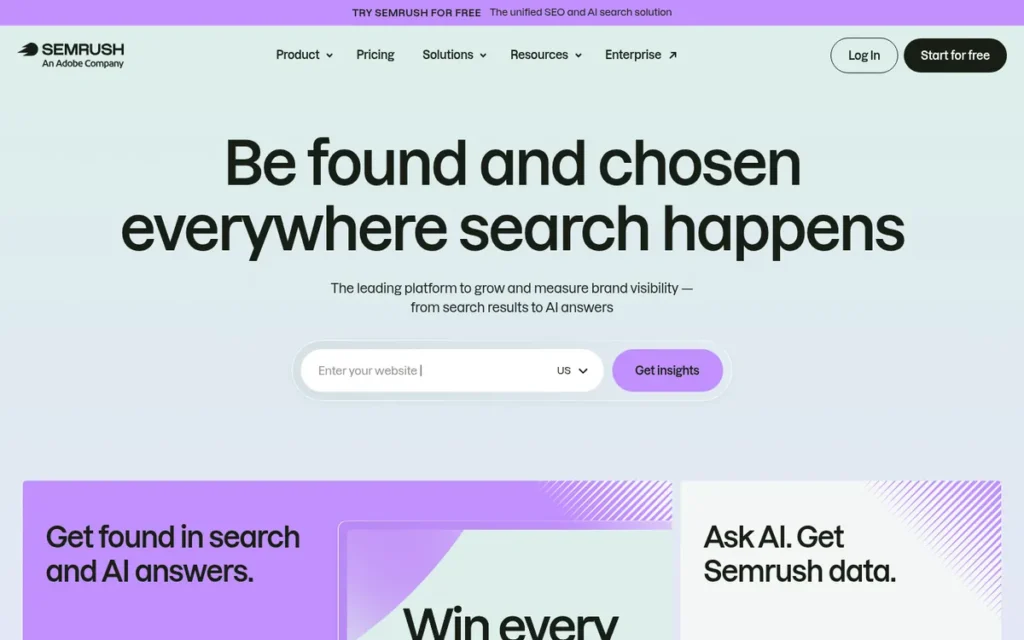
Category: Search & Competitive Researcher, off-site research on topics, competitors and search visibility, not measurement of your own site’s engagement.
PlugRoute Score: 29.0/45 (C1 2 · C2 4 · C3 4 · C4 3 · C5 4 · C6 2). Why #6: Semrush has the largest review base, but modeled traffic data scored low on both content depth and data trust.
At a Glance
- Category: Search & Competitive Researcher
- Best For: SEO leads and content marketers planning topics, closing keyword gaps against competitors and tracking visibility in AI search answers.
- Price Range: From $139.95/month; higher tiers to about $499–$549/month (tier names changing; verify).
- Primary Strength: Semrush combines competitor research, keyword data and AI search visibility tracking in one widely reviewed platform.
- Biggest Limitation: Semrush cannot measure scroll depth, engaged time or conversions on your own site because its traffic figures are modeled estimates.
- One-Line Summary: Semrush is an SEO and competitive research platform that helps content teams choose topics and track search and AI-answer visibility, but it does not measure engagement on their own site.
- Last Verified: November 2026
Overview
Semrush is an all-in-one search visibility and competitive research platform, now owned by Adobe, that helps SEO leads and content marketers find topics, analyze competitors and track visibility in search, Google AI Overviews and other AI answer engines.
Semrush does not measure first-party engagement on your own site, because Semrush Traffic Analytics data is modeled. Buyers in this category often mistake modeled research data for on-site measurement.
Adobe completed its acquisition of Semrush on April 28, 2026, and Semrush says existing customer contracts were unchanged at closing (Semrush, 2026).
Key Features
- Semrush tracks brand visibility in AI search experiences, including Google AI Overviews, ChatGPT, Gemini and Perplexity.
- Semrush Content Toolkit, SEO Writing Assistant and ContentShake support search-informed planning, optimization and AI drafting.
- Semrush Content Audit and Position Tracking monitor how existing content ranks in search over time.
- Semrush’s Keyword Magic Tool is described as covering 27B+ keywords across 140+ countries, though vendors count database size differently (G2, 2026).
- Semrush Traffic Analytics estimates competitor traffic using modeled data rather than first-party measurement.
Best For
Semrush is best for SEO-led content teams that need competitor and topic research and AI search visibility tracking for generative engine optimization (GEO), paired with a separate tool for on-site measurement.
Pricing
Semrush pricing, verified November 2026, is in transition (G2, 2026; Docket, 2026):
- Semrush plans start at $139.95 per month, or about $117.33 per month on annual billing (Docket, 2026).
- Semrush’s classic Guru and Business tiers are listed at $249.95 and $499.95 per month (G2, 2026).
- Semrush has reportedly restructured its plans into SEO ($139.95), Starter ($199), Pro+ ($299) and Advanced ($549) tiers, so verify current names on semrush.com/prices (Blogpilot, 2026).
Semrush charges extra for additional users, toolkits and API access, and one reviewer called Semrush a broad suite “sold in pieces” (Docket, 2026).
Strengths
- Semrush holds a 4.4/5 rating from about 4,020 G2 reviews and 4.6/5 from about 2,300 Capterra reviews as of November 2026, the largest review base in this ranking (G2, 2026; Capterra, 2026).
- Semrush reported FY2025 revenue of $443.6M, up 18% year over year, with customers paying more than $50K per year growing 74%+ (Semrush, 2026).
- Semrush tracks visibility in AI answer engines, a growing need as zero-click rates for Google news-related searches rose from 56% to 69% between May 2024 and May 2025 (Similarweb, 2025).
- Semrush publishes tier pricing openly, unlike most specialist tools in this category.
Limitations
Semrush covers a lot of ground off-site but gives up first-party measurement. Semrush cannot show scroll depth, engaged time or conversions on your own site. One comparison found Semrush estimates less accurate than Similarweb’s for sites with about 5,000–100,000 monthly users (FindAlternative.to, 2026).
- G2 and Capterra reviewers describe Semrush as expensive for freelancers and SMBs, and Semrush add-ons raise the real cost (G2, 2026).
- Semrush holds a 2.8/5 Trustpilot rating, driven by complaints about trial conversion, cancellation and refunds (Docket, 2026).
- Semrush’s product direction after the Adobe acquisition is uncertain, although Semrush says existing contracts were unchanged at closing (Semrush, 2026).
Users on r/DigitalMarketing shared their experience:
“Yeah, it’s messy, GA, GSC, Ahrefs, SEMrush… none of them fully line up. GA shows real users but even that can feel off when GSC says something else. The SEO tools just model visibility, not traffic. At this point, I treat them all as signals, not truth. Gotta piece it together from all sides.” Posted by u/sonikrunal
Takeaway: Practitioners treat Semrush traffic figures as modeled signals rather than measured visits, which is why Semrush has to be paired with a first-party analytics tool.
Verdict
Semrush is the only content research and AI search visibility tool in this ranking, with about 4,020 G2 reviews averaging 4.4/5 as of November 2026, and Semrush is not an on-site content analytics tool.
Buy Semrush to decide what to write, then pair Semrush with GA4, a behavioral tool or an editorial tool to measure engagement. Skip Semrush if you need to measure reader behavior on your own pages, and review trial and cancellation terms carefully.
7. Parse.ly (WordPress VIP): Best for Content Analytics by Author, Section and Tag
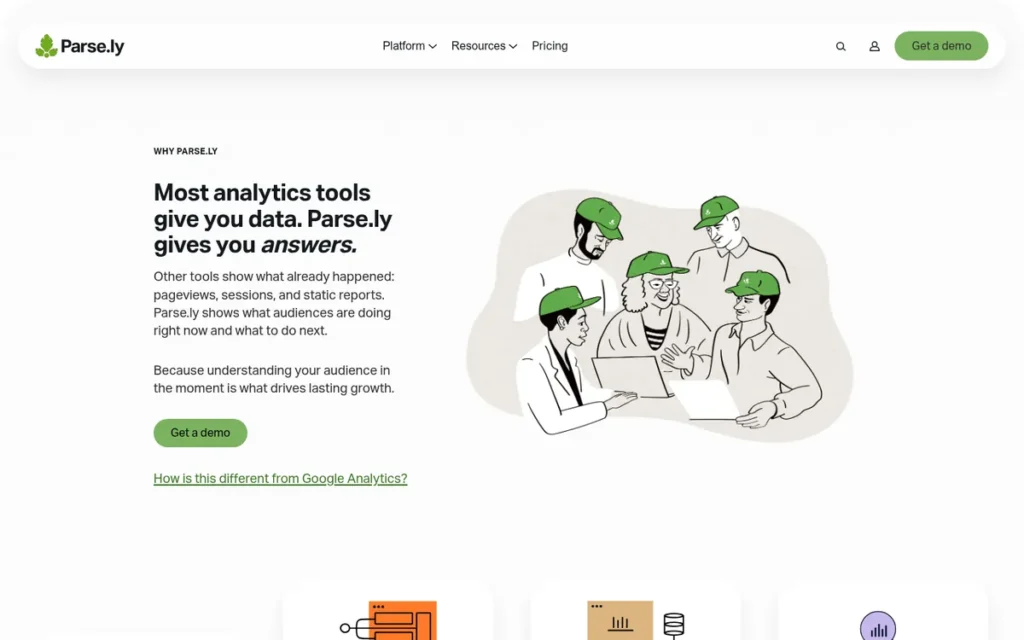
Category: Editorial Intelligence, article-level engagement analytics that guide publishing and editorial decisions.
PlugRoute Score: 28.5/45 (C1 5 · C2 3 · C3 1 · C4 2.5 · C5 3.5 · C6 4.5). Why #7: Parse.ly tied for the top content-depth score and scored second-highest on data trust, but having no list price and thin reviews pulled it to last.
At a Glance
- Category: Editorial Intelligence
- Best For: Publishers and brand content teams that need engaged time rolled up by article, author, section and tag, with raw data access for their own warehouse.
- Price Range: Pricing on request (third-party figures conflict: about $499/month to $12,000 per user per year).
- Primary Strength: Parse.ly reports engaged time and performance by author, section and tag, and delivers raw event data to the customer’s own warehouse.
- Biggest Limitation: Parse.ly publishes no list price, third-party price figures conflict roughly twofold, and its independent review base is thin.
- One-Line Summary: Parse.ly is a content-first analytics platform owned by Automattic that measures engaged time by article, author, section and tag, built for publishers and brand content teams that make editorial decisions.
- Last Verified: November 2026
Overview
Parse.ly is a content-first editorial analytics platform owned by Automattic (WordPress VIP) that measures engaged time and performance by article, author, section and tag, built for publishers and brand content teams deciding what to publish, update and promote.
Parse.ly does not provide full B2B revenue attribution, and Parse.ly Content Conversions are lighter than Dreamdata’s attribution.
Parse.ly also publishes referral benchmarks, including its Authority Report, that track Google and Facebook referral shifts across the Parse.ly network (Parse.ly, 2026).
Key Features
- Parse.ly measures engaged time through “heartbeats” that confirm a reader is actively engaging rather than leaving a tab open.
- Parse.ly’s real-time dashboard reports content performance by post, author, section, tag, referrer and campaign.
- Parse.ly offers Content Conversions, Smart Tags and a Recommendations API on applicable tiers.
- Parse.ly’s Data Pipeline delivers raw event data via S3 or Kinesis to Redshift or BigQuery.
- Parse.ly Content Helper embeds analytics directly inside the WordPress editor.
Best For
Parse.ly is best for publishers and content-led organizations, especially on WordPress, that need editorial performance by author and topic plus raw data for their own analysis.
Pricing
Parse.ly pricing, verified November 2026, has three tiers with no list price (Parse.ly, 2026):
- Parse.ly Content Performance covers one site, 30+ metrics, real-time data and 13 months of history.
- Parse.ly Content Value covers two sites and adds conversions, attribution and segmentation.
- Parse.ly Content Advocacy covers three sites and adds geographic segmentation, video and SSO.
G2 lists a Parse.ly Basic-plan price of $12,000 per user per year and Capterra lists a $12,000 starting price. TrustRadius lists $499 per month, which may be outdated (G2, 2026; Capterra, 2026; TrustRadius, 2026).
Strengths
- Parse.ly holds a 4.4/5 rating from 149 G2 reviews as of November 2026, with praise for real-time data, a clean interface and scheduled reports (G2, 2026).
- Parse.ly publicly documents how it calculates heartbeat-based engaged minutes, which makes the Parse.ly core metric auditable (Parse.ly, 2026).
- Parse.ly’s raw Data Pipeline to Redshift or BigQuery sets Parse.ly apart from dashboard-only editorial tools.
- Parse.ly says it serves more than 300 enterprise companies, which is a vendor figure (G2, 2026).
Limitations
Parse.ly offers enterprise-grade editorial depth but little pricing transparency. Parse.ly publishes no list price, and third-party Parse.ly price figures vary roughly twofold, which makes budgeting difficult before a sales call.
- Parse.ly’s independent evidence is thin, with one Capterra review and TrustRadius feedback dating from 2021 (TrustRadius, 2021).
- Parse.ly reviewers on TrustRadius asked for custom ad hoc queries and component-level metrics (TrustRadius, 2021).
- Parse.ly dashboard figures use local time while Parse.ly pipeline data uses UTC, so totals can differ from GA4 and from the pipeline itself (Parse.ly, 2026).
Verdict
Parse.ly offers the deepest author-, section- and tag-level content analytics in this ranking, but Parse.ly ranks seventh because it publishes no pricing and has the thinnest independent review evidence as of November 2026.
Editorial teams should still shortlist Parse.ly alongside Chartbeat, request a written quote and customer references, and plan to reconcile Parse.ly totals with GA4. Skip Parse.ly if you need B2B revenue attribution or a published price before talking to sales.
How Much Does Content Analytics Software Cost?
Content analytics pricing follows four main models: free or self-hosted tiers, published monthly tiers, quote-only enterprise contracts, and stacks that combine several tools. Each vendor bills on a different metering unit. Contentsquare and Hotjar charge by sessions, Matomo Cloud by hits, Chartbeat by pageviews, Dreamdata Free by seats and Parse.ly by sites. That makes side-by-side comparison hard. Three ranked tools publish both a free tier and a public paid tier: Contentsquare, Matomo and Hotjar. Four of the seven hide meaningful pricing: Chartbeat, Parse.ly, Contentsquare (Pro and Enterprise) and Dreamdata (paid Attribution).
Traffic volume and add-ons push the bill up most. Hotjar Growth starts at about $39 per month at 7,000 sessions and rises to about $739 per month at 200,000 sessions. Matomo heatmaps and session recordings require paid premium bundles. Semrush charges extra for additional users, toolkits and API access, and one reviewer called it a suite “sold in pieces.”
Hidden costs include the following:
- Dreamdata: implementation fees, annual contracts and a large price jump from free to paid
- Matomo: hosting, database tuning and security work if you self-host
- Hotjar: data may be sampled or collection may stop once sessions exceed the plan allowance
- Contentsquare and Dreamdata: developer time for setup
| Product | Pricing Model | Starting Price | What Raises the Cost |
|---|---|---|---|
| Contentsquare | Free tier, public Growth tier, quote-only Pro and Enterprise | Free (up to 200K sessions/month); Growth from $39–$49/month | Session volume, modules, data retention, moving to Pro or Enterprise |
| Matomo | Free self-hosted core, hit-metered Cloud, premium bundles | Free (On-Premise); Cloud from about €29/month (50K hits); bundles from €230/month billed annually | More hits, premium bundles (€1,209 Business, €2,834 Enterprise), month-to-month billing, self-hosting upkeep |
| Hotjar (by Contentsquare) | Free tier plus session-scaled Growth, sold as Contentsquare plans | Free (up to 200K sessions/month); Growth about $39/month annual or $49/month monthly | Session growth (about $739/month at 200K sessions), monthly billing |
| Dreamdata | Free tier, quote-only paid Attribution | Free (5 seats, 2 months of history); paid tiers: Custom quote | Jump to paid tier, implementation fees, annual contracts |
| Chartbeat | Quote-only, pageview-based tiers (Basic, Plus, Premium, custom) | Custom quote (free trial available) | Monthly pageviews, premium features, custom enterprise plans |
| Semrush | Published monthly tiers | $139.95/month (about $117.33/month billed annually) | Higher tiers (up to about $499–$549/month), extra users, toolkits, API access |
| Parse.ly (WordPress VIP) | Quote-only, three tiers by number of sites | Custom quote (third-party figures range from about $499/month to $12,000 per user per year) | More sites, conversions, attribution, segmentation, video and SSO on higher tiers |
Start with the free tiers, and get written quotes from quote-only vendors that state implementation fees, metering limits and what happens when you go over them.
What Red Flags Should I Watch For When Evaluating Content Analytics Software?
The six biggest red flags in content analytics software are modeled traffic sold as on-site measurement, quote-only pricing without written scope, session caps that degrade data, gaps between B2B and consumer review scores, attribution sold before CRM data is clean, and consent-exemption claims that exclude features you need.
Red Flag #1: Modeled Traffic Sold as On-Site Analytics Modeled traffic estimates cannot show what readers do on your own pages. For example, if GA4 shows 40,000 visits last month, Semrush Traffic Analytics shows a modeled estimate, not those visits, and cannot say how far any reader scrolled. Confirm that a tool uses first-party data before relying on it.
Red Flag #2: Quote-Only Pricing With No Written Scope Quote-only pricing hides the true cost unless the vendor puts the metering basis, add-ons and implementation fees in writing. Four of the seven ranked tools hide meaningful pricing: Chartbeat, Parse.ly, Contentsquare (Pro and Enterprise) and Dreamdata (paid Attribution). Parse.ly’s third-party figures vary roughly twofold.
Red Flag #3: Session Caps That Trigger Sampling or Stop Data Collection Session caps can quietly make your data less representative when traffic exceeds the plan allowance. Hotjar data may be sampled or collection may stop past its cap, which weakens recordings and funnels (UX Crush, 2026). Ask every vendor what happens at the limit before signing.
Red Flag #4: Large Gaps Between B2B and Consumer Review Scores Large gaps between B2B and consumer review scores often point to billing or cancellation risk. Semrush scores 2.8/5 and Hotjar 1.6/5 on Trustpilot, far below their G2 and Capterra ratings (Trustpilot, 2026; Docket, 2026). Read the low-star reviews for patterns before you start a trial.
Red Flag #5: Attribution and Depth Promised Before Your Data and Developers Are Ready Attribution and element-level tools need clean data and developer time before results are reliable. Dreamdata reportedly needs developer setup and 4–8 weeks before its data is useful (Sona, 2026), and Contentsquare reviewers report that page mapping depends on developers (G2, 2026). Audit your CRM and developer capacity first.
Red Flag #6: Consent-Exempt Claims That Exclude the Features You Need Consent-exemption claims usually apply only to a restricted configuration. Matomo’s CNIL exemption excludes user IDs, cross-domain tracking, A/B testing, heatmaps and session recordings (Matomo, 2026). Before assuming compliance, ask any vendor for written documentation of which features stay available under consent-exempt settings.
What Questions Should I Ask Before Choosing Content Analytics Software?
Before choosing content analytics software, ask six questions: which measurement job you need, whether the tool measures your site with first-party data, what is metered, how long until data is useful, who owns the vendor, and how totals will reconcile with GA4. These questions expose the most common causes of bad purchases.
Question #1: Which measurement job do I need this tool to do? The measurement job determines the right category: behavior (Contentsquare, Hotjar), editorial (Chartbeat, Parse.ly), privacy (Matomo), attribution (Dreamdata) or research (Semrush). Choose the category first, then compare tools within it. Only 6.5 points separate all seven tools, so overall rank matters less than job fit.
Question #2: Does this tool measure my own site with first-party data, or estimate it? First-party measurement is essential for engagement decisions about your own pages. Semrush Traffic Analytics models traffic, while Contentsquare, Hotjar, Matomo, Chartbeat, Parse.ly and Dreamdata collect first-party data through a tracking script. Ask any vendor directly whether its figures are measured on your site or modeled from third-party data.
Question #3: What exactly is metered, and what happens when I exceed the limit? Metering units differ across these tools: sessions for Contentsquare and Hotjar, hits for Matomo Cloud, pageviews for Chartbeat, seats for Dreamdata Free and sites for Parse.ly. Ask whether going over a limit triggers sampling, stops data collection or forces an automatic upgrade, and get the answer in writing.
Question #4: How long until the data is useful, and what setup does it need? Time to value ranges from same-day script installs (Hotjar earned this ranking’s only perfect implementation score) to multi-week, developer-assisted rollouts. Sona, a competing vendor, reports that Dreamdata needs 4–8 weeks (Sona, 2026). Ask each vendor for a written implementation plan that names the internal resources needed and the date the data will be ready to act on.
Question #5: Who owns the vendor, and how could that change pricing or the roadmap? Three of the seven ranked tools now belong to larger parent companies: Contentsquare owns Hotjar, Adobe owns Semrush (closed April 2026), and Automattic owns Parse.ly. Ownership changes can shift pricing, bundling and product roadmaps, so ask how the change affects contract terms, renewal pricing and planned features.
Question #6: How will this tool’s totals reconcile with GA4? Totals rarely match across tools because they differ on time zones, engagement logic, sampling, consent handling and bot filtering. Parse.ly, for example, documents that its dashboard uses local time while its data pipeline uses UTC (Parse.ly, 2026). Agree on one source of truth per metric before reporting.
How Did We Rank These Content Analytics Tools?
PlugRoute scored each tool from 1 to 5 on six criteria. Content-level measurement depth, independent review evidence and pricing transparency count double. Documented results, implementation effort and data trust count once, for a maximum of 45 points. Contentsquare scored highest at 35.0, and only 6.5 points separate first from seventh.
Primary criteria (weighted ×2):
- C1 Content-Level Measurement Depth matters because generic analytics shows page views but not engagement within articles, by author or by content block. A 5 means native article, author, section or tag reporting on first-party data, and a 2 means modeled off-site research.
- C2 Independent Review Evidence matters because vendor pages offer no independent comparison. The C2 score combines rating, review volume and consistency across platforms, and large Trustpilot billing gaps lower it.
- C3 Pricing Transparency and Entry Value matters because quote-only pricing blocks budgeting. A 5 means a free tier plus public paid tiers, and a 1 means no public dollar pricing, with conflicting figures noted where present.
Secondary criteria (weighted ×1):
- C4 Documented Results and Scale matters because buyers need outcome evidence, and named case studies score higher than unnamed or vendor-reported results.
- C5 Implementation Effort and Time to Value matters because small teams often lack developers. A 5 means same-day value, and a 2 means developer-assisted or multi-week setup.
- C6 Data Trust and Ownership matters because sampling, caps and modeled estimates weaken decisions. A 5 means unsampled first-party data with self-hosting or raw export.
| Rank | Tool | C1 (×2) | C2 (×2) | C3 (×2) | C4 | C5 | C6 | Weighted Total |
|---|---|---|---|---|---|---|---|---|
| 1 | Contentsquare | 4 | 4.5 | 4 | 4 | 2 | 4 | 35.0 |
| 2 | Matomo | 3 | 3 | 5 | 3 | 2.5 | 5 | 32.5 |
| 3 | Hotjar | 3 | 3.5 | 4 | 3 | 5 | 3 | 32.0 |
| 4 | Dreamdata | 4 | 4.5 | 2.5 | 2.5 | 2 | 4 | 30.5 |
| 5 | Chartbeat | 5 | 3.5 | 1 | 3.5 | 3 | 4 | 29.5 |
| 6 | Semrush | 2 | 4 | 4 | 3 | 4 | 2 | 29.0 |
| 7 | Parse.ly | 5 | 3 | 1 | 2.5 | 3.5 | 4.5 | 28.5 |
PlugRoute discloses the following about this ranking:
- PlugRoute replaced Ahrefs with Dreamdata so the ranking covers content-to-revenue attribution, and Ahrefs is the natural swap-back for a second SEO tool.
- PlugRoute scores Hotjar separately from Contentsquare because Hotjar keeps a distinct, simpler product experience and its own review profiles (345 G2 and about 545 Capterra reviews), even though Hotjar plans have been sold as Contentsquare plans since July 1, 2025.
- PlugRoute lowered Matomo’s C2 score from 3.5 to 3.0 after Matomo’s G2 rating fell from 4.5 to 4.2 in November 2026, which narrowed Matomo’s lead over Hotjar to 0.5 points.
- PlugRoute redefined a C3 score of 1 as “no public dollar pricing,” and that change did not alter any score.
- PlugRoute treats GA4, Microsoft Clarity and Google Search Console as an unranked baseline that was not scored.
- PlugRoute found no independent head-to-head performance test and no peer-reviewed studies for any ranked product.
- PlugRoute labels vendor-reported and competitor-authored evidence throughout. PlugRoute could not verify Chartbeat’s founding, CEO, ownership or the MRC accreditation status of its engaged-time metric.
- PlugRoute’s community data was very thin, and the only verified Reddit thread covers Hotjar and dates from December 2020.
- PlugRoute checked Trustpilot only where research flagged gaps between B2B and consumer ratings. Trustpilot tends to attract billing complaints, while G2 and Capterra collect solicited reviews.
- PlugRoute cites sources as (Source, Year), and undated web pages were accessed in November 2026.
PlugRoute has no affiliate relationships with any company listed. Rankings are determined entirely by research data and objective evaluation criteria.
What Do Buyers Ask Most About Content Analytics Software?
Buyers most often ask which tools suit publishers and newsrooms, how to choose content analytics software for SEO, and how independent rankings are produced. Each answer below responds directly to the question, uses the same November 2026 data as the rankings above, and can be read on its own.
What is the best content analytics software for publishers and newsrooms?
Chartbeat and Parse.ly are the strongest content analytics choices for publishers and newsrooms, and both scored 5/5 on content-level measurement depth. Chartbeat suits high-traffic newsrooms making live headline and homepage decisions. Parse.ly suits teams that need author, section and tag reporting with raw data export. Both rank lower overall mainly because their pricing is quote-only.
How do I choose content analytics software for SEO?
To choose content analytics software for SEO, keep research and measurement separate. Use a research tool such as Semrush to pick topics, close keyword gaps and track AI-answer visibility. Then use a first-party tool such as GA4, Matomo, Parse.ly or Contentsquare to measure how search visitors actually engage. Semrush traffic figures are modeled, not measured.
How does PlugRoute determine its content analytics rankings?
PlugRoute ranks content analytics tools with a published scoring model of six criteria, each rated 1–5. Measurement depth, independent review evidence and pricing transparency count double. Documented results, implementation effort and data trust count once, for a 45-point maximum. Every rating includes its review count and verification date, and vendor-reported evidence is labeled.
What Do Key Content Analytics Software Terms Mean?
Engaged Time: The time a reader spends actively engaging with an article, measured separately from a tab that is simply left open. Editorial platforms report it by article, author, section and tag, so it shows which stories and writers actually hold attention, not just which ones get clicks.
Heartbeat: A tracking method that sends repeated signals while a reader is actively engaging with a page, and engaged time is calculated from those signals. When a vendor publicly documents how heartbeats are counted, buyers can audit the core metric instead of trusting a black box.
Editorial Taxonomy: The way content is grouped by author, section and tag so performance can be rolled up across many articles. Behavioral and traffic tools usually lack these rollups, so publishers who need author or topic reporting need a dedicated editorial tool.
Zone-Based Heatmap: A heatmap that reports exposure, clicks, conversion and revenue for each element or content block on a page, not just for the page as a whole. It can show whether an inline product block or an end-of-article call to action drove a conversion, but it usually needs developer help to set up.
Session Cap: The number of sessions a plan allows each month. Once traffic goes past the cap, data may be sampled or collection may stop, which makes recordings and funnels less representative. Ask every vendor what happens at the limit before you sign.
Unsampled Data: Analytics based on every recorded visit, not on a subset that is projected to estimate the whole. It matters because sampling, caps and estimates weaken decisions, and unsampled first-party data is one sign of high data trust.
First-Party Data: Data collected directly on your own site through a tracking script, as opposed to figures estimated from outside sources. Only first-party measurement can show scroll depth, engaged time or conversions on your own pages.
Modeled Traffic: Traffic figures that SEO and competitive research tools estimate instead of measuring real visits. Modeled traffic is useful for planning topics and comparing competitors, but buyers often mistake it for on-site measurement, and it can be less accurate for smaller sites.
Metering Unit: The usage measure a vendor’s price is based on, such as sessions, hits, pageviews, seats or sites. Units differ from tool to tool, so comparing prices means knowing what is counted and getting overage terms in writing.
Multi-Touch Attribution: A method that gives credit for a deal to the content and marketing touchpoints an account interacted with, tied to CRM pipeline and closed revenue. It needs clean CRM data, enough deal volume and often several weeks of setup, and its results are best treated as directional, not exact.
Consent Exemption: A restricted configuration that lets a privacy-first tool collect analytics without a consent banner under rules such as France’s CNIL. These exemptions usually exclude features such as user IDs, cross-domain tracking, A/B testing, heatmaps and session recordings, so get written confirmation of what still works.
AI-Answer Visibility: How often your brand or content appears inside AI search experiences such as Google AI Overviews and AI answer engines. On-site analytics cannot see these appearances because many readers never click through, so tracking this requires a search research tool.
Which Content Analytics Tool Is Right for You?
Key Insights
- For most marketing teams in 2026, Contentsquare is the strongest overall content analytics choice at 35.0 of 45 points. Even so, the right tool depends on your measurement job: newsrooms should shortlist Chartbeat or Parse.ly, and B2B teams proving pipeline impact should evaluate Dreamdata first.
- Content analytics covers five distinct measurement jobs, and no single tool in this ranking covers all five.
- Four of the seven ranked tools hide meaningful pricing: Parse.ly, Chartbeat, Contentsquare (Pro and Enterprise) and Dreamdata (paid Attribution).
- SEO research suites such as Semrush cannot measure on-site engagement because their traffic data is modeled.
- No tool in this ranking yet connects editorial engagement directly to closed B2B revenue.
Most teams will combine tools. These stacks use verified list prices where available:
- A $0 stack combines GA4, Microsoft Clarity and Google Search Console, plus Matomo On-Premise for teams with technical staff.
- An SMB stack pairs Contentsquare or Hotjar Growth ($39–$49 per month at entry session volumes) with Semrush’s entry plan ($139.95 per month), for about $179–$189 per month before add-ons.
- A privacy stack uses self-hosted Matomo, or Matomo Cloud from about €29 per month for 50,000 hits.
- A publisher stack uses Chartbeat or Parse.ly, and its total cannot be calculated in advance because both tools are quote-only.
- A B2B attribution stack adds Dreamdata for content attribution and account-based marketing (ABM) reporting to a behavioral or editorial tool, and Dreamdata’s paid pricing is also quote-only.
Run a 30-day evaluation before you commit:
- Your team should first confirm which of the five measurement jobs matters most.
- Your team should install the free tiers that fit that job, such as GA4, Microsoft Clarity, Contentsquare Free, Dreamdata Free or Matomo On-Premise.
- Your team should request written quotes from quote-only vendors that include implementation fees and metering limits.
- Your team should reconcile each trial tool’s totals against GA4 before deciding.
PlugRoute verified all prices and ratings in November 2026. We update this guide quarterly. Last updated: November 2026.
Read PlugRoute’s full scoring methodology and see our other independent analytics reviews before you shortlist.