The best construction data analytics software in 2026 depends on your system of record: CMiC for finance-led firms wanting ERP-native job cost, Procore Analytics for Procore-centered contractors, and Trimble Construction One Analytics for Viewpoint users. Finance-strong tools tend to be weakest on field data, and the reverse is also true.
Most contractors keep their data in separate systems and spreadsheets, so no one sees a single view across jobs. Job-cost variances often surface only after margins erode, and many teams learn late that dashboard viewers need separate paid licenses.
As one user on r/GeneralContractor described:
“Peace of advise, excel spreadsheets are a great tool but i have seen a lot of errors due to formulas. Be cautious with them. I definitely recommend a construction focused accounting software such as spectrum, Sage, etc.” Posted by u/Witty-Recognition818
Takeaway: Formula errors make spreadsheet-based construction financials unreliable, which is why practitioners push contractors toward purpose-built construction systems for job-cost reporting.
PlugRoute has no affiliate relationships with any company listed. Rankings are determined entirely by research data and objective evaluation criteria.
This guide scores seven tools across five categories on six weighted criteria, using dated sources verified in November 2026. The top two are separated by only 0.05 points, so category fit and the decision table below matter more than the rank number for any single buyer.
What Are the 5 Categories of Construction Data Analytics Tools?
Construction data analytics tools fall into five categories, defined below by where the analytics live and what data they see first. ERP-native tools score highest on GL-reconciled job cost in this evaluation, PM-native tools are strongest on field and project data, and the other three categories connect or extend those two systems.
- PM-Native Analytics: PM-native analytics are dashboards built into a construction project management platform, such as Procore Analytics and Autodesk Forma Insights.
- ERP-Native Analytics: ERP-native analytics are dashboards built into a construction accounting or ERP system, such as CMiC and Trimble Construction One Analytics.
- Finance Automation Layer: A finance automation layer automates WIP, forecasting and cost-to-complete on top of an existing ERP and PM tool, as briq does.
- Data Integration Layer: A data integration layer uses no-code pipelines to move data from many construction systems into a BI tool or warehouse, as Toric does.
- General BI Platform: A general BI platform is a general-purpose reporting tool that contractors set up for construction data themselves, such as Microsoft Power BI.
In construction analytics, the tools that see the general ledger best tend to see the jobsite worst, and the reverse is also true. In PlugRoute’s scoring, the two ERP-native tools average 5 on job-cost depth (C1) and the two PM-native tools average 2.5.
The office-versus-field trade-off shows up in two ways:
- Practitioner evidence: In an October 2025 r/ConstructionManagers thread, one practitioner said contractors left Viewpoint for Procore because of “terrible field integration,” with office and site data that “never synced up” (r/ConstructionManagers, 2025).
- Illustrative scenario: An ERP-native dashboard can show a job as 60% billed while the field is only 40% complete, and nothing in the ERP flags the gap because progress data lives in the PM tool. This example is an illustration, not a reported case.
How Do the Top Construction Data Analytics Tools Compare?
CMiC ranks first in this comparison with a weighted score of 3.15, and Procore Analytics is 0.05 points behind at 3.10. Trimble Construction One Analytics and briq tie at 2.90, and Toric and Microsoft Power BI tie at 2.85. The scores are close, so the category, best-for and limitation columns matter more than the rank number.
| Rank | Company | Category | Best For | One-Line Summary | Key Capabilities | Primary Strength | Key Limitation |
|---|---|---|---|---|---|---|---|
| 1 (3.15) | CMiC | ERP-Native Analytics | Finance-led mid-size and enterprise GCs | CMiC ties for the highest job-cost depth score and is the only option in the set that runs financials, job cost and project controls on a single database. | Single-database ERP; transaction-level drilldown; NEXUS AI | GL-reconciled job cost and commitments | Heavy implementation; weak interface and support sentiment |
| 2 (3.10) | Procore Analytics | PM-Native Analytics | Contractors running projects in Procore | Procore Analytics fits contractors whose project and field data already lives in Procore, and its score rests mainly on the largest verified review base. | Hourly refresh; prebuilt Power BI reports; Cloud Connector | Largest review base (G2 4.6/5, ~4,221 reviews, platform-wide) | Volume-based pricing; Power BI Pro needed for viewers; no quantified analytics case study |
| 3 (2.90) | Trimble Construction One Analytics | ERP-Native Analytics | Viewpoint Vista or Spectrum users | Trimble Construction One Analytics puts Power BI dashboards on the GL-reconciled job-cost data that Viewpoint ERP users already maintain. | Power BI on curated ERP data; SSRS and Crystal reporting | Job cost, payroll, equipment and GL in one data source | Weak field integration; prices can rise every year |
| 4 (2.90) | briq | Finance Automation Layer | CFO teams keeping their ERP | briq automates WIP and forecasting on top of the ERP and PM tools a contractor already uses. | Bots pulling ERP/PM data; WIP; cost-to-complete; AP | Takes WIP off spreadsheets without an ERP replacement | Implementation and integration complaints in reviews |
| 5 (2.85) | Toric | Data Integration Layer | Mixed stacks with small data teams | Toric is a no-code construction data-integration layer, not a finished job-cost analytics product. | No-code ingestion; PM, BIM and accounting connectors; output to BI or warehouse | Broadest documented cross-system coverage | Only 11 G2 reviews; no construction financial model |
| 6 (2.85) | Microsoft Power BI | General BI Platform | Contractors with in-house BI skills | Microsoft Power BI is the only product here with published dollar pricing, and it is the common reporting layer the other platforms connect to. | Power Query, DAX, semantic models, Fabric | Only published pricing in the evaluation | No construction data model; DAX skills needed |
| 7 (2.70) | Autodesk Forma Insights | PM-Native Analytics | BIM-heavy and design-build teams | Autodesk Forma Insights offers the most clearly documented machine-learning risk-ranking feature in this evaluation. | Construction IQ machine learning; Data Connector; Power BI card | Documented machine-learning risk ranking | Limited job-cost depth; repeated product renaming |
Which Construction Data Analytics Tool Should I Choose for My Use Case?
Start from your system of record, then match your top reporting priority to a category. Each row below pairs a priority with a recommended tool and a fallback option. Each row also flags the main cost risk to check before signing, because the cheapest-looking quote often hides the largest licensing or implementation cost.
| Your #1 Priority | Recommended Tool | Why | Acceptable Alternative |
|---|---|---|---|
| ERP-reconciled job cost for a finance-led firm | CMiC | Single-database ERP with transaction-level drilldown. Cost risk: long, costly implementation. | Trimble Construction One Analytics |
| Procore is your system of record | Procore Analytics | Prebuilt, hourly-refreshed dashboards on data you already have. Cost risk: volume-based fee plus Power BI Pro for viewers. | Toric + Microsoft Power BI |
| You already run Vista or Spectrum | Trimble Construction One Analytics | Power BI on the ERP data you already run. Cost risk: annual price increases. | briq (confirm Vista support; GetApp lists Viewpoint Team) |
| Automated WIP and forecasting without replacing your ERP | briq | Finance automation over existing ERP and PM tools. Cost risk: reported upfront payment. | CMiC native analytics |
| Data spread across many systems, with a small data team | Toric + a BI tool | No-code pipelines into Power BI or a warehouse. Cost risk: pricing not public, plus BI licenses. | Microsoft Power BI with a consultant |
| In-house BI skills and a need for full control | Microsoft Power BI | Published pricing and the common reporting layer other construction platforms connect to. Cost risk: gateway and governance overhead. | Toric for data plumbing |
| Project risk on BIM-heavy or design-build work | Autodesk Forma Insights | Construction IQ machine-learning risk ranking. Cost risk: bundled entitlements are hard to confirm. | Procore Analytics |
| Small contractor outgrowing spreadsheets | Microsoft Power BI Pro ($14/user/month, 2026) + a template or consultant | Lowest published entry price. Cost risk: you still need modeling help. Avoid volume-based platforms and full ERPs until your volume justifies them. | Microsoft Power BI Free tier for a single-user pilot |
PlugRoute did not research a tool built specifically for small contractors to equal depth in this edition. The small-contractor row is therefore a lowest-cost route, not a ranked pick.
What Are the Best Construction Data Analytics Tools, Ranked?
The seven construction data analytics tools below are ranked by weighted score across six criteria, from CMiC at 3.15 to Autodesk Forma Insights at 2.70. Every entry uses the same structure and includes genuine limitations, and every entry was verified in November 2026. Vendor case studies are labeled as vendor-selected wherever they appear.
1. CMiC: Highest Overall Score; Best for Finance-Led ERP Job-Cost Analytics
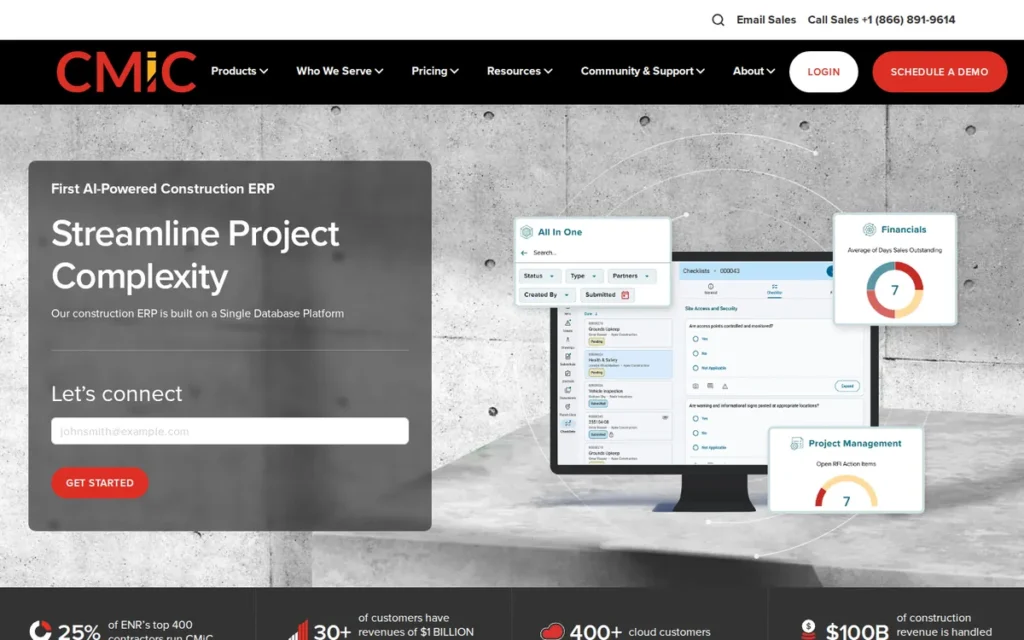
Category: ERP-Native Analytics, reporting and dashboards built into a construction accounting or ERP system.
At a Glance
- Category: ERP-Native Analytics
- Best For: Mid-size and enterprise general contractors that want job-cost, accounting and project-controls reporting reconciled in one ERP
- Price Range: Pricing on request (third-party reported starting point of about $100/user/month, varying by modules and company size)
- Primary Strength: CMiC provides GL-reconciled job-cost analytics with transaction-level drilldown from a single-database construction ERP.
- Biggest Limitation: CMiC requires adopting a full enterprise ERP, which brings a steep learning curve, a long implementation and reported difficulty building reports.
- One-Line Summary: CMiC ties for the highest job-cost depth score in this evaluation and is the only option in the set that runs financials, job cost and project controls on a single database.
- Last Verified: November 2026
Overview CMiC is a single-database construction ERP whose embedded BI analytics report budgets, commitments, actuals and projected costs with transaction-level drilldown. It is built for mid-size and enterprise general contractors that want job-cost, accounting and project-controls reporting reconciled in one system.
CMiC’s analytics value depends on whether the whole ERP fits the business. Buyers evaluating CMiC are choosing an ERP, not adding a dashboard layer.
Key Features
- CMiC’s embedded BI reports show job-cost summaries, projected costs, commitments, variances and transaction-level detail from live ERP data (CMiC documentation, accessed November 2026).
- CMiC unifies financials, job cost, project controls, payroll, document control and field workflows on one database (CMiC, accessed November 2026).
- CMiC NEXUS, announced in April 2025, adds data visualization, anomaly-detection alerts, predictive analytics and an “Ask AI” assistant built on OpenAI’s GPT-4 (CMiC, 2025).
- CMiC offers API-based reporting that connects to external BI tools. The scope of its Power BI connector was not confirmed as of November 2026 (CMiC GCON case study, accessed November 2026).
Best For CMiC is best for mid-size and enterprise general contractors whose CFO and project-controls teams need GL-reconciled job cost, WIP and commitments in one system and who have the budget for a full ERP implementation.
Strengths
- CMiC’s GCON case study reports 68 active dashboards used by 60 employees, about 9,000 invoices processed a year and a ~50% cut in subcontractor change-order cycle time (CMiC, accessed November 2026). The vendor selected and published this case study.
- CMiC customers report quantified gains in vendor-selected outcomes summarized by SelectHub: Wasatch Taylormade processed RFIs 50% faster, and Hand Construction finished audits in half the time (SelectHub, accessed November 2026).
- CMiC’s transaction-level drilldown across budgets, commitments, actuals and projected costs supports early detection of job-cost variances (CMiC documentation, accessed November 2026).
- CMiC reviewers on Capterra and G2 praise its job costing, financial accuracy, accounting-PM integration and user community (Capterra, accessed November 2026; G2, accessed November 2026).
Users on r/Construction noted:
“Procore for drawing, inspections and close out, and CMIC for RFI, submittals and all cost tracking. It’s funky but we don’t want to switch our accounting staff nor pay procore like 600k-900 a year.” Posted by u/radclial
Takeaway: Contractors keep CMiC as their cost-tracking backbone because it is tied to their accounting staff, even when it means living with an awkward split-system workflow.
Limitations CMiC trades ease of use for financial depth: buyers commit to a full enterprise ERP with a steep learning curve and a long, costly implementation. Review-platform themes suggest that CMiC’s enterprise scope makes it a poor fit for most small contractors (Capterra, accessed November 2026).
- CMiC reviewers on Capterra cite “problems with the development of reports” and a complicated interface (Capterra, accessed November 2026).
- Both CMiC Reddit comments PlugRoute found were negative about interface and support (r/Construction, 2021; r/ConstructionManagers, 2024). Both posters had moved to Procore, and neither commented on analytics quality.
- CMiC’s Capterra ratings conflicted when checked: one page showed 4.2/5 from 163 reviews and another showed 3.8 (Capterra, accessed November 2026).
- CMiC publishes no implementation cost range that PlugRoute could find, so buyers should require a written estimate.
Verdict CMiC is the highest-scoring tool in this evaluation for finance-led contractors that want job-cost and commitment analytics reconciled to the general ledger in one ERP. CMiC leads Procore Analytics by 0.05 points (3.15 vs. 3.10) because of higher job-cost depth (C1 = 5 vs. 3), even though its practitioner sentiment is weaker (C6 = 1.5).
CMiC has more named, quantified case studies than any other product in the set, but all of them are vendor-selected. Buyers should budget for training and test report-building with their own finance team in a pilot before signing.
2. Procore Analytics: Best for Procore-Centered Contractors

Category: PM-Native Analytics, reporting and dashboards built into a construction project management platform.
At a Glance
- Category: PM-Native Analytics
- Best For: Mid-size general and specialty contractors that already run projects, field workflows and project financials in Procore
- Price Range: Pricing on request (annual fee based on Annual Construction Volume with unlimited users; third-party estimate of ~$700–$1,000 per $1M of volume; Power BI Pro at $14/user/month for viewers)
- Primary Strength: Procore Analytics delivers prebuilt, hourly-refreshed construction dashboards on top of the most widely reviewed construction platform in this evaluation.
- Biggest Limitation: Procore Analytics depends on Procore being the system of record and adds volume-based platform costs plus Power BI Pro licenses for dashboard viewers.
- One-Line Summary: Procore Analytics fits contractors whose project and field data already lives in Procore and scores 3.10 mainly because of the largest verified review base, but it offers less WIP and GL depth than a construction ERP.
- Last Verified: November 2026
Overview Procore Analytics is the Power BI-based reporting layer built into Procore. It is designed for general and specialty contractors that already run projects, field workflows and project financials in Procore and want prebuilt cross-project portfolio dashboards without building a data model.
Procore has replaced Analytics 1.0 with Analytics 2.0 (Procore Support, accessed November 2026), so buyers should confirm that any quote names Procore Analytics 2.0.
Key Features
- Procore Analytics 2.0 runs on Databricks and refreshes hourly. The retired Analytics 1.0 refreshed daily (Procore Support, accessed November 2026).
- Procore Analytics ships prebuilt Power BI reports with relationships, KPIs, measures and visuals already defined on a semantic model organized by data domain (Procore Support, accessed November 2026).
- Procore Analytics can be viewed inside Procore or in a company’s own Power BI tenant, and its Cloud Connector can feed Power BI, Tableau or other data stores (Procore Support, accessed November 2026).
- Procore Analytics uses Delta Lake time travel to query up to 7 days of table history (Procore Support, accessed November 2026).
- Procore Analytics needs only a single access token across companies, which simplifies cross-company portfolio reporting.
Best For Procore Analytics is best for mid-size general and specialty contractors that use Procore as their system of record and want portfolio dashboards without hiring a BI developer.
Strengths
- Procore holds the largest review base in this evaluation: G2 4.6/5 from about 4,221 reviews and Software Advice 4.5/5 from about 2,680 reviews (G2, accessed November 2026; Software Advice, accessed November 2026). Both ratings cover the whole platform, not Procore Analytics alone.
- Procore Analytics 2.0 refreshes hourly instead of daily, which helps answer “is our data current?” for job-cost dashboards (Procore Support, accessed November 2026).
- Procore Analytics includes a prebuilt construction semantic model and 100+ reports, so teams skip the from-scratch modeling that general BI requires (Workyard, accessed November 2026).
- One r/ConstructionManagers user who had switched from CMiC said “Customer support with procore is amazing” (r/ConstructionManagers, 2024). This comment is the positive practitioner evidence behind Procore’s C6 score of 3.
Limitations Procore Analytics trades ERP-grade financial depth for field and project breadth: it is weaker than a construction ERP for WIP, revenue recognition and multi-entity consolidation. Procore Analytics works best only when Procore is the system of record.
- Procore’s Annual Construction Volume pricing is the main practitioner complaint. One small specialty contractor reported paying over $20,000 while using Procore on a single $600,000 project after being billed on anticipated volume (r/ConstructionManagers, 2024).
- Procore Analytics dashboard viewers need Power BI Pro licenses at $14/user/month, a sharing cost on top of the Procore fee (Procore Support, accessed November 2026).
- Procore Analytics setup requires moving between Procore admin and the Power BI service, and new users may need help (Workyard, accessed November 2026). Custom reports also require Power BI and DAX skills.
- Procore Analytics keeps only 7 days of table history. PlugRoute found no named, quantified Procore Analytics case study, which is why the product scores 1 on documented results (C5).
This aligns with community sentiment on r/GeneralContractor:
“We use Procore on a handful of jobs where we’re partnered up as a specialty GC under a broader GC, but when we looked at it for our company, it’s about 50% more expensive and lacks the backend accounting capabilities.” Posted by u/TheMostInterestedMan
Takeaway: Contractors who weigh Procore as a company-wide system find it costs more than construction accounting alternatives and lacks the backend accounting depth that finance-led firms need.
Verdict Procore Analytics is the most directly integrated analytics option for contractors whose project, field and project-financial data already lives in Procore. Procore Analytics trails CMiC by 0.05 points (3.10 vs. 3.15) mainly because no quantified analytics outcome was found (C5 = 1), although its review volume (C4 = 5) is the strongest in the set.
Finance-led firms should test Procore Analytics’ WIP and GL depth before relying on it. Small contractors should model volume-based pricing carefully, because billing on anticipated volume can outweigh the value of low-volume jobs.
3. Trimble Construction One Analytics: Best for Viewpoint Vista and Spectrum Users

Category: ERP-Native Analytics, reporting and dashboards built into a construction accounting or ERP system.
At a Glance
- Category: ERP-Native Analytics
- Best For: Mid-size and enterprise contractors already running Viewpoint Vista or Spectrum
- Price Range: Pricing on request (subscription only, one-year minimum term, annual renewal with possible yearly price increases)
- Primary Strength: Trimble Construction One Analytics delivers Power BI dashboards on curated ERP data covering job cost, committed cost, payroll, equipment and the general ledger.
- Biggest Limitation: Trimble Construction One Analytics inherits Vista’s dated interface, difficult custom reporting and weak field integration.
- One-Line Summary: Trimble Construction One Analytics is the logical first evaluation for contractors already on Viewpoint Vista or Spectrum, offering finance-grade analytics but weak field-data integration.
- Last Verified: November 2026
Overview Trimble Construction One Analytics is a Power BI-based reporting layer from Trimble that runs on Viewpoint Vista and Spectrum ERP data. It is built for mid-size and enterprise contractors that need GL-reconciled job-cost, committed-cost, payroll and equipment reporting from the ERP they already run.
Trimble Construction One is absorbing Viewpoint’s analytics capabilities, so buyers should confirm which product a Trimble Construction One Analytics quote actually covers.
Key Features
- Trimble Construction One Analytics provides Power BI-based dashboards with curated construction data fields, mobile access and forecasting (Trimble, accessed November 2026).
- Trimble Construction One Analytics draws on Vista ERP data covering job cost, committed cost, AP/AR, payroll, equipment, subcontracts and the general ledger (Software Advice, accessed November 2026).
- Trimble Construction One Analytics sits alongside Vista reporting through SQL Server, Excel, SSRS and Crystal Reports (Software Advice, accessed November 2026).
- Trimble Construction One Analytics supports SSO and SOC II Type 2 controls, according to Trimble’s product page (Trimble, accessed November 2026).
- Trimble Construction One Analytics connects to the wider Trimble ecosystem, including Field View, Tekla/BIM, ProjectSight and App Xchange (Trimble, accessed November 2026).
Best For Trimble Construction One Analytics is best for contractors already running Viewpoint Vista or Spectrum, because the existing ERP alignment reduces integration work for job-cost and forecasting dashboards.
Strengths
- A Trimble Viewpoint Vista customer reported a 50% reduction in time from work completion to billing and payment (Trimble, accessed November 2026). This is a vendor-selected testimonial.
- Trimble Construction One Analytics runs on structured ERP data, and Software Advice reviewers praise Vista’s SQL access and Power BI/SSRS support (Software Advice, accessed November 2026).
- Trimble Spectrum reviewers on G2 praise its accounting and project management modules, which feed the ERP data the analytics draw on (G2, accessed November 2026).
- Trimble runs a credentials program that includes Vista custom Power BI reporting, which gives in-house teams a documented training path (Trimble Credentials, accessed November 2026).
Limitations Trimble Construction One Analytics trades field connectivity for finance-grade ERP data. One practitioner said contractors left Viewpoint because of “terrible field integration,” with office and site information that “never synced up” (r/ConstructionManagers, 2025).
- Trimble Viewpoint Vista reviewers criticize hard custom reporting, inflexible canned reports, a dated UI, a steep learning curve, slow support and login complexity (Software Advice, accessed November 2026).
- Trimble Spectrum reviewers on G2 cite limited documentation, bugs and slow support (G2, accessed November 2026).
- Trimble Viewpoint Vista is described as overkill for small firms in an independent comparison (ERP Research, accessed November 2026).
- Trimble Construction One Analytics has no single verified rating, and most of the review evidence describes Viewpoint Vista. PlugRoute found no review listing or Reddit thread specific to Trimble Construction One Analytics.
Verdict Trimble Construction One Analytics is the most directly integrated analytics option for contractors already running Viewpoint Vista or Spectrum, because it draws on ERP data they already maintain. Trimble Construction One Analytics ties briq at 2.90 and ranks #3 on the job-cost depth tie-break (C1 = 5 vs. 4).
Contractors that need to verify field progress will likely need to add a PM-platform data source. Buyers should confirm the product named in each quote and negotiate a written cap on annual price increases.
4. briq: Best for Automating WIP and Forecasting Without Replacing Your ERP

Category: Finance Automation Layer, automates construction forecasting, WIP and financial reporting on top of existing ERP and PM systems.
At a Glance
- Category: Finance Automation Layer
- Best For: Contractor CFO teams that want to replace spreadsheet WIP and forecasting while keeping their current ERP and PM tools
- Price Range: Pricing on request (set in an Order Form; one reviewer reported $13,000 upfront)
- Primary Strength: briq automates construction-specific WIP, cost-to-complete and forecasting by pulling data from the ERP and PM systems a contractor already uses.
- Biggest Limitation: briq has reported implementation delays and integration failures, publishes no pricing and offers little field or schedule analytics.
- One-Line Summary: briq is a finance-automation layer for contractor CFOs who need to move WIP and forecasting off spreadsheets without replacing their ERP, though reviews document real implementation risk.
- Last Verified: November 2026
Overview briq is a construction financial-automation platform that pulls data from existing ERP and PM systems to automate forecasting, cost-to-complete, WIP and cash-flow reporting. It is built for contractor CFO and finance teams that want to keep their current systems.
briq now markets this capability through “Otto,” an AI operator (briq, accessed November 2026), so buyers should confirm what briq’s legacy forecasting and WIP modules are currently called.
Key Features
- briq automates construction forecasting, cost-to-complete, WIP, cash-flow and budget-to-actual reporting (briq, 2023).
- briq uses software “bots” to pull data from ERP and PM systems into a single financial source of truth (briq, 2023).
- briq lists integrations with CMiC, Procore, Viewpoint Team, Autodesk Construction Cloud, Excel, Microsoft 365 and Salesforce (GetApp, accessed November 2026).
- briq includes AP automation, which reviewers credit with removing double data entry (Software Advice, accessed November 2026).
- briq’s current “Otto” AI operator spans the Lead Genius, Project Genius and Accounting Genius modules (briq, accessed November 2026).
Best For briq is best for contractor finance teams that run WIP and forecasting in error-prone spreadsheets and want automation without replacing their ERP or PM platform.
Strengths
- Metro Walls reported that briq saved its CFO about one week per month (briq, accessed November 2026). This is a vendor-selected outcome.
- Bayley Construction replaced an error-prone Excel WIP workbook with briq (Datateer, accessed November 2026), which directly addresses the spreadsheet-WIP problem.
- briq is listed at 4.9/5 in a G2 category article, the highest rating shown in this evaluation, but the number of reviews behind it was not verified (G2, accessed November 2026).
- briq reviewers on Software Advice and GetApp praise AP automation, easier revenue forecasting and the removal of double entry (Software Advice, accessed November 2026; GetApp, accessed November 2026).
Limitations briq trades the depth of a true system of record for faster deployment on top of existing tools. As a result, briq’s results depend on clean source data and reliable integrations.
- briq’s negative reviews cite prolonged implementation, vendor staff turnover during onboarding, a failed accounting-system integration and dissatisfaction with an upfront payment (Software Advice, accessed November 2026).
- briq’s documented feature set does not cover schedule-risk or field-progress analytics.
- briq publishes no price list, and one reviewer reported paying $13,000 upfront (Software Advice, accessed November 2026).
- briq’s move to the “Otto” model raises roadmap questions. PlugRoute found no Reddit discussion of briq, and the absence of criticism should not be read as endorsement.
Verdict briq is the most finance-focused option in this evaluation for CFO teams automating WIP and forecasting without replacing their ERP. briq ties Trimble Construction One Analytics at 2.90 and ranks #4 because, as a layer on top of an ERP, its job-cost depth scores 4 rather than 5.
briq’s named case studies show time savings, but reviews describe implementation and integration problems. Buyers should pilot briq on their own accounting system before paying upfront and should plan a separate tool for field analytics.
5. Toric: Best for No-Code Data Pipelines Across Mixed Tech Stacks
Category: Data Integration Layer, moves, transforms and warehouses data from many construction systems into a BI tool or cloud warehouse.
At a Glance
- Category: Data Integration Layer
- Best For: Contractors with mixed PM, BIM, ERP and spreadsheet stacks and a small data team
- Price Range: Pricing on request (no public tiers or free trial verified)
- Primary Strength: Toric connects PM, BIM, accounting and spreadsheet data through no-code pipelines and delivers it to Power BI, BigQuery or Redshift.
- Biggest Limitation: Toric has no built-in construction financial model, a very small review base and unverified company and security facts.
- One-Line Summary: Toric is a no-code construction data-integration layer that solves the “data plumbing” problem for mixed tech stacks, but it is not a finished job-cost analytics product.
- Last Verified: November 2026
Overview Toric is a no-code construction data-integration platform that ingests, transforms and warehouses data from Procore, Autodesk, BIM, accounting and spreadsheet sources. It is built for contractors with mixed technology stacks and small data teams that need reliable pipelines into Power BI or a cloud warehouse.
Toric complements a BI tool rather than replacing one, so Toric buyers still need someone to define construction metrics.
Key Features
- Toric provides no-code data ingestion, transformation and warehousing, plus dashboards, ad hoc reporting and forecasting (Capterra, accessed November 2026).
- Toric connects to Procore, Revit, Navisworks, ARCHICAD, Google Sheets, QuickBooks, Salesforce, MySQL and S3 (G2, accessed November 2026).
- Toric sends transformed data onward to BigQuery, Redshift or Power BI (G2 and Capterra listings, accessed November 2026).
- Toric supports use cases including bidding and estimating, historical project analysis and progress tracking (Capterra, accessed November 2026).
Best For Toric is best for contractors whose data is spread across several PM, BIM, accounting and spreadsheet systems and who have a small BI team but no dedicated data engineers.
Strengths
- Suffolk Construction cut its Procore data latency from about 8 hours to minutes using Toric and now ingests all available Procore tables into AWS (Building Design + Construction, accessed November 2026). Suffolk said it “quickly identified Toric as a perfect fit” for raw data ingestion.
- Gamuda reported an 80% lower cost per data pipeline after using Toric to move Autodesk, Primavera and SAP data into BigQuery for Power BI (Autodesk-hosted webinar, accessed November 2026).
- Toric’s connectors across PM, BIM, accounting, CRM and cloud storage give it the broadest documented cross-system coverage in this evaluation (G2 and Capterra connector listings, accessed November 2026).
- Toric reviewers on G2 praise its ease of use, no-code automation, integrations and support (G2, accessed November 2026).
Limitations Toric trades finished construction analytics for flexible data plumbing. Toric has no built-in job-cost or WIP model, so buyers still need a BI tool and someone who understands their data schemas.
- Toric’s 4.6/5 G2 rating rests on only 11 reviews, and those reviewers criticize the documentation and occasionally slow support (G2, accessed November 2026).
- Toric’s founding year, funding, headquarters and SOC 2 status could not be verified by PlugRoute as of November 2026, which buyers should treat as a smaller-vendor risk.
- Toric may overlap with an existing Microsoft Fabric or Azure stack, and Toric cannot fix poor source data.
- PlugRoute found no Reddit discussion of Toric, and the absence of criticism should not be read as endorsement.
Verdict Toric is the most thoroughly documented option in this evaluation for moving fragmented construction data into one warehouse or BI tool. Toric ties Microsoft Power BI at 2.85. Both score 2 on job-cost depth, so Toric ranks #5 on its higher data-coverage score (C2 = 5 vs. 4).
Toric’s Suffolk and Gamuda results come from trade press and an Autodesk-hosted webinar, but Toric is infrastructure, not a finished dashboard. Buyers should pair Toric with a BI tool and verify its security credentials.
6. Microsoft Power BI: Best for In-House BI Teams Wanting Full Control
Category: General BI Platform, a general-purpose reporting and dashboard tool that contractors configure for construction data.
At a Glance
- Category: General BI Platform
- Best For: Contractors with in-house BI or data-modeling skills whose data spans several systems
- Price Range: Free; Pro $14/user/month; Premium Per User $24/user/month; F64 Fabric capacity ~$5,003–$8,410/month (2026)
- Primary Strength: Microsoft Power BI is the only product in this evaluation with published dollar pricing, and Procore, Autodesk, Trimble and Toric all connect to it as a common reporting layer.
- Biggest Limitation: Microsoft Power BI has no construction data model and requires DAX and data-engineering skills to build and maintain job-cost metrics.
- One-Line Summary: Microsoft Power BI is the only product in this evaluation with published dollar pricing and the common reporting layer other platforms connect to, but it suits only contractors with the in-house skills to build construction data models.
- Last Verified: November 2026
Overview Microsoft Power BI is a general-purpose business intelligence platform with data preparation, DAX calculations, semantic models and published per-user pricing. It suits contractors with in-house BI skills that want full control over custom job-cost and portfolio dashboards across several construction systems.
Microsoft Power BI already sits under Procore Analytics and connects to Autodesk and Trimble data, so many contractors effectively use Microsoft Power BI already.
Key Features
- Microsoft Power BI includes Power Query for data preparation, DAX for calculations, semantic models, row-level security and mobile apps (Microsoft Learn, accessed November 2026).
- Microsoft Power BI integrates with Copilot, Microsoft Fabric and OneLake (Microsoft Learn, accessed November 2026).
- Microsoft Power BI allows 8 scheduled refreshes per day on Pro and shared capacity and up to 48 on Premium, PPU and Fabric capacity (Microsoft Learn, accessed November 2026).
- Microsoft Power BI connects to Procore Analytics, the Autodesk Data Connector, Trimble Construction One Analytics and Toric (vendor documentation, accessed November 2026).
- Microsoft Power BI limits DirectQuery results to 1 million rows and 225 seconds per query (Microsoft Learn, accessed November 2026).
Best For Microsoft Power BI is best for contractors with in-house BI or data-modeling skills whose project, cost and schedule data spans several systems.
Strengths
- Microsoft Power BI is the only product in this evaluation with published dollar pricing. Microsoft raised Pro from $10 to $14/user/month on April 1, 2025, its first increase in nearly 10 years (Microsoft, 2025).
- Microsoft Power BI is the reporting engine under Procore Analytics, and Autodesk, Trimble and Toric all offer Power BI connectors, so Power BI skills transfer across construction platforms (vendor documentation, accessed November 2026).
- Microsoft Power BI scales from Free and $14 Pro seats up to Fabric capacity, which lets small contractors start at low cost (Microsoft, accessed November 2026).
- Microsoft Power BI documents its refresh, query and model limits publicly, which helps IT and BI leads plan capacity (Microsoft Learn, accessed November 2026).
Limitations Microsoft Power BI trades construction-specific readiness for flexibility. Microsoft Power BI ships no model for jobs, cost codes, commitments or WIP, so contractors need DAX and data-engineering expertise and must update the model whenever ERP schemas change.
- Microsoft Power BI requires gateways or custom extracts for on-premises ERPs, and one third-party estimate puts gateway management at ~$15,000–$30,000 a year (The Reporting Hub, 2025).
- Microsoft Power BI requires a Pro license for each viewer below F64 capacity (Microsoft’s ~$5,000+/month Fabric tier), and the Pro limit of 8 refreshes per day restricts near-real-time field dashboards.
- Microsoft Power BI limits shared-capacity imported models to 1 GB, and large contractors pulling ERP data may outgrow that limit (Microsoft Learn, accessed November 2026).
- PlugRoute found no construction-specific Microsoft Power BI case study or Reddit discussion, and the commonly reported G2 rating of ~4.5/5 could not be verified as of November 2026.
Users on r/PowerBI noted:
“A customer of mine was a big Tableau advocate and often said that it could handle bigger sets of data better than Power BI. His analogy was that Tableau was just point and shoot, whereas Power BI was ready, aim, check again then shoot. His point being that if you don’t model your data to a good star schema then Power BI struggles. I’d agree.” Posted by u/BardBearCran
Takeaway: Microsoft Power BI only performs well on top of a properly modeled star schema, which makes data-modeling skill a requirement for contractors and not an optional extra.
Verdict Microsoft Power BI is the most transparently priced reporting layer in construction analytics, but it pays off only for contractors that can build and maintain construction data models. Teams without BI staff will usually get faster results from built-in PM or ERP analytics.
Microsoft Power BI ties Toric at 2.85 and ranks #6 on the data-coverage tie-break, though it earns the highest pricing-transparency score in the evaluation (C3 = 4). Small contractors can start at $14 per user per month and should budget for a template or consultant.
7. Autodesk Forma Insights: Best for BIM-Heavy Project Risk Analytics
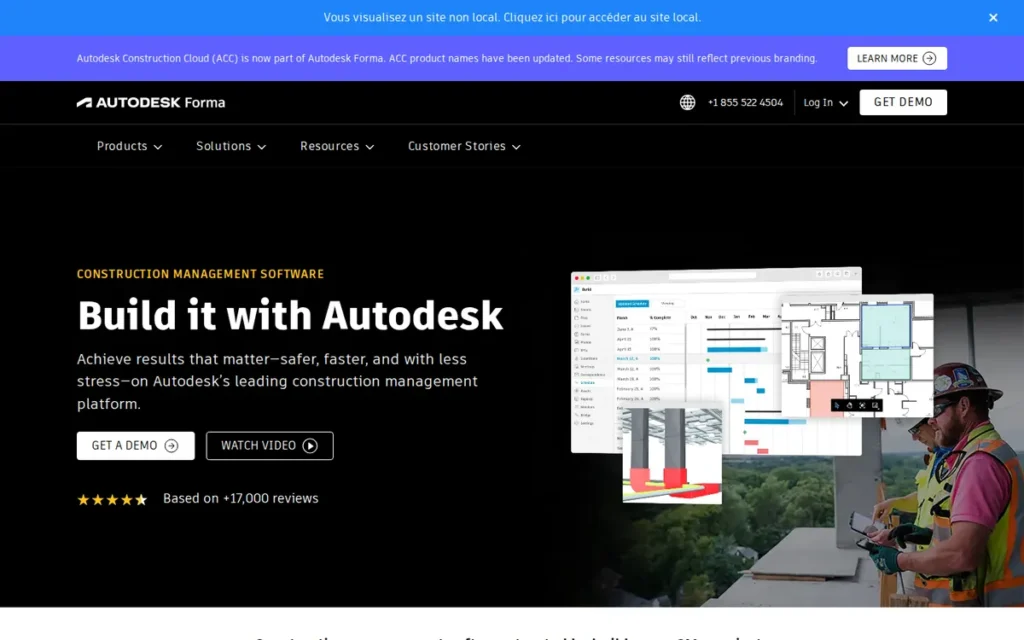
Category: PM-Native Analytics, reporting and dashboards built into a construction project management platform.
At a Glance
- Category: PM-Native Analytics
- Best For: BIM-heavy and design-build contractors and AEC firms that manage project data in Autodesk Forma Build
- Price Range: Pricing on request (Insights included in Forma bundles; Forma Build can be priced in tiers by sheet count)
- Primary Strength: Autodesk Forma Insights uses Construction IQ machine learning to rank quality, safety, design and project-controls risk across BIM-connected project data.
- Biggest Limitation: Autodesk Forma Insights offers limited job-cost depth compared with an ERP and has been renamed repeatedly.
- One-Line Summary: Autodesk Forma Insights offers the most clearly documented machine-learning risk-ranking feature in this evaluation for BIM-heavy and design-build teams, but it is not a substitute for ERP-grade job-cost analytics.
- Last Verified: November 2026
Overview Autodesk Forma Insights, formerly Autodesk Construction Cloud Insight, is the dashboard and machine-learning risk analytics layer in Autodesk’s Forma platform. It is built for BIM-heavy and design-build contractors that manage issues, RFIs, submittals, quality, safety and schedule data in Forma Build.
Autodesk rebranded Autodesk Construction Cloud as Forma on March 24, 2025 (Autodesk, 2025). Buyers should confirm that Autodesk Forma Insights quotes and entitlements use current product names.
Key Features
- Autodesk Forma Insights brings issues, RFIs, submittals, safety and quality observations, schedule data and cost-management data into project-level and cross-project dashboards (Autodesk, accessed November 2026).
- Autodesk Forma Insights includes Construction IQ, which uses machine learning to rank high-risk issues and assess subcontractor performance with no separate data-prep step (Autodesk, accessed November 2026).
- Autodesk Forma Insights works with the Data Connector, which supports scheduled cross-project exports, a Power BI connector and a public API (Autodesk Data Connector page, accessed November 2026).
- Autodesk Forma Insights can embed external Power BI dashboards through a Power BI partner card (Autodesk Data Connector page, accessed November 2026).
Best For Autodesk Forma Insights is best for BIM-heavy and design-build contractors whose project data already lives in Autodesk Forma and who want earlier warning of quality, safety and schedule risk.
Strengths
- Autodesk Forma Insights’ Construction IQ is the most clearly documented machine-learning risk feature in this evaluation. Construction IQ ranks quality, safety, design and project-controls risk (Autodesk, accessed November 2026).
- Autodesk Construction Cloud, now Forma, holds a Software Advice rating of 4.3/5 from about 2,212 reviews, and G2 lists Forma at 4.4/5 (Software Advice, accessed November 2026; G2, accessed November 2026).
- One r/ConstructionManagers user called ACC Build “the perfect long term solution” with “all the functionality” and a “much friendlier pricing model” than Procore (r/ConstructionManagers, 2024).
- Autodesk Forma Insights exports data through the Data Connector’s scheduled exports, Power BI connector and API, so teams can join Autodesk data with other systems (Autodesk Data Connector page, accessed November 2026).
Limitations Autodesk Forma Insights trades financial depth for BIM and project-risk breadth. Autodesk Forma Insights offers limited job-cost, WIP and GL analysis compared with an ERP, and customizing its native dashboards often means building in Power BI.
- Autodesk Forma Insights has been renamed repeatedly, from BIM 360 to ACC to Forma, which complicates entitlements and quotes.
- Autodesk Construction Cloud “looks good until you realize how much time and money go into managing it,” according to one practitioner, and the user who praised ACC Build also advised buying “a trainer & consultant” (r/ConstructionManagers, 2024).
- Autodesk Forma Insights has only a qualitative customer testimonial (Miron Construction) and no verified quantified Construction IQ outcome, which is why it scores 2 on documented results (C5).
- Autodesk’s figures of 2M projects and 400 integrations are vendor claims that PlugRoute could not verify independently.
Users on r/bim noted:
“Yup my firm is +1000 people and mainly use civil 3D and Revit for large infrastructure projects so it works well for us. Wouldnt recommend for smaller projects it’s overkill for something with a small scope.” Posted by u/WhoaAntlers
Takeaway: Autodesk Forma (formerly ACC) works well for large, Autodesk-centric firms on big projects but is overkill for smaller-scope work.
Verdict Autodesk Forma Insights is the closest fit in this evaluation for BIM-heavy and design-build teams that want machine-learning ranking of project risk across Autodesk data. Autodesk Forma Insights ranks last at 2.70 because its job-cost depth trails the ERP options and no quantified Construction IQ outcome was verified.
Autodesk Forma Insights’ review base (C4 = 4) is the second strongest in the set. Finance-led buyers should pair it with ERP analytics and confirm current Forma entitlements before signing.
How Much Does Construction Data Analytics Software Really Cost?
Microsoft Power BI is the only construction data analytics tool in this evaluation with published dollar pricing: Pro costs $14/user/month as of 2026. The other six tools are priced on request. Hidden costs such as viewer licenses and implementation mean the quoted price rarely equals the total cost of ownership.
| Tool | Public Pricing (Y/N) | Pricing Model | Hidden Cost to Budget For |
|---|---|---|---|
| CMiC | N | Quote-only; ~$100/user/month reported by a third party | Long implementation, no published range |
| Procore Analytics | N | Annual fee based on construction volume, unlimited users | Power BI Pro at $14/user/month for viewers |
| Trimble Construction One Analytics | N | Subscription, one-year minimum | Possible annual price increases |
| briq | N | Order Form | Reported $13,000 upfront payment |
| Toric | N | Not disclosed | Separate BI licensing |
| Microsoft Power BI | Y | Per user or capacity | Gateways, governance, modeling labor |
| Autodesk Forma Insights | N | Included in Forma bundles | Unclear entitlements after renaming |
Six of the seven construction analytics tools PlugRoute evaluated in November 2026 publish no dollar pricing. Only Microsoft Power BI does.
These are the cost figures PlugRoute could document:
- Worked example: A contractor sharing Procore Analytics dashboards with 25 viewers pays about $4,200 a year in Power BI Pro licenses alone (25 × $14 × 12), before any Procore platform fee.
- Procore: Procore charges an upfront annual fee per product based on Annual Construction Volume, with unlimited users (Procore, accessed November 2026).
- Procore, third-party estimates: CostBench reports anecdotal Procore costs of about $700–$1,000 per $1M of volume, add-ons from $6,000 and implementation of $5,000–$15,000. These figures are not specific to Procore Analytics (CostBench, accessed November 2026).
- CMiC: CMiC pricing is quote-only, and one third party reports a starting price of about $100/user/month (Capterra, accessed November 2026; SelectHub, accessed November 2026).
- Trimble: Trimble requires a one-year minimum subscription term, and its French-language subscription Q&A states that prices may rise each year (Trimble, accessed November 2026).
- briq: briq sets fees in an Order Form (briq SOW template, accessed November 2026). A “$49/month” figure listed on some directories is not a verified briq price.
- Toric: Toric publishes no pricing, and G2 lists “pricing details not currently available” (G2, accessed November 2026).
- Microsoft Power BI: Premium Per User costs $24/user/month. F64 Fabric capacity costs about $8,409.60/month pay-as-you-go or $5,002.67/month reserved (Microsoft, accessed November 2026).
- Microsoft Power BI, third-party estimates: Third-party estimates put custom governance or embedding at $50,000–$150,000 (Datalogz, 2025).
- Autodesk Forma Insights: Autodesk Forma Insights is included in Forma bundles with no standalone price, and Forma Build can be priced in tiers by sheet count (Autodesk, accessed November 2026).
What Red Flags Should I Watch For When Evaluating Construction Data Analytics Software?
PlugRoute’s 2024–2026 research documented six red flags that point to a poor fit or a hidden cost in construction data analytics software. Each red flag below is numbered, named and tied to specific evidence, so buyers can raise it directly with vendors during demos, pilots and contract negotiations.
Red Flag #1: The Quote Names a Retired or Renamed Product A quote that names a retired or renamed product may cover outdated entitlements or a version the vendor no longer develops. Four vendors in this evaluation have recently renamed or replaced analytics products, so buyers should require the current product name and version in writing before signing any contract.
- Procore has replaced Procore Analytics 1.0 with Analytics 2.0 (Procore Support, accessed November 2026).
- Autodesk BIM 360 became Autodesk Construction Cloud and then Autodesk Forma in March 2025 (Autodesk, 2025).
- briq now markets its forecasting and WIP features through “Otto” (briq, accessed November 2026).
- Trimble is folding Viewpoint analytics capabilities into Trimble Construction One (Trimble, accessed November 2026).
Red Flag #2: Dashboard Viewers Need Separate Paid Licenses Separate viewer licenses can multiply what a dashboard costs to share across a company. Procore Analytics viewers need Power BI Pro at $14/user/month (Procore Support, accessed November 2026). Microsoft Power BI requires Pro for each viewer below F64 capacity, Microsoft’s ~$5,000+/month Fabric tier (Microsoft, accessed November 2026).
Red Flag #3: Pricing Scales With Construction Volume, Not Usage Volume-based pricing can charge small contractors for work they have not yet performed. One specialty contractor reported paying over $20,000 for Procore while running a single $600,000 project after being billed on anticipated volume (r/ConstructionManagers, 2024). This is one anecdote about the whole Procore platform.
At CFMA’s typical pretax net margin of 6.7%, a $600,000 job earns about $40,200. A $20,000+ platform cost would therefore take roughly half of that profit (CFMA, 2025).
Red Flag #4: Uncapped Annual Price Increases Uncapped annual price increases make the multi-year cost of any construction analytics subscription unpredictable. Trimble’s French-language subscription Q&A states that prices may rise each year (Trimble, accessed November 2026). Buyers in every market should confirm their own terms and negotiate a written cap before signing a renewal.
Red Flag #5: Outcome Claims Come Only From Vendor-Selected Case Studies Outcome claims from vendor-selected case studies show what is possible, not what is typical for a contractor. As of November 2026, no construction analytics vendor in this evaluation had independent, analyst-validated outcome data. Every quantified result was either vendor-selected or reported in trade press.
Red Flag #6: No Plan for Field Data in an ERP-Centric Stack An ERP-centric analytics stack with no plan for field data cannot check field progress against reported status. Practitioners report that ERP-centric systems often fail field crews, leaving office and site data out of sync (r/ConstructionManagers, 2025). Buyers should name the PM data source that will supply field progress.
What Questions Should I Ask Before Choosing Construction Data Analytics Software?
Six evaluation questions expose most construction analytics fit problems before a contract is signed. Each question below is numbered and paired with the evidence that makes it worth asking. Project-controls, finance and IT leads can use the same list in vendor demos and in internal shortlisting discussions.
Question #1: What Analytics Am I Already Entitled To in My PM Tool or ERP? Contractors should audit the analytics they already own before buying anything new. Procore, Autodesk Forma and Trimble all bundle analytics that may already be in your contract. In a 2024 r/ConstructionManagers thread, an active Procore user did not know dashboards could be created (r/ConstructionManagers, 2024).
Question #2: Which System Is the Source of Truth for Job Cost? The system that holds your source of truth for job cost should decide which analytics category you choose. GL-reconciled figures usually come from an ERP, while field and project data usually come from a PM platform. Analytics built outside your source of truth add a reconciliation step to every report.
Question #3: How Fresh Is the Data and How Much History Is Kept? Data freshness and history limits differ widely between construction analytics tools. Procore Analytics 2.0 refreshes hourly but keeps only 7 days of table history. Microsoft Power BI Pro allows 8 scheduled refreshes per day and Premium capacity allows 48 (Procore Support, accessed November 2026; Microsoft Learn, accessed November 2026).
Question #4: Who Will Build and Maintain the Data Model? Someone must own the construction data model for jobs, cost codes, commitments and WIP. General BI tools and integration layers need in-house or consultant expertise to build that model. The model also needs updating whenever ERP schemas or cost codes change, so name its owner before you buy.
Question #5: Can the Vendor Produce Our Agreed Reports From Our Own Data in a Pilot? A pilot on your own data is the most reliable test of how hard reports are to build. Reviewers of CMiC and Trimble Viewpoint Vista cite trouble building reports, and briq reviewers cite a failed integration (Capterra, accessed November 2026; Software Advice, accessed November 2026).
Your own staff should build these reports during the pilot:
- The pilot should produce a WIP report for one closed job, reconciled to the general ledger.
- The pilot should produce a cost-to-complete forecast for one open job.
- The pilot should produce a change-order impact report for one active job.
Question #6: Is Our Data-Entry Discipline Good Enough for Any Tool to Help? Data-entry discipline sets the upper limit on what any construction analytics tool can deliver. As one practitioner put it, “No system magically fixes garbage data” (r/ConstructionManagers, 2025). Analytics software amplifies data quality but cannot create it, so fix entry standards before blaming the dashboards.
How Did We Rank These Construction Data Analytics Tools?
PlugRoute ranked seven construction data analytics tools on six weighted criteria, scoring each from 1 to 5 with half points allowed. The weighted total sets the rank. Ties are broken by job-cost depth (C1) first, then by data coverage (C2). Job-cost depth carries the most weight at 25%.
- C1 Job-Cost & Financial Analytics Depth (25%): Job-cost depth matters most because early variance detection protects thin margins, and the typical contractor earned a 6.7% pretax net margin (CFMA 2025 Financial Benchmarker, 2025).
- C2 Data Coverage & Cross-System Integration (20%): Data coverage matters because PM, ERP, spreadsheet and BIM data fragmentation is the core problem buyers need solved.
- C3 Pricing Transparency & Total Cost of Ownership (20%): Pricing transparency matters because hidden viewer licenses and volume-based fees hit small contractors hardest.
- C4 Review Platform Ratings & Volume (15%): Peer ratings let buyers check vendor claims, and low-volume, unverified or conflicting ratings were capped at 2–3.
- C5 Independently Documented Results (10%): Documented results matter because buyers need outcome evidence, and a score of 1 means no named, quantified outcome was found.
- C6 Implementation Effort & Practitioner Sentiment (10%): Implementation effort and support quality decide whether teams actually adopt the dashboards.
| Rank | Product | C1 | C2 | C3 | C4 | C5 | C6 | Weighted Total |
|---|---|---|---|---|---|---|---|---|
| 1 | CMiC | 5 | 3 | 2 | 3 | 3 | 1.5 | 3.15 |
| 2 | Procore Analytics | 3 | 4 | 2 | 5 | 1 | 3 | 3.10 |
| 3 | Trimble Construction One Analytics | 5 | 3 | 2 | 2 | 2 | 1.5 | 2.90 |
| 4 | briq | 4 | 3 | 2 | 3 | 2.5 | 2 | 2.90 |
| 5 | Toric | 2 | 5 | 2 | 2 | 3.5 | 3 | 2.85 |
| 6 | Microsoft Power BI | 2 | 4 | 4 | 3 | 1 | 2 | 2.85 |
| 7 | Autodesk Forma Insights | 2 | 4 | 2 | 4 | 2 | 2 | 2.70 |
Each product scored as it did for these reasons:
- CMiC scored 3.15 on top job-cost depth (C1 = 5) and the most named vendor case studies (C5 = 3), offset by negative practitioner sentiment (C6 = 1.5).
- Procore Analytics scored 3.10 on the strongest review base (C4 = 5), but it scored C5 = 1 for having no quantified outcome, the same score Microsoft Power BI received for the same gap.
- Trimble Construction One Analytics scored 2.90 with ERP-grade job cost (C1 = 5) but split review listings (C4 = 2).
- briq scored 2.90 with finance-layer job-cost depth (C1 = 4) and an unverified review count (C4 = 3).
- Toric scored 2.85 with top data coverage (C2 = 5) and trade-press outcomes (C5 = 3.5), but it has only 11 reviews (C4 = 2).
- Microsoft Power BI scored 2.85 with the only published pricing (C3 = 4), but it has no construction data model (C1 = 2).
- Autodesk Forma Insights scored 2.70 with strong reviews (C4 = 4) but limited job-cost depth (C1 = 2).
Several scores are close:
- CMiC leads Procore Analytics by 0.05 points (3.15 vs. 3.10).
- Trimble Construction One Analytics and briq tie at 2.90, and Trimble ranks higher on the C1 tie-break.
- Toric and Microsoft Power BI tie at 2.85, and Toric ranks higher on the C2 tie-break.
A half-point change on a single secondary criterion could tie or reorder #1 and #2, so treat the top two as effectively tied and decide on category fit. The seven products use five different approaches, so one ranking measures overall strength of evidence, not the right purchase for every contractor.
Evidence tiers used in this review:
- Tier 1: Tier 1 evidence is official vendor documentation or a published price.
- Tier 2: Tier 2 evidence is a third-party review platform or trade-press report.
- Tier 3: Tier 3 evidence is a vendor-selected case study or a third-party estimate.
Data points PlugRoute could not verify are labeled “not verified,” and missing data was never scored as a positive. Undated vendor pages are cited as “accessed November 2026.”
Several items were not independently re-verified at publication:
- Microsoft Power BI’s live G2 rating and review count were not re-verified.
- CMiC’s conflicting Capterra ratings (4.2 vs. 3.8) were not resolved.
- briq’s G2 review count was not verified.
- Toric’s and briq’s company, funding and security facts were not verified.
- PlugRoute did not determine whether the Building Design + Construction Suffolk article was sponsored. If it was, Toric’s C5 would fall to 3 and its total to 2.80.
If any of these items changes a score, PlugRoute will recalculate the rankings in the Q1 2027 update.
Outside the scope of this evaluation: The tools below are specialist schedule, drone, preconstruction or general BI products, or construction platforms, that came up during research but were not researched to equal depth. They are excluded rather than given thinner entries:
- SmartPM
- ALICE Technologies
- DroneDeploy
- JobTread
- Vitruvi
- ConstructConnect
- Kroo
- Domo
- Foundation Software
PlugRoute has no affiliate relationships with any company listed. Rankings are determined entirely by research data and objective evaluation criteria.
What Do Buyers Most Often Ask About Construction Data Analytics Software?
Buyers most often ask three questions about construction data analytics software, and each is answered below in 50–60 words. Each answer stands alone and draws on the same November 2026 scores and dated sources used throughout this review, so it can be read without the rest of the article.
Which construction data analytics software is best for job-cost reporting?
For job-cost reporting reconciled to the general ledger, ERP-native tools score highest in this evaluation: CMiC and Trimble Construction One Analytics both score 5/5 on job-cost depth. briq scores 4/5 as a finance layer on top of an existing ERP. Procore Analytics scores 3/5 because it lacks ERP-grade WIP and revenue recognition.
What is the best construction data analytics software for small contractors in 2026?
The lowest-cost route for small contractors in 2026 is Microsoft Power BI Pro at $14/user/month, combined with a template or consultant. Volume-based platform pricing and full ERPs can be costly at low revenue. PlugRoute did not research a tool built specifically for small contractors to equal depth in this edition, so test any option with a pilot first.
How does PlugRoute determine its construction software rankings?
PlugRoute scores every product on the same six weighted criteria, using dated sources tagged by evidence tier. Job-cost depth carries the most weight at 25%. Ties are broken by job-cost depth, then data coverage. PlugRoute publishes the full score table, labels unverified data and never scores missing evidence as a positive.
What Do Key Construction Data Analytics Terms Mean?
The most important construction analytics terms for buyers are Annual Construction Volume (a pricing basis tied to revenue), WIP reports, cost-to-complete, committed cost and GL reconciliation. These terms decide whether a tool can catch job-cost variances before margins erode and how its price will scale.
Annual Construction Volume (ACV): A pricing basis tied to the dollar value of construction work a contractor performs each year. ACV pricing can rise with revenue even if usage stays the same, which matters to firms with slow-starting jobs.
Work-in-Progress (WIP) Report: A financial report comparing billings with earned revenue on open jobs. WIP reports reveal overbilling and underbilling, and errors in spreadsheet-based WIP can misstate profit.
Cost-to-Complete: An estimate of the remaining cost needed to finish a job. Accurate cost-to-complete figures help buyers spot margin erosion before a project closes.
Committed Cost: Money already obligated through subcontracts and purchase orders but not yet paid. Tracking committed cost shows exposure that actual-cost reports miss.
GL Reconciliation: The process of matching job-cost reports to the general ledger. Reports that reconcile to the GL are more trustworthy for CFO-level decisions.
System of Record: The single application treated as the authoritative source for a type of data. Analytics are only as reliable as the system of record they draw from.
Semantic Model: A predefined layer of tables, relationships and calculations that turns raw data into business metrics. A prebuilt semantic model saves months of custom modeling work.
DAX (Data Analysis Expressions): A formula language used to build calculations in some BI platforms. DAX skills are often needed to customize dashboards, which adds staffing cost.
Refresh Cadence: How often a dashboard pulls new data from its sources. Daily refresh may suit cost reports, while field dashboards often need more frequent updates.
DirectQuery: A connection mode in which a dashboard queries the source database live instead of storing an imported copy. DirectQuery keeps data current but can be subject to row and response-time limits, which matters for large ERP datasets.
Data Gateway: Software that connects cloud reporting tools to on-premises databases. Gateways add setup and maintenance work for contractors running on-premises ERPs.
SOC 2 Type II: An independent audit report on a vendor’s security controls over a period of time. Buyers should request it before sending financial data to any vendor.
Which Construction Data Analytics Tool Is Right for You?
Key Insights
The key insight from PlugRoute’s 2026 evaluation is that your system of record matters more than rank: ERP-native tools lead on GL-reconciled job cost, PM-native tools lead on field data, and only Microsoft Power BI publishes dollar pricing. Every buyer should budget for hidden licenses and verify current product names.
- Construction data analytics buyers should start from their system of record, because analytics built on the system they already use need the least integration work.
- ERP-native tools such as CMiC tend to lead on GL-reconciled job cost, while PM-native tools such as Procore Analytics tend to lead on field and project data.
- Microsoft Power BI is the only tool in this evaluation with published dollar pricing as of November 2026, and the other six are priced on request.
- Construction analytics budgets should include viewer licenses, implementation, upfront payments and annual price increases, not just the quoted subscription.
- All outcome evidence for construction analytics in this evaluation is vendor-selected or reported by trade press, and no independent analyst validation was found as of November 2026.
- Construction analytics buyers should confirm the current product name in every quote, because Procore, Autodesk, briq and Trimble have all renamed or replaced products.
Match your situation to a category:
- If you need GL-reconciled job cost and can absorb a full implementation, consider CMiC.
- If Procore is your system of record, consider Procore Analytics and budget for Power BI Pro viewer licenses.
- If you already run Vista or Spectrum, consider Trimble Construction One Analytics.
- If spreadsheet WIP is your main pain, consider briq.
- If your data sits in many systems, consider Toric with a BI tool.
- If you have in-house BI skills and want full control, consider Microsoft Power BI.
- If your work is BIM-heavy or design-build, consider Autodesk Forma Insights.
Take these three next steps before you buy:
- Audit the analytics you already own in your PM tool or ERP.
- Shortlist two tools from the category that matches your system of record.
- Run a pilot on your own data using the report checklist in Question #5.
Read PlugRoute’s full scoring methodology above, and see our other independent construction software reviews before you build your shortlist. The next re-verification is planned for Q1 2027.
We update this guide quarterly. Last updated: November 2026.