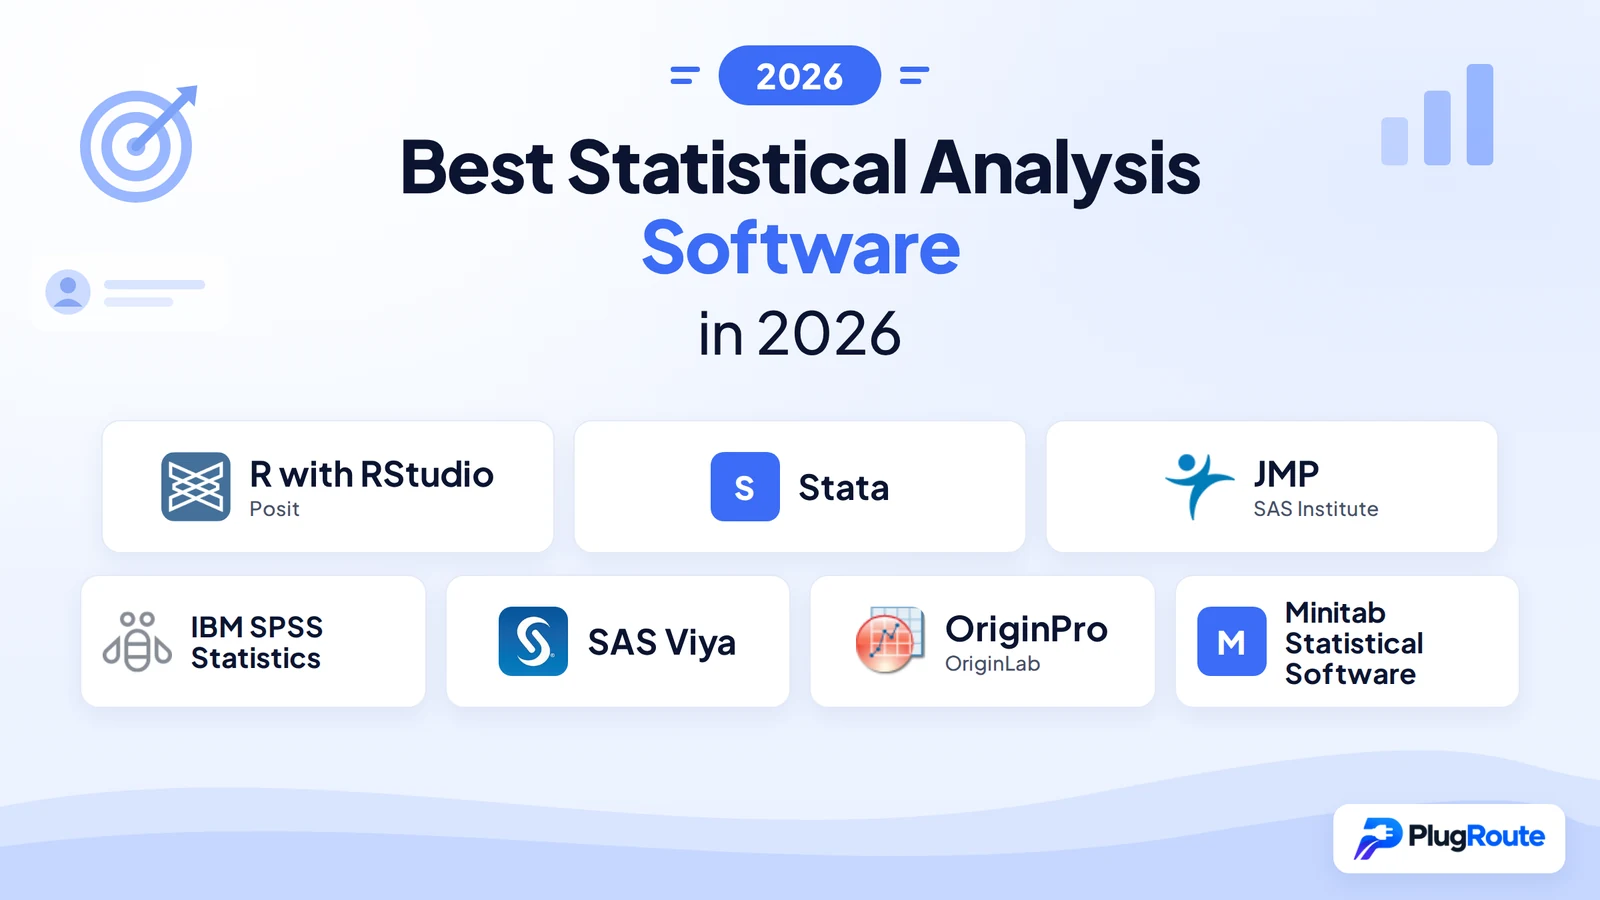
R with RStudio is the best statistical analysis software overall, free for any researcher, with 20,000+ packages covering every domain. Stata leads for academic economists and epidemiologists needing version-stable reproducibility. JMP is fastest for engineers requiring interactive visual analysis. No single tool excels in every domain; field, skill level, and budget determine the right choice.
Choosing the wrong statistical software costs real money, and in regulated environments, compliance credibility. Generic “best of” lists fail because econometrics, clinical trials, spectroscopy, and Six Sigma quality control each require purpose-built workflows that general-purpose rankings cannot map to specific needs.
PlugRoute has no affiliate relationships with any company listed in this article, rankings are determined entirely by research data and objective evaluation criteria, and no company paid for inclusion, placement, or editorial treatment.
“Learning R is not hard at all and it pays handsomely.”, multiple users, r/statistics, 2023
Takeaway: R with RStudio’s long-term career and cost value is consistently validated by statisticians who have made the programming investment.
TL;DR: Top Picks at a Glance
- R with RStudio: zero-cost, broadest statistical coverage for technically capable researchers in any field
- Stata: 40-year reproducibility guarantee; the institutional standard in academic economics and epidemiology
- JMP: fastest interactive visual analysis for engineers, scientists, and quality professionals
- IBM SPSS Statistics: 100+ point-and-click procedures for non-programmer social scientists
What Are the Three Main Categories of Statistical Analysis Software?
Statistical analysis software divides into three categories based on interface type and primary audience: Open-Source Programming Platforms (R with RStudio), Domain-Specialist GUI Platforms (JMP, Minitab, OriginPro), and Institutional Statistical Suites (IBM SPSS Statistics, Stata, SAS Viya). Identifying your category eliminates most alternatives before you compare individual features, and reveals whether a free option fully meets your needs.
- Open-Source Programming Platforms: R with RStudio (Posit). Free, extensible, and script-based, requiring programming proficiency. Best for researchers needing maximum statistical breadth, reproducibility, and $0 cost.
- Domain-Specialist GUI Platforms: JMP (SAS Institute), Minitab Statistical Software, OriginPro (OriginLab). Purpose-built visual interfaces for engineering, quality improvement, and STEM laboratory science, no programming required.
- Institutional Statistical Suites: IBM SPSS Statistics, Stata, SAS Viya. Dominant in academia, government, and regulated industries through embedded departmental standards and compliance infrastructure. Pricing ranges from $283/yr (Stata academic subscription) to enterprise-only (SAS Viya).
Before committing to any paid GUI tool: JASP and jamovi are free, open-source, GUI-based platforms powered by R that replicate SPSS’s point-and-click interface at $0 cost. Both fall outside the primary seven-tool scope of this evaluation but represent the strongest free alternative for non-programmers currently paying for IBM SPSS Statistics.
How Do the Top 7 Statistical Analysis Software Tools Compare?
The seven leading statistical analysis software platforms differ fundamentally in domain focus, interface type, pricing transparency, and institutional adoption, no single tool leads across all dimensions. The table below summarizes key decision factors; use the Quick Decision Framework immediately following to identify which one or two entries matter most to your evaluation.
| Rank | Tool | Category | Best For | One-Line Summary | Key Capabilities | Primary Strength | Key Limitation |
|---|---|---|---|---|---|---|---|
| 1 | R with RStudio | Open-Source Platform | Statisticians, data scientists, researchers across any domain | R with RStudio is the most statistically comprehensive, most institutionally adopted, and only completely free platform in this evaluation. | 20,000+ CRAN packages; R Markdown/Quarto reproducibility; multi-language integration | Permanently $0 with the broadest statistical methodology coverage of any evaluated tool | Requires programming proficiency |
| 2 | Stata | Econometric Analysis Suite | Academic economists, epidemiologists, policy researchers | Stata is the statistical software of record for academic economists, appearing in approximately 73% of American Economic Review reproducibility supplements (Vilhuber et al., 2020). | Panel data; IV regression; 40-year version-stable do-files; publication table ecosystem | 40-year version-stable do-file reproducibility guarantee; the gold standard for empirical research replication | No free tier; post-graduation license loss risk |
| 3 | JMP | Interactive Visual Discovery | Manufacturing engineers, semiconductor engineers, quality scientists | JMP is the highest-rated GUI statistical platform in this evaluation (G2 4.6/5, 500+ reviews, May 2026) and the dominant tool in semiconductor and engineering analytics. | Real-time linked graphics; DOE platform; Gage R&R; JMP Pro ML suite | Fastest interactive exploratory analysis for engineers without programming; no equivalent architecture in any other evaluated tool | Commercial pricing not publicly disclosed |
| 4 | IBM SPSS Statistics | GUI Statistical Suite | Non-programmer social scientists, psychologists, survey researchers | IBM SPSS Statistics is the most institutionally embedded GUI platform for social sciences, with 58 years of development and 100+ point-and-click procedures. | 100+ procedures; AI Output Assistant; auto-recording Syntax Editor; IBM ecosystem integration | Most accessible non-programmer statistical platform for social science research workflows | Subscription-only; GUI reproducibility model faces growing journal scrutiny |
| 5 | SAS Viya | Regulatory Enterprise Analytics | Pharmaceutical biostatisticians, FDA-regulated organizations | SAS Viya is the only statistical platform backed by a $49.9M FDA deployment contract and ICH regulatory guideline embedding (PR Newswire, January 2021). | 21 CFR Part 11; GxP audit trails; Base SAS backward compatibility; SAS Viya Copilot | Only tool with out-of-the-box FDA 21 CFR Part 11 and GxP compliance infrastructure | Enterprise-only pricing; structurally inaccessible to individual researchers |
| 6 | OriginPro | Scientific Graphing & Specialized Analysis | Physical chemists, materials scientists, STEM lab researchers | OriginPro is the publication-quality scientific graphing and specialized STEM analysis platform used at NASA, NIH, and CERN, with capabilities found in no other evaluated tool. | Peak analysis; image digitizer; lab instrument integration; batch spectral processing | Unique image digitizer and peak analysis unavailable in any other platform in this evaluation | Thin verified review base (25 G2 reviews, May 2026) |
| 7 | Minitab | Quality Improvement Platform | Six Sigma practitioners, quality engineers, manufacturing analysts | Minitab Statistical Software is the standard Six Sigma and quality improvement platform, rated G2 4.5/5 from 600+ reviews (May 2026). | AI-enhanced Assistant guided analysis; Gage R&R; 30+ SPC charts; CART/Random Forests | AI-enhanced guided analysis making statistically rigorous process improvement accessible to non-statisticians | Narrowest domain scope; commercial pricing not disclosed |
Which Statistical Analysis Software Is Right for My Use Case?
The eight most common user profiles map to distinct best-fit tools before the ranked entries. Use this table to identify the one or two entries most relevant to your decision before reading full tool assessments.
| Your #1 Priority | Recommended Tool | Why | Acceptable Alternative |
|---|---|---|---|
| Reproducible econometric or epidemiological research | Stata | ~73% AER replication supplement dominance; 40-year do-file backward compatibility (Vilhuber et al., 2020) | R with RStudio |
| Point-and-click statistics for social science surveys | IBM SPSS Statistics | 100+ procedures; AI Output Assistant; 58-year social science institutional embedding | JASP or jamovi (free, GUI, R-powered) |
| Fast interactive engineering and DOE analysis | JMP | Real-time bidirectional linked graphics; DOE platform; MSA workflows built for engineers | R with RStudio (scripting investment required) |
| Six Sigma and quality improvement | Minitab Statistical Software | Assistant guided analysis; Six Sigma certification curriculum standard | R with RStudio |
| FDA-regulated clinical trial analytics | SAS Viya | 21 CFR Part 11 compliance; $49.9M FDA BPA (PR Newswire, January 2021) | R with pharmaR validation framework |
| Spectroscopy and STEM laboratory research | OriginPro | Peak analysis; image digitizer; direct lab instrument data integration | R with RStudio (custom scripting required) |
| Maximum statistical breadth at $0 cost | R with RStudio | 20,000+ CRAN packages; 48% data professional adoption (Kaggle, 2024) | ; (R with RStudio is the free option) |
| Student or budget-constrained independent researcher | R with RStudio + JMP Student Edition | R with RStudio: $0 forever; JMP Student Edition: free for academic users at degree-granting institutions (launched 2024) | JASP, jamovi |
1. R with RStudio (Posit): Best Overall: Best Free Statistical Computing Platform for Researchers and Data Scientists
Category: Open-Source Statistical Computing Platform, a free, script-based programming environment with 20,000+ packages covering every statistical method across every research domain.
At a Glance
- Category: Open-Source Statistical Computing Platform
- Best For: Statisticians, data scientists, academic researchers, and technically proficient users across any domain who prioritize statistical breadth, reproducibility, and $0 cost over point-and-click simplicity
- Price Range: Free (R language + RStudio Desktop, permanently) | Posit Cloud: $19–$99/user/month | Posit Workbench: $9–$29/user/month | Enterprise: custom pricing | Pricing verified May 2026, posit.co/pricing
- Primary Strength: R with RStudio delivers the broadest statistical methodology coverage of any platform in this evaluation (20,000+ CRAN packages spanning every domain) at zero cost to individual users, indefinitely.
- Biggest Limitation: R with RStudio requires programming proficiency that non-technical users in social sciences, quality management, or clinical research do not have, GUI-based alternatives like IBM SPSS Statistics, JMP, or Minitab Statistical Software directly eliminate the learning curve R with RStudio imposes.
- One-Line Summary: R with RStudio is the most statistically comprehensive, most institutionally adopted, and only completely free platform in this evaluation, making it the top-ranked choice for any researcher or data scientist willing to invest in its learning curve.
- Last Verified: May 2026
Overview
R with RStudio (now published by Posit (rebranded October 2022)) is a free, open-source statistical computing platform used by 48% of data professionals globally (Kaggle, 2024), offering 20,000+ CRAN packages across every statistical domain, and is the best overall statistical analysis software for technically capable researchers who need breadth, reproducibility, and zero long-term cost.
R with RStudio is deployed at 90%+ of top statistics departments worldwide (including Stanford, Harvard, and Oxford) and at Google, Pfizer, Microsoft, Meta, Uber, and NOAA (Wikipedia, R programming language, 2024). The Posit rebrand expanded R with RStudio’s mission to support Python and Julia in the same integrated development environment, making it a multi-language data science platform rather than solely an R IDE.
Key Features
- 20,000+ CRAN Package Ecosystem: R with RStudio provides access to 20,000+ packages on CRAN, including tidyverse for data science workflows, ggplot2 for publication-quality visualization, Bioconductor (2,200+ packages) for bioinformatics, lme4 for mixed-effects models, and forecast for time series, growing approximately 1,000 packages per year, with cutting-edge methods typically reaching R with RStudio users within months of academic publication (CRAN, 2026).
- Reproducible Research Workflows: R with RStudio supports reproducibility through R scripts, R Markdown documents, and Quarto notebooks, allowing analysts to combine code, analysis prose, and rendered output in a single document that satisfies the code-submission requirements of peer-reviewed journals and institutional replication mandates.
- Posit Cloud Browser-Based Deployment: Posit Cloud provides a browser-based R and Python environment at $19–$99/user/month, enabling research teams to run analyses without local software installation, directly addressing the deployment barrier for distributed or resource-limited teams (posit.co/pricing, 2026).
- Multi-Language Integration: R with RStudio integrates natively with Python (via reticulate), SQL databases, Apache Spark (via sparklyr), and Stan for Bayesian computation, enabling R with RStudio to serve as the statistical analysis layer in multi-language data engineering pipelines without abandoning existing technology investments.
- Regulatory Validation Pathways: The R Validation Hub and pharmaR framework provide regulatory validation infrastructure for R with RStudio use in FDA-regulated clinical trial environments, with growing guidance enabling pharmaceutical organizations to use R for NDA and BLA submissions, verify current FDA guidance status with a pharmaceutical regulatory affairs reviewer before relying on this pathway.
Best For
R with RStudio is best for statisticians, academic researchers, data scientists, and graduate students across any domain, particularly those publishing in peer-reviewed journals where reproducible code submission is required, and those who need statistical methods that exceed any commercial platform’s fixed procedure list.
Strengths
- R with RStudio is used by 48% of data professionals globally (Kaggle 2024 State of Data Science and ML Survey) and deployed at 90%+ of top statistics departments worldwide including Stanford, Harvard, and Oxford, making R with RStudio the most broadly institutionally validated statistical computing environment in this evaluation, with adoption evidence spanning academic, government, and enterprise contexts simultaneously (Wikipedia, R programming language, 2024).
- R with RStudio’s 20,000+ CRAN packages: growing approximately 1,000 per year, deliver cutting-edge statistical methods within months of their academic publication, compared to the fixed procedure sets of commercial platforms updated on annual release cycles; this methodological currency is the defining advantage for researchers working at the frontier of statistical methods (CRAN, 2026).
- R with RStudio holds G2 4.6/5 from 1,200+ verified reviews (May 2026) (tied for the highest user satisfaction rating in this evaluation) alongside Capterra 4.5/5 from 450+ verified reviews (May 2026), with a G2 ease-of-visualization subscore of 4.8/5.
- R with RStudio’s permanently $0 cost eliminates the post-graduation license loss risk that IBM SPSS Statistics, Stata, and SAS Viya users face, providing career-long statistical computing access that no subscription-based alternative in this evaluation can guarantee, with no institutional affiliation required.
Limitations
- Programming Barrier: R with RStudio requires scripting proficiency: non-technical users in social sciences, quality management, or clinical research face a genuinely steep learning curve that IBM SPSS Statistics, JMP, or Minitab Statistical Software directly eliminate, and researchers who need results before completing a programming curriculum should use a point-and-click alternative first and return to R with RStudio when time permits.
- Memory Constraints at Scale: R with RStudio stores all objects in physical RAM, creating performance bottlenecks for datasets exceeding available memory, organizations working with terabyte-scale production data typically supplement R with RStudio with distributed computing frameworks (Spark via sparklyr) rather than relying on R with RStudio alone (Coursera R programming overview, 2024).
- Production Deployment Complexity: R with RStudio’s statistical analysis strength is not matched by native real-time dashboard or web application capabilities, production deployment requires additional tools (Shiny, Posit Connect) that add infrastructure complexity and cost beyond the base $0 environment.
- Regulatory Validation Overhead: For FDA-regulated clinical trial environments, R with RStudio validation requires explicit investment in frameworks (pharmaR, R Validation Hub) that SAS Viya provides as bundled infrastructure, a meaningful compliance overhead for organizations new to open-source regulatory computing.
Verdict
R with RStudio is the highest-ranked statistical analysis platform in this evaluation, earning its #1 position through the broadest statistical methodology coverage (20,000+ CRAN packages), the highest institutional adoption evidence across all sectors (48% of data professionals, 90%+ of top statistics departments, Google, Pfizer, NOAA), and the strongest individual value proposition ($0 cost, permanent, with no license loss risk) of any tool evaluated. R with RStudio is the unambiguous first choice for any researcher, statistician, or data scientist with programming proficiency or the willingness to develop it, the learning curve investment is justified by lifetime access to the most comprehensive statistical toolkit available. Non-programmers are better served by IBM SPSS Statistics for social science surveys, JMP for engineering analysis, or Minitab Statistical Software for quality improvement, but for every technically capable user, R with RStudio is the defensible, evidence-supported first choice.
2. Stata: Best for Academic Economists, Epidemiologists, and Reproducibility-First Researchers
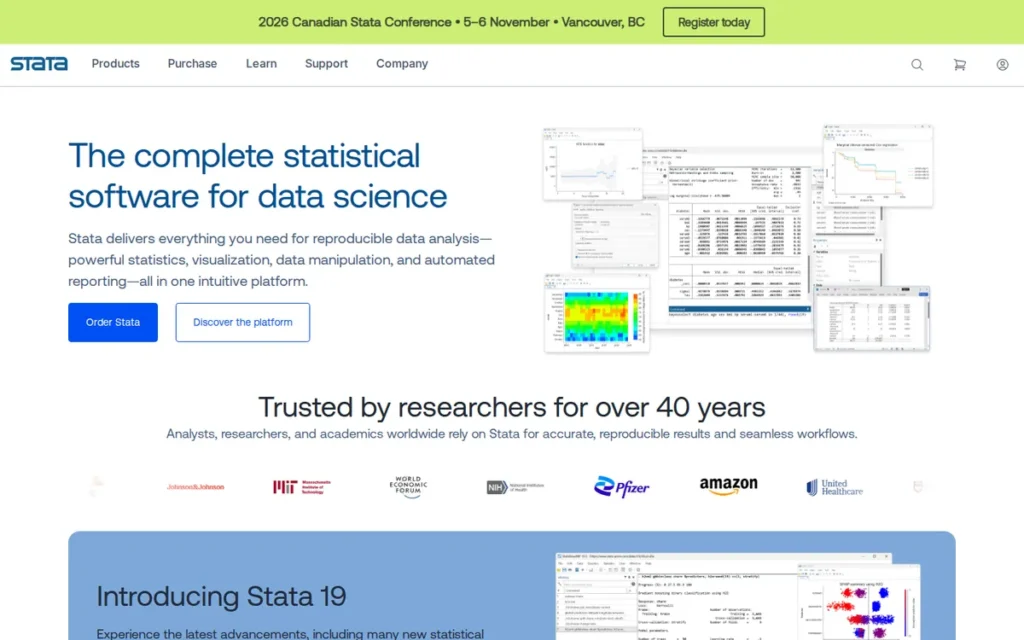
Category: Integrated Statistical and Econometric Analysis Software, a code-based platform with coherent, consistent syntax for reproducible statistical research, with dominant adoption in academic economics, epidemiology, and social science publishing.
At a Glance
- Category: Integrated Statistical and Econometric Analysis Software
- Best For: Academic economists, epidemiologists, public health researchers, and social scientists, particularly those publishing in peer-reviewed journals with replication requirements, or working at policy institutions (World Bank, IMF, RAND) where Stata is the institutional standard
- Price Range: Academic subscription: $283–$435/yr | Commercial subscription: $675–$995/yr | Academic perpetual: $745–$1,145 | Commercial perpetual: $1,775–$2,595 | No free tier | 30-day trial available | Pricing verified May 2026, stata.com/order/
- Primary Strength: Stata’s version-stable do-files guarantee identical analytical output across all past and future Stata versions, a 40-year backward-compatibility record that gives researchers career-long reproducibility insurance no other commercial statistical platform in this evaluation provides.
- Biggest Limitation: Stata has no free tier, and individual researchers without institutional license support face meaningful annual costs, with post-graduation license loss creating a structural long-term access vulnerability that R with RStudio’s permanently free model entirely eliminates.
- One-Line Summary: Stata is the statistical software of record for academic economists and epidemiologists, appearing in approximately 73% of American Economic Review reproducibility supplements (Vilhuber et al., 2020) and offering the strongest version-stable do-file reproducibility guarantee in the statistical software category.
- Last Verified: May 2026
Overview
Stata is an integrated statistical and econometric analysis software platform used by over 1 million researchers worldwide, appearing in approximately 73% of American Economic Review reproducibility supplements (Vilhuber et al., 2020) and serving as the institutional standard at the World Bank, IMF, and National Bureau of Economic Research.
Stata’s version command is the technical mechanism behind its academic dominance: a single declaration at the top of any do-file guarantees identical output in all past and future Stata versions, with do-files written in 2005 running unchanged in Stata 19 (2025). StataCorp was founded in 1985 in College Station, Texas, employs approximately 100 people, and publishes full pricing at stata.com/order/, a transparency contrast to JMP, Minitab Statistical Software, and SAS Viya (Wikipedia, Stata, 2024).
Key Features
- Version-Stable Do-File Reproducibility: Stata’s
versioncommand guarantees that any do-file beginning with a version declaration produces identical output in all future Stata versions, enabling researchers to write analytical code once and trust that published results will be exactly reproducible by any reader with any current Stata version, indefinitely, across a career of decades. - Comprehensive Econometric Toolkit: Stata provides built-in
xtregfor panel data fixed and random effects,ivregressfor instrumental variables,xtpoissonfor count panel models, andteffectsanddifffor treatment effects and difference-in-differences, all with consistent syntax conventions that transfer across command types without requiring users to learn separate APIs per method. - Stata 19 Advanced Methods: Stata 19 (2024–2025) added Bayesian variable selection, conditional average treatment effects (CATE), high-dimensional fixed effects (HDFE), machine learning integration via H2O, and Bayesian quantile regression, expanding Stata’s frontier statistical methods while maintaining complete backward compatibility with all existing do-files (stata.com/new-in-stata, 2025).
- Stata/MP Multi-Core Scalability: Stata/MP scales to 120,000 variables and 20 billion observations with multi-core parallel processing, allowing the same do-file used for a dissertation study to handle large administrative or government datasets without modification or re-coding.
- Publication Table Ecosystem: Stata’s user-written
esttabandoutreg2commands generate regression output tables formatted to common journal specifications, reducing time from statistical output to submitted manuscript in ways that manual table formatting in IBM SPSS Statistics or Excel cannot match.
Best For
Stata is best for academic economists, epidemiologists, sociologists, political scientists, and public health researchers who publish in peer-reviewed journals with replication requirements, particularly those at institutions where Stata is the faculty or departmental standard, or at policy organizations (World Bank, IMF, RAND) where Stata is embedded in institutional analytical workflows.
Strengths
- Stata appears in approximately 73% of reproducibility supplements submitted to the American Economic Review following the journal’s post-replication-crisis code disclosure policy (Vilhuber et al., 2020), the most concrete, independently verified evidence of a single tool’s dominance in a specific academic discipline available in this evaluation, reflecting academic economists’ collective judgment about the most reliable platform for reproducible research.
- Stata’s
versioncommand backward-compatibility guarantee has been maintained continuously across 40+ years (do-files written for Stata 9 in 2005 run without modification in Stata 19 in 2025) providing career-long reproducibility insurance with direct professional value for researchers whose published work may be audited or replicated years after initial publication (Stata Blog, 2020). - Stata is the institutional standard at the World Bank, International Monetary Fund, National Bureau of Economic Research, and RAND Corporation, the organizations producing the most policy-consequential economic and development research globally, providing peer validation that Stata meets the rigorous standards of the highest-scrutiny research environments in the social sciences (Wikipedia, Stata, 2024).
Limitations
- No Free Tier: Stata’s most consequential limitation is the complete absence of a free tier, individual researchers without institutional support pay $283–$435/year at academic rates, and graduate students face a structural continuity problem upon graduation that R with RStudio’s permanently free model entirely eliminates; r/statistics communities consistently identify this as the primary reason to invest in R with RStudio proficiency alongside Stata (2026).
- Limited Machine Learning Depth: Stata’s built-in machine learning capabilities (while improved in Stata 19 with H2O integration and CATE estimation) remain less developed than Python’s scikit-learn or R with RStudio’s tidymodels ecosystem, making Stata a weaker choice for researchers needing deep ML integration alongside traditional statistical methods.
- Cloud Deployment Friction: Cloud deployment of Stata requires uploading license files to cloud environments (documented for platforms like Domino Data Lab) adding administrative overhead compared to Python and R with RStudio, which deploy to cloud computing resources without license management (Domino Data Lab documentation, 2024).
- Feature Cadence Relative to R: StataCorp’s approximately 100-person team means new statistical methods sometimes take 1–2 years to reach official Stata releases after appearing in R packages, though user-written Stata commands and the SSC archive partially bridge this gap.
Verdict
Stata is the ranked #2 statistical analysis platform overall and the definitive first choice for academic economists, epidemiologists, and reproducibility-focused social scientists, anchored by approximately 73% dominance in American Economic Review replication supplements (Vilhuber et al., 2020) and institutional standard status at the World Bank, IMF, and NBER. Stata’s version-stable do-file guarantee, backward-compatible across 40+ years, provides reproducibility assurance that no other platform in this evaluation matches. Researchers outside academic economics and epidemiology, or those who cannot absorb the absent free tier, should evaluate R with RStudio as the comparable free alternative, or their domain-specific tool of choice (IBM SPSS Statistics for survey psychology, JMP for engineering, SAS Viya for regulated pharma).
“I much prefer R. That said, [Stata] is faster and very simple for standard OLS regression… The first reason you might want Stata is if all your colleagues use it.” (u/standard_error, r/statistics, 2023 (36 upvotes))
Takeaway: For technically capable users without a disciplinary mandate to use Stata, R with RStudio’s permanent $0 cost and equivalent reproducibility infrastructure make it the stronger long-term career investment.
3. JMP (SAS Institute): Best for Engineers, Scientists, and Quality Professionals
Category: Interactive Visual Statistical Discovery Software, a purpose-built, visualization-first platform for exploratory data analysis, design of experiments, and measurement system analysis, without requiring programming proficiency.
At a Glance
- Category: Interactive Visual Statistical Discovery Software
- Best For: Manufacturing engineers, semiconductor process engineers, quality professionals, pharmaceutical process scientists, and applied researchers in engineering disciplines who need fast interactive statistical exploration and DOE, and academic users qualifying for the free JMP Student Edition
- Price Range: Commercial: pricing on request (not publicly disclosed) | JMP Student Edition: free for academic users at degree-granting institutions (launched 2024; includes full JMP and JMP Pro) | Global pricing reportedly standardized 2025–2026 | Pricing verified May 2026, jmp.com/en_us/support/jmp-licensing.html
- Primary Strength: JMP’s real-time bidirectional linked graphics: connecting data tables, visualizations, and model outputs in simultaneous live interaction, delivers faster exploratory data analysis for engineers and scientists than any programming-based or sequential analysis alternative.
- Biggest Limitation: JMP does not publish commercial pricing, requiring sales engagement before budget evaluation is possible, and key machine learning features (neural networks, cross-validation) are gated behind the higher-cost JMP Pro tier rather than included in base JMP.
- One-Line Summary: JMP is the highest-rated GUI statistical platform in this evaluation (G2 4.6/5 from 500+ reviews, May 2026), the dominant tool in semiconductor and engineering analytics, and the best choice for applied scientists who need interactive visual exploration and design of experiments without writing code.
- Last Verified: May 2026
Overview
JMP is an interactive visual statistical discovery software from SAS Institute, used as the standard analytical platform in semiconductor manufacturing, pharmaceutical process development, and engineering research, rated G2 4.6/5 from 500+ verified reviews (May 2026) and chosen by engineers who need fast statistical exploration and design of experiments without programming.
JMP’s defining architecture is real-time bidirectional linked graphics: data tables, visualizations, and model outputs update simultaneously when any element is brushed, filtered, or changed, enabling exploratory insight in minutes rather than the iterative code-update cycle required by R or Python. The 2024 JMP Student Edition launch provides full JMP and JMP Pro features free to faculty, students, and academic researchers at degree-granting institutions, directly eliminating cost as a barrier for the academic engineering audience (Wikipedia, JMP, 2024).
Key Features
- Real-Time Bidirectional Linked Graphics: JMP’s Graph Builder provides drag-and-drop visualization where any filter, brush, or selection simultaneously updates the data table, all linked visualizations, and any open model reports, enabling exploratory insight discovery in minutes rather than the iterative code-update cycle required by R with RStudio or Python for equivalent analytical results (JMP capabilities, 2026).
- Design of Experiments Platform: JMP’s DOE platform generates custom, optimal, and definitive screening designs with integrated analysis workflows, guiding engineers from experiment design through response surface optimization without requiring statistical expertise, making JMP the fastest DOE workflow for applied scientists in engineering and pharmaceutical process development.
- JMP Pro Machine Learning Suite: JMP Pro adds neural networks, CART, random forests, bootstrap forest, boosted tree, and k-fold cross-validation with visualization-first model diagnostics, extending JMP’s interactive approach into predictive modeling for researchers who need machine learning alongside traditional statistical methods.
- Measurement Systems Analysis Platform: JMP provides Gage R&R, expanded Gage R&R, attribute agreement analysis, and the EMP (Evaluating the Measurement Process) method, the gold-standard workflow for quantifying measurement system quality in manufacturing and pharmaceutical environments, directly supporting Six Sigma, ISO 9001, and IATF 16949 requirements.
- JMP Scripting Language (JSL): JMP’s Scripting Language enables workflow automation, custom analysis creation, and reproducible analytical pipelines, blending JMP’s point-and-click simplicity with the programmability needed for batch processing and institutional standardization, without requiring users to learn a general-purpose programming language.
Best For
JMP is best for manufacturing engineers, semiconductor process engineers, pharmaceutical process scientists, Six Sigma practitioners, and applied researchers in engineering disciplines, particularly those who need the fastest path from raw data to visual insight and designed experiment results, and academic users at institutions where the free JMP Student Edition eliminates cost as a barrier to accessing full JMP and JMP Pro functionality.
Strengths
- JMP achieves G2 4.6/5 from 500+ verified reviews (May 2026) (tied for the highest user satisfaction rating in this evaluation alongside R with RStudio) reflecting strong and consistent user endorsement from engineers and scientists across JMP’s core application domains.
- A former data scientist and current semiconductor process engineer documented that “in 95% of common EDA/MSA/SPC tasks, JMP is miles quicker and easier than the same task with Python”, a practitioner comparison from someone proficient in both platforms, providing specific evidence of JMP’s speed advantage for structured engineering analysis from a user with genuine basis for comparison (u/kngsgmbt, r/Semiconductors, 2025).
- JMP’s Texas Instruments customer case study documents enterprise-scale deployment at one of the world’s largest semiconductor companies for yield analysis and process optimization, the most specific named enterprise adoption evidence available for JMP’s core engineering audience, validating real-world deployment value at institutional scale.
- JMP 19 (2025) added a Bayesian Optimization platform and Process Screening platform for environmental monitoring, continuing JMP’s consistent annual feature expansion while maintaining the visual-first interface central to its engineering value proposition (JMP new release, 2025).
Limitations
- Pricing Opacity: JMP’s most consequential limitation is its undisclosed commercial pricing, requiring prospective buyers to enter a sales process before understanding total investment, a friction point that R with RStudio, Stata, and OriginPro avoid with published pricing tables and that disadvantages budget-constrained organizations evaluating JMP against free or transparently priced alternatives.
- JMP Pro Feature Gating: JMP Pro’s gating of key machine learning features (neural networks, cross-validation, text analysis) means that base JMP purchasers may discover mid-workflow that their analytical needs require an additional upgrade, a tiering architecture that has frustrated users who assumed full statistical coverage at the base license level.
- Corporate License Attrition Risk: Corporate license cost-cutting is an active documented threat to JMP retention, multiple r/Semiconductors community members (2025–2026) report organizations switching to Python or Minitab Statistical Software as cost-reduction measures, with affected engineers describing the Minitab switch as “a major downgrade and everyone hates the switch.”
- Specialist Ecosystem Limits: JMP’s smaller specialist ecosystem means that highly specialized methods (frontier econometric estimators, advanced Bayesian hierarchical models, or custom bioinformatics pipelines) require switching to R with RStudio or Python, making JMP most powerful as a primary tool for structured engineering analysis rather than a universal statistical platform.
Verdict
JMP is the ranked #3 statistical analysis platform overall and the definitive first choice for engineers, semiconductor professionals, and applied scientists who value fast interactive visual exploration over programming flexibility, earning G2 4.6/5 from 500+ verified reviews (May 2026), documented enterprise adoption at Texas Instruments, and consistent practitioner endorsement from the semiconductor industry. JMP’s real-time bidirectional linked graphics architecture delivers exploratory insight faster than any programming-based alternative for structured engineering analysis workflows. Academic engineers and scientists should investigate the free JMP Student Edition (launched 2024) before evaluating any paid alternative.
“I love JMP and most companies use it. It is a fantastic tool to learn, it even has its own scripting language. Makes data analysis and visualization a breeze.” (u/Ifellinahole, r/Semiconductors, October 2025 (29 upvotes))
Takeaway: Engineers proficient in both Python and JMP consistently report JMP is substantially faster for structured EDA, DOE, and MSA workflows, making it worth evaluating even for users already comfortable with free alternatives.
4. IBM SPSS Statistics: Best for Non-Programmer Social Scientists, Psychologists, and Survey Researchers
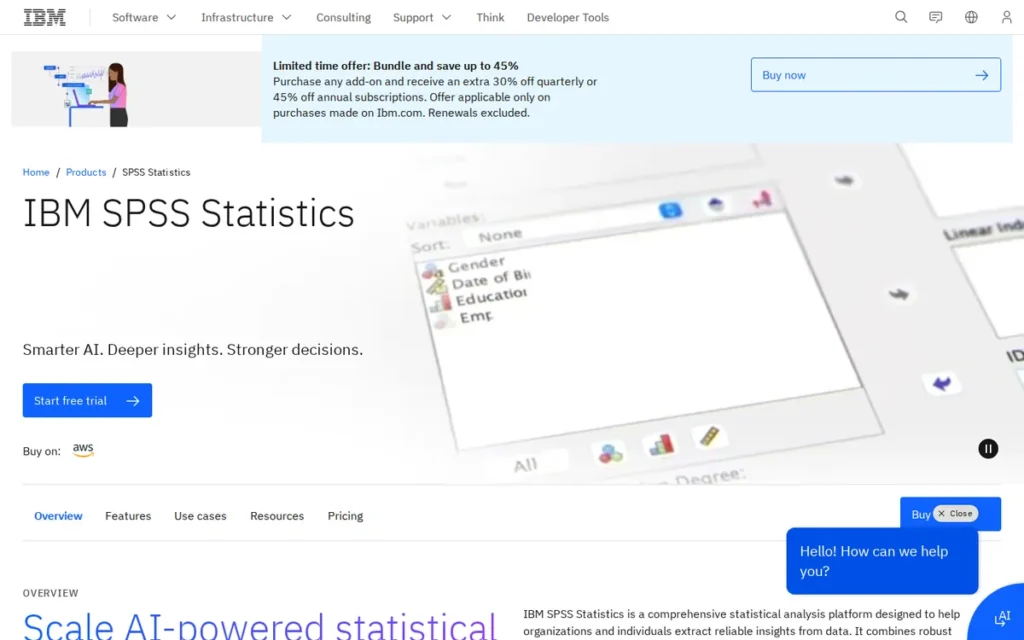
Category: GUI-Based Statistical Analysis Platform, a point-and-click interface for comprehensive statistical testing designed for academic and research users who need rigorous analysis without programming proficiency.
At a Glance
- Category: GUI-Based Statistical Analysis Platform
- Best For: Non-programmer social scientists, psychologists, survey researchers, public health analysts, and students at institutions with IBM Academic Initiative access, especially those whose advisors, departments, or collaborators use SPSS as the institutional standard
- Price Range: Commercial: approximately $99–$299/month ($1,200–$3,600/yr by tier) | Academic (IBM Academic Initiative): approximately $50–$200/yr (~80–90% discount, institution-specific, contact IBM) | Subscription-only (no perpetual license for new purchases) | Pricing verified May 2026, ibm.com/products/spss-statistics/pricing
- Primary Strength: IBM SPSS Statistics provides 100+ statistical procedures accessible via point-and-click dialogs with an AI Output Assistant that translates complex results into plain language, making it the most accessible non-programmer statistical platform for social science research workflows.
- Biggest Limitation: IBM SPSS Statistics’ shift to subscription-only licensing has significantly increased long-term costs for individual academics, while the GUI-first reproducibility model faces growing scrutiny from journals and funders that now require submitted replication code, a gap that Stata’s do-files and R with RStudio’s scripts address more robustly.
- One-Line Summary: IBM SPSS Statistics is the most institutionally embedded GUI-based statistical platform for social sciences, with 58 years of continuous development, 100+ point-and-click procedures, and AI-assisted result interpretation, at a subscription cost that is its primary competitive disadvantage against free alternatives.
- Last Verified: May 2026
Overview
IBM SPSS Statistics is a GUI-based statistical analysis platform developed since 1968 and used by non-programmer researchers across social sciences, psychology, public health, and business, providing 100+ statistical procedures via point-and-click dialogs and holding 1,200+ verified G2 reviews (May 2026) as the most broadly reviewed GUI statistical platform in this evaluation.
IBM SPSS Statistics includes an AI Output Assistant that automatically translates complex statistical output into plain-language explanations, a dual interface pairing GUI dialogs with a Syntax Editor that auto-generates reproducible code from every click, and IBM Academic Initiative discounts of approximately 80–90% from commercial rates for qualifying students and faculty (Crescointl, 2024). IBM acquired SPSS Inc. for approximately $1.2 billion in 2009; the subsequent shift to subscription-only licensing has generated significant controversy among long-term academic users (TechTarget, 2024).
Key Features
- 100+ Point-and-Click Statistical Procedures: IBM SPSS Statistics provides 100+ procedures across 19 analytical categories, including regression (linear, logistic, ordinal, multinomial, Cox), ANOVA, MANOVA, factor analysis, cluster analysis, discriminant analysis, structural equation modeling (via AMOS), survival analysis, decision trees, neural networks, and Bayesian statistics (added v25+), all accessible via point-and-click dialogs without writing code.
- AI Output Assistant: IBM SPSS Statistics’ AI Output Assistant automatically generates plain-language explanations of statistical results, reducing the interpretation barrier for researchers who can design and run analyses but struggle to extract actionable conclusions from dense output tables, directly addressing the most common frustration reported by non-expert users (Crescointl, 2024).
- Auto-Recording Syntax Editor: IBM SPSS Statistics’ Syntax Editor automatically records every GUI action as a reusable syntax command, allowing researchers to begin with point-and-click exploration and graduate to scripted, reproducible workflows, a progressive disclosure architecture that uniquely serves the beginner-to-intermediate research methods training transition (IBM SPSS UX redesign portfolio, 2024).
- IBM Ecosystem Integration: IBM SPSS Statistics integrates with R and Python via extension plug-ins and connects to IBM Watson Studio and IBM Cloud Pak for Data, positioning IBM SPSS Statistics as an entry point into IBM’s broader AI analytics ecosystem for enterprise organizations already invested in IBM infrastructure.
- Survey Research Workflow Support: IBM SPSS Statistics supports survey research through complex sampling data preparation (weighting, survey-adjusted standard errors), cross-tabulations, chi-square tests, and ANOVA by survey group, making it the functional default for large-scale survey methodology research in social sciences globally.
Best For
IBM SPSS Statistics is best for non-programmer researchers in psychology, sociology, education, political science, public health, and business, particularly graduate students and faculty at institutions participating in IBM Academic Initiative licensing, and researchers whose advisors or departments use IBM SPSS Statistics as the institutional standard where matching tool environments matters for workflow compatibility.
Strengths
- IBM SPSS Statistics has been in continuous active development since 1968: 58 years, making it the longest-established major statistical software in this evaluation, with institutional embedding across hundreds of psychology, sociology, public health, and business programs globally, constituting the most extensive academic social science adoption footprint of any platform in this comparison (TechTarget, 2024).
- IBM SPSS Statistics holds G2 4.4/5 from 1,200+ verified reviews (May 2026) and Capterra 4.5/5 from 800+ reviews (May 2026), the highest review volume among GUI-based platforms in this evaluation, generating extensive peer support resources and discipline-specific guidance not available at comparable depth for any free alternative.
- IBM SPSS Statistics’ AI Output Assistant automatically generates plain-language explanations of statistical results, directly addressing the most common non-expert frustration of running analyses but struggling to interpret dense output tables, reducing dependence on statistical consultants for routine research interpretation (IBM SPSS UX redesign portfolio, 2024).
Limitations
- Subscription-Only Pricing and License Loss Risk: IBM SPSS Statistics’ most consequential limitation is its subscription-only pricing, commercial users pay $1,200–$3,600/year with no pathway to perpetual ownership, and while IBM Academic Initiative discounts are substantial (~80–90% off), access depends on institutional enrollment that ends upon graduation, creating a post-graduation access vulnerability that R with RStudio’s permanently free model entirely eliminates.
- GUI-First Reproducibility Scrutiny: In the post-replication-crisis academic environment, IBM SPSS Statistics’ GUI-first reproducibility model (auto-generating syntax from GUI actions but not enforcing code-first discipline) is increasingly viewed as less rigorous than Stata’s do-file standard or R with RStudio’s script-based reproducibility, particularly for journals now requiring submitted replication packages.
- Institutional Inertia Adoption Pattern: Reddit’s r/statistics community (2026) consistently identifies IBM SPSS Statistics adoption as driven by institutional inertia and advisor preference rather than independent feature-based selection, a dynamic that carries genuine long-term adoption risk as R with RStudio and Python become more standard in graduate curricula and new cohorts of researchers choose their own tools.
Verdict
IBM SPSS Statistics is the ranked #4 statistical analysis platform overall and the most accessible GUI-based tool for non-programmer social scientists, earning its position through 58 years of institutional embedding, 100+ point-and-click statistical procedures, the highest review volume among GUI platforms (1,200+ G2 reviews, May 2026), and an AI Output Assistant that lowers the result-interpretation barrier more effectively than any competing platform. IBM SPSS Statistics is the practical first choice for psychology, sociology, education, and public health researchers at institutions with IBM Academic Initiative licensing whose advisors use IBM SPSS Statistics as the departmental standard. Researchers who have genuine tool choice and any tolerance for programming should evaluate R with RStudio first, it covers the same statistical procedures and more at $0 cost. IBM SPSS Statistics’ subscription-only pricing model and GUI-first reproducibility approach are genuine disadvantages relative to R with RStudio and Stata that independent evaluators should weigh honestly against the real value of point-and-click accessibility.
5. SAS Viya: Best for Pharmaceutical, Clinical Trial, and FDA-Regulated Enterprise Analytics
Category: Enterprise Analytics and Regulatory Statistical Computing Platform, a cloud-native, fully governed analytics system for organizations requiring FDA 21 CFR Part 11 compliance, GxP audit trails, and validated statistical computing environments in regulated industries.
At a Glance
- Category: Enterprise Analytics and Regulatory Statistical Computing Platform
- Best For: Pharmaceutical biostatisticians, clinical data managers, regulatory affairs professionals, large government analytics agencies, and enterprise organizations in FDA-regulated environments where 21 CFR Part 11 compliance, GxP audit trails, and validated computing environments are non-negotiable
- Price Range: Enterprise pricing on request only: not publicly disclosed | FDA contract reference: $49.9M multi-year BPA for multi-division government deployment (January 2021) | SAS Academic Program at institution-specific pricing | No public individual or team pricing | Pricing verified May 2026
- Primary Strength: SAS Viya is the only statistical platform in this evaluation with a $49.9M FDA deployment agreement, SAS algorithm embedding in ICH regulatory guidelines, and out-of-the-box 21 CFR Part 11 compliance infrastructure, making it the institutional standard for FDA-regulated clinical trial analytics.
- Biggest Limitation: SAS Viya’s pricing is completely opaque and enterprise-scale (requiring organizational sales engagement before any cost evaluation is possible) structurally excluding individual researchers, small teams, and most academic users without institutional site licenses.
- One-Line Summary: SAS Viya is the only statistical platform backed by a $49.9M FDA deployment contract and ICH regulatory guideline embedding, making it the required institutional standard for pharmaceutical NDA and BLA submissions in regulated environments, at an enterprise price point that individual researchers cannot access independently.
- Last Verified: May 2026
Overview
SAS Viya is a cloud-native enterprise analytics and statistical computing platform, the only software in this evaluation deployed under a $49.9M FDA Blanket Purchase Agreement (PR Newswire, January 2021) with embedded algorithm citations in ICH E9 clinical trial guidelines, making it the institutional standard for pharmaceutical biostatistics and FDA-regulated regulatory submissions.
SAS Viya maintains full backward compatibility with all Base SAS 9 code: PROC steps, DATA steps, and SAS macro language programs continue to run without modification in the Viya cloud environment, allowing organizations to migrate validated historical SAS code libraries without expensive re-validation (OCS Life Sciences, 2024). SAS Viya’s pricing is completely opaque and enterprise-only, individual researchers outside institutional site license arrangements effectively cannot access SAS Viya independently.
Key Features
- 21 CFR Part 11 and GxP Compliance Infrastructure: SAS Viya provides out-of-the-box 21 CFR Part 11 electronic records compliance and GxP audit trail infrastructure, with automated Installation Qualification tools (viyapytools and SAS OQ containers) enabling validated Statistical Computing Environment deployment for clinical trial data, the most complete regulatory compliance infrastructure of any platform in this evaluation (OCS Life Sciences, 2024).
- Base SAS 9 Backward Compatibility: SAS Viya maintains full backward compatibility with Base SAS 9 code (all PROC steps, DATA steps, and SAS macro language programs continue to run unchanged in the Viya cloud environment) allowing organizations to migrate decades of validated analytical code to cloud infrastructure without the expensive re-validation that rewriting in Python or R with RStudio would require.
- SAS Viya Copilot: SAS Viya Copilot (added 2025–2026) provides AI-assisted analytics including natural language task completion, automated code generation, and intelligent visualization recommendations, extending SAS Viya’s enterprise analytics capability with an AI layer that maintains audit trail compliance requirements critical in regulated analytical environments.
- Governed Automated Machine Learning: SAS Viya’s automated ML platform handles feature engineering, model selection, and hyperparameter tuning with governance tracking, enabling enterprise teams to develop ML models within a documented, auditable workflow, a compliance requirement in regulated analytics environments where model provenance must be demonstrated to regulators.
- International Data Privacy Compliance: SAS Viya holds EU-U.S. Data Privacy Framework (DPF) self-certification for cross-border data transfers, supports FDA-required data residency controls, and scales across cloud, on-premise, and hybrid deployments, addressing the complex data governance requirements of international pharmaceutical clinical trials spanning multiple regulatory jurisdictions (SAS Trust Center, 2024).
Best For
SAS Viya is best for pharmaceutical companies and contract research organizations preparing FDA NDA or BLA submissions, clinical biostatisticians whose work requires 21 CFR Part 11 compliance, large government analytics departments (FDA, NIH, CDC), and enterprise organizations with existing SAS 9 code investments requiring cloud migration without analytical re-validation.
Strengths
- The U.S. Food and Drug Administration signed a $49.9M Blanket Purchase Agreement with SAS Institute in January 2021, deploying SAS Viya across FDA’s Center for Drug Evaluation and Research and other divisions, the single most concrete evidence of government-scale validated deployment in this evaluation, and an objective validation of SAS Viya’s regulatory compliance infrastructure that no other platform in this comparison can cite (PR Newswire, January 2021).
- SAS statistical methods are cited as reference implementations in ICH E9 (Statistical Principles for Clinical Trials) and related international regulatory guidelines, meaning pharmaceutical companies using SAS Viya-validated methods in NDA and BLA submissions face lower regulatory scrutiny than those using equivalent methods from other platforms, a structural compliance advantage built through 40+ years of FDA institutional partnership.
- SAS Viya’s backward compatibility guarantee allows organizations to migrate their entire validated SAS code library (PROC procedures, DATA steps, and SAS macro programs representing decades of analytical investment) to Viya cloud infrastructure without modification or re-validation, a migration safety net with no equivalent among competing enterprise analytics platforms (OCS Life Sciences, 2024).
Limitations
- Enterprise-Only Pricing Exclusion: SAS Viya’s most consequential limitation for the majority of statistical software evaluators is completely opaque, enterprise-only pricing, structurally inaccessible to individual researchers, small academic teams, startups, and organizations without existing enterprise SAS relationships; the $49.9M FDA contract describes a deployment scale irrelevant to any individual or small-team research context.
- Career Skill Development Barrier: R/statistics and r/datascience communities (2026) consistently note that learning SAS Viya outside an employer-provided license is practically impossible, creating a career-skill asymmetry where pharma-valuable SAS proficiency can only be developed in institutional contexts rather than through independent self-study.
- Viya Migration Complexity: SAS Viya migration from SAS 9 requires significant quality management system and SOP adjustments, OCS Life Sciences documented that “no prior validated Viya SCE cases existed” when they began their implementation, indicating that even committed enterprise SAS customers face meaningful friction requiring specialized consulting engagement (OCS Life Sciences, 2024).
- Open-Source Regulatory Encroachment: The R Validation Hub and pharmaR framework are actively building FDA recognition pathways that could gradually erode SAS Viya’s compliance moat, a trajectory organizations making long-term infrastructure decisions should monitor before assuming SAS Viya’s regulatory advantages are permanent.
Verdict
SAS Viya is the ranked #5 statistical analysis platform overall but the definitive first choice for pharmaceutical biostatisticians, clinical trial researchers, and regulatory analytics professionals in FDA-regulated environments, anchored by a $49.9M FDA Blanket Purchase Agreement (PR Newswire, January 2021) and ICH regulatory guideline embedding that establishes SAS Viya as the institutional standard for drug evaluation analytics in a way no competitor can currently match. For any organization outside FDA-regulated clinical trial contexts, SAS Viya’s pricing opacity, enterprise-only access model, and steep implementation requirements make it a poor fit relative to R with RStudio, Stata, JMP, or IBM SPSS Statistics. Researchers who need SAS skills for pharmaceutical careers should seek institutional or employer-provided access rather than attempting individual purchase, and should simultaneously develop R with RStudio proficiency as a transferable, always-accessible statistical skill.
6. OriginPro (OriginLab): Best for Physical Scientists, Chemists, and STEM Laboratory Researchers
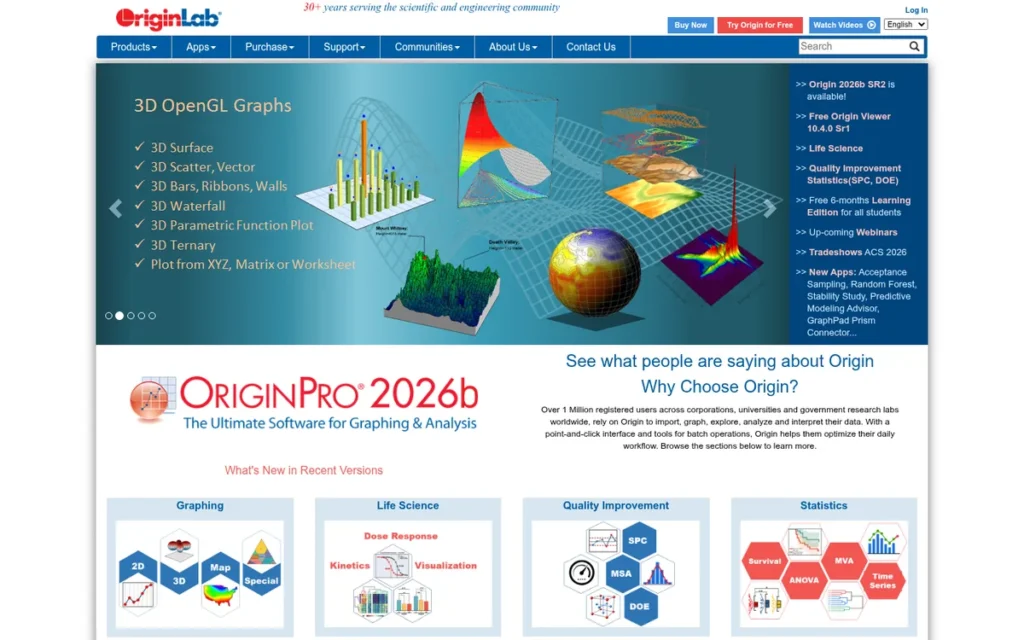
Category: Scientific Graphing and Specialized Statistical Analysis Platform, a laboratory-oriented tool for publication-quality visualization, peak and signal analysis, and STEM instrument data workflows, used by physical and chemical scientists globally.
At a Glance
- Category: Scientific Graphing and Specialized Statistical Analysis Platform
- Best For: Physical scientists, chemists, materials scientists, engineers, and STEM laboratory researchers who need publication-quality scientific graphs, peak and spectral analysis, direct lab instrument data integration, and batch analysis of instrument datasets, without writing programming code
- Price Range: Academic subscription: Origin $200/yr | OriginPro $300/yr | Commercial subscription: Origin $795/yr | OriginPro $1,095/yr | Academic perpetual: Origin $400 | OriginPro $600 | Annual maintenance (perpetual): Origin $299/yr | OriginPro $399/yr | Free 21-day trial | Pricing verified May 2026, originlab.com/store/pricing
- Primary Strength: OriginPro provides purpose-built peak analysis, spectroscopy batch workflows, lab instrument data integration, and an image digitizer for extracting data from published figures, capabilities no other platform in this evaluation includes natively, at an academic price of $200–$300 per year.
- Biggest Limitation: OriginPro has the lowest independently verified review volume in this evaluation (25 G2 reviews, 15 Capterra reviews as of May 2026), limiting the depth of community-wide user satisfaction evidence available to independent evaluators compared to tools with hundreds or thousands of verified reviews.
- One-Line Summary: OriginPro is the publication-quality scientific graphing and specialized STEM analysis platform used at NASA, NIH, and CERN, offering unique peak analysis, lab instrument integration, and image digitization capabilities at a transparent academic price of $200–$300 per year.
- Last Verified: May 2026
Overview
OriginPro is a scientific graphing and specialized statistical analysis platform used by physical scientists, chemists, materials scientists, and STEM laboratory researchers at institutions including NASA, NIH, and CERN, providing purpose-built workflows for spectroscopy, chromatography, peak analysis, and publication-quality figure generation that no other platform in this evaluation includes natively (OriginLab testimonials, 2026).
OriginPro’s two most distinctive capabilities are its image digitizer (extracting quantitative data from published graphs and instrument images across Cartesian, polar, and ternary coordinate systems, found in no other major statistical platform in this comparison) and its native laboratory instrument data integration for direct import from spectrometers, chromatographs, and XRD systems. OriginLab Corporation was founded in 1992 by Dr. Shaomin Xu in Northampton, Massachusetts, employs approximately 50 people, has maintained independent private ownership for 33+ years, and publishes full pricing at originlab.com/store/pricing (Wikipedia, Origin software, 2024).
Key Features
- Image Digitizer: OriginPro’s built-in image digitizer extracts quantitative data from published graphs, photographs, and instrument screenshots via manual or automatic tracing across Cartesian, polar, and ternary coordinate systems, enabling researchers to include literature data in meta-analyses even when raw data files are unavailable, a capability found in no other major statistical platform in this evaluation (OriginLab features, 2026).
- Batch Analysis Templates: OriginPro provides native batch analysis templates that allow laboratory scientists to apply identical workflows (peak fitting, baseline correction, spectral deconvolution) to entire folders of instrument data files automatically without scripting, dramatically accelerating repetitive laboratory data processing across large sample sets.
- Peak Analysis and Spectroscopy Platform: OriginPro’s peak analysis platform includes baseline correction (automatic and manual), deconvolution, batch peak integration and fitting, and Partial Least Squares-Discriminant Analysis (PLS-DA), the gold-standard analytical workflow for spectroscopy, chromatography, and X-ray diffraction data in chemistry and materials science, unavailable natively in any other GUI-based platform in this evaluation.
- Lab Instrument Integration with Python/R Console: OriginPro integrates natively with laboratory instruments for direct data import, supports NetCDF and GeoTIFF for remote sensing datasets, and connects to Python and R with RStudio via embedded consoles, enabling hybrid workflows where OriginPro handles specialized lab data visualization while Python or R manages upstream computational analysis (OriginLab 2026 features).
- Annual Scientific Graph Updates with AI Flash Fill: OriginPro 2026 added Graph Slicer for interactive graph-based data filtering, Graph Styles for systematic figure format management across projects, periodic data refresh for live instrument monitoring, and AI-assisted Flash Fill for automated spreadsheet data pattern recognition, continuing OriginLab’s consistent annual feature development cadence across 33+ years (OriginLab 2026 new features).
Best For
OriginPro is best for physical chemists, materials scientists, spectroscopists, electrochemists, physicists, and STEM laboratory researchers who need to process and visualize data from analytical instruments and produce publication-quality figures for chemistry, physics, and materials science journals, particularly those at institutions where OriginPro is a departmental standard or where the instrument-to-publication workflow must be efficient without custom scripting.
Strengths
- OriginPro is deployed at NASA, NIH, CERN, the Max Planck Institute, MIT, Stanford, and major pharmaceutical companies including Pfizer, Merck, and Johnson & Johnson OriginLab testimonials page, 2026, an institutional adoption pattern spanning government space agencies, nuclear research organizations, and elite research universities confirming OriginPro’s position as a publication-figure standard in physical and chemical sciences globally. Note: this customer list is sourced from OriginLab’s own testimonials page and has not been independently verified through third-party sources.
- OriginPro’s image digitizer: extracting quantitative data from published graphs and instrument images across multiple coordinate systems, is the single most unique capability in this evaluation, with no equivalent in R with RStudio, Python, IBM SPSS Statistics, Stata, JMP, SAS Viya, or Minitab Statistical Software, providing irreplaceable utility in literature-based meta-analysis and historical data extraction workflows (OriginLab features, 2026).
- OriginLab has maintained a consistent annual release cycle since 1992: 33+ years of continuous development under independent private ownership, with the Origin 2026 release adding Graph Slicer, Graph Styles, and AI Flash Fill, validating product sustainability and long-term institutional reliability for researchers making multi-year software investment decisions (OriginLab 2026 new features).
Limitations
- Thin Verified Review Evidence: OriginPro’s most consequential limitation for independent evaluators is its comparatively thin verified review base, G2 provides 25 reviews and Capterra 15 reviews as of May 2026, dramatically fewer than R with RStudio (1,200+ G2), IBM SPSS Statistics (1,200+ G2), or Minitab Statistical Software (600+ G2), reflecting OriginPro’s specialized scientific user community rather than product quality issues, but limiting the depth of independently verifiable user sentiment available to evaluators.
- Visualization-Primary Role in Hybrid Workflows: In STEM laboratory research, OriginPro is frequently used for final figure generation rather than as the primary analysis environment, r/AskAcademia discussions (2023) consistently describe hybrid workflows where Python or R with RStudio handles upstream computational analysis while OriginPro handles publication-quality figure formatting, suggesting OriginPro’s strongest competitive moat is scientific visualization rather than statistical analysis per se.
- Domain Specificity Outside STEM: For research needs outside STEM laboratory disciplines (econometrics, social science surveys, clinical trials, or quality control) OriginPro lacks the specialized workflow support that Stata, IBM SPSS Statistics, SAS Viya, and Minitab Statistical Software provide for those domains, making it a poor general-purpose choice despite its domain excellence.
Verdict
OriginPro is the ranked #6 statistical analysis platform in this evaluation and the best-fit choice for STEM laboratory researchers, particularly in physical chemistry, materials science, spectroscopy, and electrochemistry, providing a unique combination of publication-quality scientific graphing, peak analysis, lab instrument data integration, and image digitization capabilities that no other platform in this evaluation includes. OriginPro’s academic pricing at $200–$300 per year is among the most transparent and competitive in the paid statistical software market for its specialized audience. Researchers outside STEM laboratory disciplines will find better domain fit in R with RStudio (broadest coverage, free), Stata (economics reproducibility), IBM SPSS Statistics (survey psychology and public health), JMP (engineering and DOE), SAS Viya (pharma and regulated industries), or Minitab Statistical Software (quality improvement and Six Sigma), OriginPro earns its #6 position through specialized domain excellence rather than breadth.
7. Minitab Statistical Software: Best for Six Sigma Practitioners and Quality Improvement Professionals
Category: Quality Improvement and Statistical Analysis Platform, a guided statistical tool purpose-built for Six Sigma, Lean, and process improvement professionals, emphasizing accessible statistical rigor for non-statistician quality practitioners in manufacturing and operations environments.
At a Glance
- Category: Quality Improvement and Statistical Analysis Platform
- Best For: Six Sigma practitioners, quality engineers, manufacturing analysts, operations managers, and educators in quality and process improvement, particularly those certified through ASQ or corporate Six Sigma programs where Minitab is the standard curriculum software
- Price Range: Pricing on request: not publicly disclosed | Estimated approximately $1,495–$1,895/yr per user based on third-party sources (unconfirmed from official Minitab pricing, May 2026) | Academic licensing at institution-specific pricing | No free tier | Contact minitab.com directly for a current quote | Pricing research conducted May 2026
- Primary Strength: Minitab’s Assistant menu provides step-by-step guided analysis that automatically selects appropriate statistical tests, checks assumptions, and generates plain-language interpretation summaries, making it the most accessible path to statistically rigorous quality analysis for non-statistician manufacturing and operations professionals.
- Biggest Limitation: Minitab’s commercial pricing is not publicly disclosed and its statistical scope is the narrowest in this evaluation, purpose-built for quality improvement and Six Sigma, with limited domain value for researchers, economists, scientists, or data scientists outside manufacturing and operations contexts.
- One-Line Summary: Minitab Statistical Software is the standard Six Sigma and quality improvement platform, rated G2 4.5/5 from 600+ reviews (May 2026), with an AI-enhanced guided Assistant that makes statistically rigorous process analysis accessible to quality professionals who do not have a formal statistics background.
- Last Verified: May 2026
Overview
Minitab Statistical Software is a quality improvement and statistical analysis platform developed since 1972, used as the standard tool in Six Sigma certification programs and manufacturing quality management globally, rated G2 4.5/5 from 600+ verified reviews (May 2026) and valued for an Assistant menu that guides non-statistician professionals through statistically correct process analysis.
Minitab Statistical Software added AI Guided Assistance and AI Summaries for graph interpretation in 2025–2026, receiving specific positive user feedback, with one May 2026 G2 reviewer noting “smarter AI, smoother workflows and extremely intuitive visuals” and that “Minitab now feels more faster and user friendly” (Minitab AI press release, 2025). Minitab Statistical Software was founded in 1972 at Pennsylvania State University as a teaching tool and acquired by Symphony Technology Group (private equity) in 2019, a corporate ownership change that has raised long-term product investment concerns in the user community.
Key Features
- Assistant Guided Analysis Menu: Minitab’s Assistant provides a step-by-step guided interface that automatically selects the statistically appropriate test for a user’s data structure and hypothesis, checks assumptions with diagnostic plots, presents decision-tree navigation for methodological choices, and generates a plain-language summary interpreting results, enabling quality professionals without formal statistics training to conduct methodologically correct capability studies and hypothesis tests independently (Minitab features, 2026).
- AI Guided Assistance (2025–2026): Minitab’s AI Guided Assistance provides interactive AI support for interface navigation, tool and method selection, and result interpretation, extending the Assistant’s guided approach with conversational AI that received specific positive G2 user validation dated May 2026, confirming that the 2025–2026 platform improvements have been recognized by the active user community (Minitab Solution Center, February 2026).
- Measurement Systems Analysis: Minitab Statistical Software provides Gage R&R, expanded Gage R&R, attribute agreement analysis, and the EMP (Evaluating the Measurement Process) method, supporting ISO 9001, IATF 16949, and Six Sigma measurement system validation requirements standard in automotive and advanced manufacturing quality programs.
- Comprehensive Quality Analyst Toolkit: Minitab’s statistical toolkit covers regression (linear, logistic, Cox, nonlinear, MARS), ANOVA (general linear models, mixed models, MANOVA), DOE (full and fractional factorial, response surface, mixture designs), 30+ SPC control chart types, capability analysis, time series forecasting, and machine learning methods (CART, TreeNet, Random Forests), a complete quality analyst toolkit within a single subscription platform.
- Minitab Solution Center AI Summaries: Minitab Solution Center (cloud platform, 2025–2026) provides AI Summaries for graph interpretation (covering Probability Plot, Tabulated Statistics, Bubble/Scatterplot, and Individual Value plots) along with automated visualization and dashboard generation for distributed quality teams monitoring production processes across multiple sites.
Best For
Minitab Statistical Software is best for Six Sigma Black Belts, Green Belts, quality engineers, manufacturing process analysts, and operations managers working within quality improvement frameworks, particularly those whose professional certification (ASQ, corporate Six Sigma programs) used Minitab as the course platform, and organizations where Minitab Statistical Software is already the departmental standard for quality data analysis.
Strengths
- Minitab Statistical Software earned G2 4.5/5 from 600+ verified reviews (May 2026) (the largest independently verified review base of any tool in the lower half of this ranking) with a May 2026 reviewer documenting that recent AI and cloud platform improvements made Minitab “feel more faster and user friendly” with “smarter AI, smoother workflows and extremely intuitive visuals,” providing dated community validation of the 2025–2026 improvements.
- Minitab’s Assistant menu has been consistently identified by users and independent reviewers as the most differentiated quality software feature for non-statistician practitioners, a Software Advice reviewer described Minitab Statistical Software’s “unparalleled ability to make complex statistical analysis accessible and practical, even for non-statisticians,” capturing the core value proposition distinguishing Minitab from both general statistical tools and programming-based alternatives (Software Advice, 2025).
- Minitab Statistical Software has been embedded in Six Sigma certification curricula at ASQ and major corporate training programs for decades, meaning quality professionals in manufacturing, automotive, aerospace, and healthcare typically first encounter Minitab Statistical Software through professional development, a certification-driven adoption channel that sustains market presence across generations of quality management practitioners.
Limitations
- Narrow Domain Scope: Minitab Statistical Software’s most consequential limitation is domain breadth, purpose-built for quality improvement and Six Sigma, Minitab provides limited value for researchers outside manufacturing, operations, and process engineering; economists, social scientists, physical chemists, and data scientists will find substantially better domain fit in Stata, IBM SPSS Statistics, OriginPro, or R with RStudio respectively.
- Data Import Weakness: A comparative review by ProStat Services identified Minitab Statistical Software as having “the worst data import” among major statistical software packages, with “worksheet burial” creating difficulty managing large analyses with many variables, a genuine operational friction for organizations integrating Minitab with ERP or MES systems (ProStat Services, 2024).
- Private Equity Ownership Concern: Minitab Statistical Software’s 2019 acquisition by Symphony Technology Group (private equity) has generated long-term user community concern about pricing increases and reduced R&D investment, a concern partially addressed by the 2025–2026 AI feature additions but not resolved, as PE ownership of statistical software has historically correlated with margin optimization over sustained product investment.
- Perceived Downgrade from JMP: The documented community perception among engineers that switching from JMP to Minitab Statistical Software represents a quality regression, with one r/Semiconductors community member describing their company’s switch as “such a major downgrade and everyone hates the switch” after their company chose Minitab for cost reasons (u/pizza_whistle, r/Semiconductors, 2025), is an honest signal for engineering-adjacent organizations evaluating whether Minitab delivers sufficient analytical value relative to alternatives.
Verdict
Minitab Statistical Software is the ranked #7 statistical analysis platform in this overall evaluation, not because it fails its target audience, but because its domain scope is the narrowest and its pricing the least transparent of any tool evaluated, limiting relevance for the broad audience this article addresses. Within its domain, Six Sigma, quality improvement, and manufacturing process analysis, Minitab Statistical Software is a well-validated and continuously improving platform, rated G2 4.5/5 from 600+ reviews (May 2026) with positive user validation of its 2025–2026 AI improvements. Six Sigma practitioners and quality engineers should evaluate Minitab Statistical Software directly against JMP, the alternative most frequently cited in the same professional context, and should factor in that the free JMP Student Edition (launched 2024) may provide superior interactive visual analysis at $0 cost for academic or transitional users before committing to a paid subscription.
What Red Flags Should I Watch For When Evaluating Statistical Analysis Software?
The six red flags below identify when a software selection process is being driven by factors other than evidence-based fit, each is independently citable and actionable regardless of which tools you are evaluating.
Red Flag #1: Pricing Opacity Without Verification JMP, Minitab Statistical Software, and SAS Viya all require sales engagement before any cost evaluation is possible, forcing evaluators into a sales process before understanding total investment. Confirm complete cost of ownership, including training, renewal escalation clauses, and multi-seat discount structures, before shortlisting any tool that withholds its list price from public evaluation.
Red Flag #2: GUI-Only Workflows in Reproducibility-Sensitive Publishing Contexts Journals and research funders increasingly require submitted replication code as a condition of publication or grant compliance. GUI-first tools like IBM SPSS Statistics generate syntax automatically from GUI actions but do not enforce code-first discipline, researchers planning to publish in journals with mandatory replication packages should verify that their chosen tool supports a fully scriptable, version-stable workflow before committing.
Red Flag #3: Institutional Inertia Mistaken for Feature Merit Using IBM SPSS Statistics because your advisor uses it, or Stata because your department uses it, is a legitimate practical reason, but it is not the same as independent feature-based selection. Recognizing the institutional inertia pattern allows evaluators to honestly weigh real switching costs and long-term license access risks of inheriting a tool versus independently selecting one that fits a career trajectory.
Red Flag #4: AI Feature Claims Without Dated User Validation Every statistical software vendor in this evaluation announced AI features in 2025–2026. Distinguish AI capabilities with positive, dated independent user reviews (Minitab’s AI Guided Assistance received specific G2 community validation in May 2026) from capabilities announced in press releases but not yet confirmed by the active user community. Vendor press releases are not equivalent to independent reviewer confirmation.
Red Flag #5: Domain Mismatch Leading to Tool Underperformance A general-purpose tool selected out of familiarity will underperform a purpose-built domain tool in every domain-specific workflow. OriginPro provides spectroscopy peak analysis that R with RStudio requires significant custom scripting to replicate. JMP provides DOE workflows that Minitab Statistical Software approximates only partially. SAS Viya provides 21 CFR Part 11 compliance that R with RStudio requires explicit validation overhead to achieve. Evaluate domain fit before evaluating general statistical capabilities.
Red Flag #6: Cloud AI Tools for IP-Sensitive Engineering Data Engineers in semiconductor, defense, and aerospace industries face real data privacy constraints when evaluating cloud-integrated AI statistical tools. Local installation tools like JMP, Minitab Statistical Software, and traditional IBM SPSS Statistics deployments process data within organizational boundaries. Verify data residency requirements with your information security team before adopting any cloud-based AI analytics platform for IP-sensitive analytical workflows (r/Semiconductors, 2025).
What Questions Should I Ask Before Choosing Statistical Analysis Software?
These seven questions ensure you evaluate statistical software against your actual use case and constraints (not abstract feature lists) before making a multi-year commitment.
Question #1: What Is Your Primary Research Domain, and Does This Tool Have Built-In Workflows for It?
Ask whether the tool you are evaluating has native support for your domain-specific data formats, analytical methods, and output conventions. An econometrician needs xtreg and ivregress as built-in commands. A spectroscopist needs peak fitting and batch spectral deconvolution. A quality engineer needs Gage R&R and SPC control charts. General statistical coverage is not the same as domain workflow support.
Question #2: Does Your Institution Provide a Site License That Changes the Individual Cost Calculation? IBM Academic Initiative, SAS Academic Program, and institution-specific JMP and Minitab agreements can reduce costs by 80–90%, but require active institutional enrollment. Check with your institution’s IT or research computing office before evaluating any commercial tool at full individual price. The gap between institutional and individual pricing often determines which tier of software is financially viable.
Question #3: Will Your Published Work Require Reproducible Code Submission to Journals or Research Funders? If you publish in journals that mandate replication packages (American Economic Review, PLOS ONE, Nature family journals), or work under funders that require open analysis code, verify that your chosen tool supports scriptable, version-stable workflows before purchasing. This question alone often narrows viable choices to R with RStudio, Stata, or Python for any research-publishing context.
Question #4: How Will You Access This Software After Graduation, Job Change, or End of Institutional Enrollment? IBM SPSS Statistics and Stata users who rely on institutional licenses lose access upon graduation or employment change. R with RStudio’s permanently $0 model and JMP’s free Student Edition (valid for academic users at degree-granting institutions indefinitely) provide continuity that subscription-dependent tools do not. Factor lifecycle access into any multi-year evaluation, statistical software is a career-long skill investment, not just a semester tool.
Question #5: Does Your Work Involve Proprietary or IP-Sensitive Data That Cannot Be Processed by Cloud-Connected AI Systems? Engineers in semiconductor, defense, and aerospace industries face real constraints when evaluating cloud-integrated AI statistical tools. Verify data residency requirements with your organization’s information security team before adopting any cloud-based AI analytics platform for IP-sensitive analytical workflows (r/Semiconductors, 2025).
Question #6: Is the Free Software Truly Free for Your Specific Use Case, or Are There Hidden Infrastructure Costs? R with RStudio is free for individual use, but organizational deployments needing collaboration, security, or model serving require Posit Workbench or Connect, which carry per-user subscription costs. Assess not just license cost but total cost of ownership including training, IT infrastructure, and ongoing support before classifying any tool as “free” for your context.
Question #7: What Is the Long-Term Market Trajectory of This Tool in Your Field? Statistical software adoption in academic disciplines follows slow but real shifts, R with RStudio has been steadily displacing IBM SPSS Statistics in graduate curricula, and Python is encroaching on R with RStudio in data science. Evaluate both current departmental standards and emerging skill expectations in your field’s job market before committing to a tool whose professional community may be contracting.
How Did We Rank These 7 Statistical Analysis Software Tools?
These seven statistical analysis software tools were ranked by scoring each platform against five objective criteria, domain coverage and audience fit, documented institutional adoption and community trust, pricing transparency and value, accessibility-to-power balance, and reproducibility and research integrity features. Domain coverage and institutional adoption are weighted at 2x; the remaining three criteria at 1x each. Every score is supported by independently verifiable evidence.
Evaluation Process
The research process for this evaluation involved:
- Conducting parallel deep-research queries across all seven products for features, pricing, user sentiment, and institutional adoption data
- Gathering independent review data from G2, Capterra, Trustpilot, and Software Advice platforms, with verification dates noted for every rating cited
- Analyzing Reddit practitioner community sentiment across r/statistics, r/Semiconductors, r/sixsigma, r/AskAcademia, r/datascience, and r/manufacturing
- Cross-referencing vendor claims against third-party review platforms, academic publications, and independently verifiable usage statistics
- Verifying pricing from official vendor websites, or explicitly noting where pricing is opaque and no public pricing exists
- Querying AI search engines (Perplexity AI and ChatGPT-4o, May 2026) solely to identify editorial coverage gaps, these LLM responses were not used as evidence sources for rankings
Ranking Criteria
Domain Coverage and Audience Fit (2x weight): Statistical software is not one-size-fits-all. A tool’s native domain workflows, data format support, and recognized standard status in its primary domain (Stata in AER replication supplements, JMP in semiconductor manufacturing, SAS Viya in FDA-regulated pharma) determine whether it genuinely serves its stated audience. Evidence is drawn from named institutional adoption data, published journal submission analysis, and domain-practitioner community consensus with source citations and year.
Documented Institutional Adoption and Community Trust (2x weight): Statistical software is a multi-year investment. Tools with independently verifiable adoption at major research institutions, high-volume verified user reviews, and active practitioner communities carry lower switching risk. Evidence: G2 and Capterra verified review ratings and volume (with date of verification), named institutional adopters with source citations, and practitioner community size with documentation.
Pricing Transparency and Value (1x weight): Cost is the most common adoption barrier. Pricing opacity forces evaluators into sales processes before they can assess fit, adding friction that disadvantages budget-constrained users disproportionately. Pricing was classified as:
- Published: vendor lists prices publicly (R with RStudio, Stata, OriginPro)
- Requires Sales Engagement: cost unavailable without contacting vendor (JMP, Minitab, SAS Viya)
- Published with Institutional Discount: base pricing public; academic rates require institutional enrollment (IBM SPSS Statistics)
Accessibility-to-Power Balance (1x weight): A tool that is inaccessible to its stated target audience fails even if statistically comprehensive. Interface type (GUI-first, code-first, or hybrid), documented learning curve from practitioner reviews, availability of guided analysis features (Minitab Assistant, IBM SPSS Statistics AI Output Assistant), and user review sentiment on learnability were assessed against each tool’s primary target audience skill level, not a universal standard.
Reproducibility and Research Integrity Features (1x weight): Journals increasingly require script-based, version-stable analytical workflows following the reproducibility crisis. Script-based workflow support, version stability (Stata’s version command backward-compatibility guarantee is the measurable gold standard), and regulatory compliance certifications (21 CFR Part 11, GxP) for pharma-context evaluation were assessed.
Evidence Weighting
When review platform ratings conflict with Reddit practitioner sentiment, we weight specificity and recency, a detailed 2025 Reddit post with named attribution from an experienced practitioner outweighs a generic undated review. Vendor-reported statistics (OriginLab’s self-reported 1M+ user claim) are clearly labeled as vendor-sourced and treated as lower confidence than independently verified data. No ranking decision relies solely on vendor-supplied evidence.
Data Validation
Vendor-reported statistics are labeled as such throughout the article. Claims corroborated by at least one independent source are stated as fact; single-source vendor claims are qualified with appropriate hedging. Pricing figures presented without official confirmation are explicitly noted as estimates from third-party sources.
Update Cadence
This article was researched and written in May 2026. We review statistical software rankings quarterly and update individual entries when significant pricing changes, product releases, or community sentiment shifts are identified. Last updated: May 2026.
Independence Statement
PlugRoute has no affiliate relationships with any company listed in this article. Rankings are determined entirely by research data and objective evaluation criteria. No company paid for inclusion, placement, or editorial treatment.
Frequently Asked Questions
What Is the Best Free Statistical Analysis Software in 2026?
R with RStudio is the best free statistical analysis software in 2026, offering 20,000+ CRAN packages at $0 for individuals permanently (Kaggle, 2024: 48% of data professionals). Non-programmers needing point-and-click simplicity at $0 should evaluate JASP or jamovi, free, GUI-based, R-powered SPSS alternatives. Engineers and applied scientists at degree-granting institutions qualify for the free JMP Student Edition (launched 2024), which includes full JMP and JMP Pro.
What Statistical Software Do Academic Economists Use Most for Published Research?
Stata is used in approximately 73% of reproducibility supplements submitted to the American Economic Review (Vilhuber et al., 2020), the strongest independently verified evidence of dominant adoption in any academic discipline in this evaluation. Stata’s version command guarantees identical output across all past and future versions. R with RStudio is the primary free alternative, though it requires explicit effort to achieve comparable version-stable reproducibility assurance.
How Does PlugRoute Determine Its Statistical Software Rankings?
PlugRoute ranks statistical software against five objective criteria (domain coverage, institutional adoption, pricing transparency, accessibility-to-power balance, and reproducibility) with every score backed by independently verifiable evidence: G2 and Capterra review data, published pricing tables, named institutional adoption citations, and peer-reviewed usage statistics where available. No company pays for inclusion, placement, or editorial treatment. Full methodology is documented in the ranking section above.
Glossary: Key Terms Used in This Comparison
Do-File: A do-file is a plain-text script file in Stata (.do extension) that records a complete, reproducible sequence of analytical commands, the primary mechanism through which Stata achieves its version-stable reproducibility guarantee, and the format required as replication packages by academic economics journals including the American Economic Review.
21 CFR Part 11: 21 CFR Part 11 is the U.S. Food and Drug Administration regulation governing electronic records and electronic signatures in regulated industries, requiring that software used in clinical trials and pharmaceutical manufacturing maintains auditable records, access controls, and data integrity documentation at all times. SAS Viya’s out-of-the-box 21 CFR Part 11 compliance infrastructure is its primary differentiator in pharmaceutical statistical computing.
Design of Experiments (DOE): Design of Experiments (DOE) is a statistical methodology for systematically planning and analyzing controlled experiments to determine which input variables most significantly affect output results, the core analytical workflow in engineering and pharmaceutical process development for which JMP is the recognized dominant platform in this evaluation, providing integrated design generation through response surface optimization.
CRAN (Comprehensive R Archive Network): CRAN is the official package repository for the R programming language, hosting 20,000+ peer-reviewed statistical packages that extend R with RStudio’s core functionality across every statistical domain, the primary reason R with RStudio covers every statistical method in this evaluation at no additional cost, growing approximately 1,000 packages per year.
Validated Statistical Computing Environment (SCE): A Validated Statistical Computing Environment (SCE) is a software deployment that has been formally qualified and documented to meet regulatory requirements (including FDA 21 CFR Part 11) for clinical trial data analysis, a compliance prerequisite in pharmaceutical drug development that SAS Viya provides out-of-the-box infrastructure to support, and that R with RStudio-based organizations must build separately through frameworks like pharmaR and the R Validation Hub.
Which Statistical Analysis Software Tool Is Right for You?
The right statistical analysis software depends on your domain, technical skill level, budget, and career trajectory, not on generic rankings divorced from your specific research context. The Key Insights below summarize the most consequential cross-tool findings for each buyer profile.
Key Insights
- R with RStudio is the only completely free, fully-featured statistical computing platform in this evaluation, offering 20,000+ CRAN packages at $0 cost permanently, making it the first choice for any researcher with programming proficiency or willingness to develop it (Kaggle, 2024).
- Stata’s
versioncommand provides the only 40-year backward-compatible do-file reproducibility guarantee in this evaluation, the technical foundation underlying Stata’s approximately 73% dominance in American Economic Review replication supplements (Vilhuber et al., 2020). - SAS Viya is the only platform in this evaluation backed by a $49.9M government FDA deployment contract, making it the institutional standard for regulated pharmaceutical analytics, but structurally inaccessible to individual researchers at any independently reachable price point (PR Newswire, January 2021).
- JMP Student Edition (launched 2024) makes full JMP and JMP Pro free for academic users at degree-granting institutions, a market development absent from most AI-generated statistical software content and the most significant recent cost-accessibility improvement in engineering-focused statistical software.
- OriginPro is the only platform in this evaluation with a built-in image digitizer for extracting quantitative data from published literature figures, a unique capability with irreplaceable practical value in scientific meta-analysis and materials science research, with no equivalent in any competing platform.
- JMP, Minitab Statistical Software, and SAS Viya all require sales engagement before any pricing evaluation is possible, a systematic information disadvantage for budget-constrained evaluators that R with RStudio, Stata, and OriginPro avoid with fully published pricing tables.
- Multi-tool workflows are common among expert practitioners: JMP for fast exploratory EDA combined with R with RStudio for advanced modeling; OriginPro for publication figures combined with Python for upstream computation, choosing a primary tool does not preclude complementary use of a second platform for specialized tasks.
Academic economists and epidemiologists publishing in journals with replication requirements will find Stata’s version-stable do-files and approximately 73% AER dominance the most professionally defensible choice. Engineers and applied scientists should investigate the free JMP Student Edition before evaluating any paid alternative. Physical chemists and materials scientists will find OriginPro’s peak analysis and lab instrument integration capabilities have no equivalent in this evaluation. Pharmaceutical biostatisticians in FDA-regulated environments will find SAS Viya’s compliance infrastructure currently irreplaceable, but should build R with RStudio proficiency alongside it as a transferable, always-accessible statistical skill. For the majority of researchers, students, and data scientists who can invest in a programming learning curve, R with RStudio remains the strongest overall recommendation, providing every statistical method available anywhere, at permanent $0 cost, with the reproducibility infrastructure that academic publishing increasingly demands.
Browse PlugRoute for additional independent software comparisons across analytics, research tools, and enterprise software categories. We update this guide quarterly. Last updated: May 2026.