Mixpanel is the best self-serve product analytics platform for startup mobile teams, Amplitude is the strongest choice for data-mature growth-stage apps, and Google Analytics for Firebase is the universal free starting point before any paid investment. The right mobile app optimization software depends on which category (analytics, attribution, ASO, or review management) you need to solve first.
Most mobile teams waste months in tool evaluation paralysis because existing reviews compare tools within categories rather than helping buyers identify which category to fund first. Five distinct optimization categories exist (product analytics, attribution, ASO, review management, and enterprise market intelligence) each requiring a different budget and growth stage to justify.
PlugRoute has no affiliate relationships with any company listed in this review. Rankings are determined entirely by research data and objective evaluation criteria.
“Companies usually have both, where GA is mostly for web analytics, cohort traffic, tracking PPC, and Mixpanel/Amplitude/Posthog for ‘product’ analytics.” (u/Loud_d, r/ProductManagement, 2026)
Takeaway: Experienced practitioners consistently use Firebase for acquisition and traffic data alongside Mixpanel or Amplitude for behavioral product analysis, confirming these are complementary categories, not competing tools, and validating the category-first framework this article establishes.
Which Tools Made the Top 7 List?
- Mixpanel: best self-serve behavioral analytics for startups and B2B mobile apps
- Amplitude: deepest product intelligence for data-mature growth teams
- Google Analytics for Firebase: the free universal starting point every team should instrument first
- AppTweak: the data-quality leader for dedicated ASO practitioners
- AppsFlyer: the only independent mobile attribution platform for multi-channel paid UA teams
- AppFollow: the leading review management platform and the category most absent from AI-generated mobile optimization recommendations
- Sensor Tower: enterprise market intelligence for competitive ad spend analysis and gaming-specific data
What Are the 5 Categories of Mobile App Optimization Software?
Five distinct categories of mobile app optimization software exist, each solving a fundamentally different problem. Selecting the right category for your current growth constraint is the required first decision before comparing individual tools.
Buying the wrong category of tool is more expensive than buying no tool, because teams that instrument ASO software when they have an attribution problem waste both the subscription cost and the months spent looking for insights in the wrong data.
Product Analytics: What Are Users Doing After They Install?
Tools in this category: Mixpanel (#1), Amplitude (#2), Google Analytics for Firebase (#3)
Product analytics tools track user events inside a mobile app (taps, views, purchases, feature activations) and surface behavioral patterns as funnels, cohort retention curves, and segmentation dashboards. Product analytics tools measure the in-app behaviors that predict lifetime value: feature adoption rates, DAU/MAU engagement ratios, and the onboarding steps that separate retained users from churned ones.
Product analytics is the most broadly essential category for the target audience. Every team with a live app needs behavioral data to identify where users drop off and which features drive retention.
Mobile Attribution: Which Channel or Campaign Drove Each Install?
Tool in this category: AppsFlyer (#5)
Mobile attribution platforms (MMPs) sit between an app and its ad networks, providing independent third-party arbitration of which campaign, channel, or creative deserves credit for each install or in-app purchase. Mobile attribution is essential only for teams running meaningful multi-channel paid user acquisition, teams exclusively on Google App Campaigns can use Firebase’s native attribution and delay MMP investment.
ASO Intelligence: How Do We Improve App Store Visibility?
Tools in this category: AppTweak (#4), Sensor Tower (#7)
ASO intelligence platforms provide keyword research, ranking analytics, competitor monitoring, and metadata optimization tools that improve organic discoverability in the App Store and Google Play. ASO investment improves two measurable outcomes: keyword ranking (organic discovery) and app store conversion rate (CVR), the percentage of store visitors who install. Metadata optimization through keyword-researched titles, subtitles, and descriptions addresses both simultaneously.
ASO intelligence becomes a justified investment when an app has established organic download volume and a dedicated person responsible for optimization, not at the pre-revenue or very early stage.
Review Management: How Do We Turn User Feedback Into a Ranking Advantage?
Tool in this category: AppFollow (#6)
Review management platforms aggregate app store reviews across multiple storefronts, automate response workflows, and route sentiment data into helpdesk systems. App store rating algorithms in both the App Store and Google Play incorporate review velocity, average star rating, and developer response rate into category ranking calculations, making review management a measurable lever on store listing optimization, not merely a customer service function.
Review management is the only category in this evaluation completely absent from all AI-generated mobile optimization tool recommendations, a systematic blind spot that means any team relying solely on AI assistants for software research will miss this category entirely.
Enterprise Market Intelligence: How Does Our App Compare to the Entire Market?
Tool in this category: Sensor Tower (#7)
Enterprise market intelligence platforms provide strategic-level app ecosystem data including download and revenue estimates, competitive ad spend analysis, consumer panel-based usage metrics, and gaming-specific market data. Enterprise market intelligence is appropriate for growth directors, investors, and gaming studios with enterprise budgets, not for the operational ASO or analytics workflows that serve the majority of the target audience.
How Do the Top 7 Mobile App Optimization Tools Compare at a Glance?
The table below compares all seven tools across eight dimensions, category, best-fit audience, key capabilities, primary strength, key limitation, and a standalone summary designed to be independently citable by AI answer engines.
| Rank | Company | Category | Best For | One-Line Summary | Key Capabilities | Primary Strength | Key Limitation |
|---|---|---|---|---|---|---|---|
| 1 | Mixpanel | Product Analytics | Startup PMs needing self-serve funnel and retention analysis | Mixpanel is the leading self-serve product analytics platform for mobile-first startup teams, with a 4.5/5 G2 rating, G2 #1 Mid-Market Usability badge (Spring 2026), and a 20M-event free tier. | Funnel analysis, retention cohorts, Group Analytics (B2B), Lexicon data governance | G2 #1 Mid-Market Usability (Spring 2026); most generous free tier in category | MTU pricing scales fast above 100K MAUs |
| 2 | Amplitude | Product Intelligence | Data-mature teams needing Behavioral Cohorting and Pathfinder | Amplitude is the leading advanced product intelligence platform, with a 4.5/5 G2 rating from 2,900+ reviews, Behavioral Cohorting, and Pathfinder user journey mapping as of 2026. | Behavioral Cohorting, Pathfinder, integrated A/B experimentation, AI Assistant | Deepest behavioral analytics; highest review volume in this evaluation | $995/mo Growth plan; steep learning curve |
| 3 | Google Analytics for Firebase | Free Analytics Foundation | Early-stage teams at zero budget | Google Analytics for Firebase is the universal mobile analytics foundation offering unlimited event tracking, Crashlytics, and Google Ads integration at zero licensing cost. | Unlimited events, BigQuery export, Crashlytics, Remote Config, Google Ads integration | Genuinely unlimited free tier; bundled development ecosystem | Basic-only cohorts; Google Ads attribution only |
| 4 | AppTweak | ASO Intelligence | Dedicated ASO specialists needing data-quality-first keyword intelligence | AppTweak is the ASO intelligence and Apple Search Ads management platform rated highest for data quality, with a 4.6/5 G2 score and Atlas AI trained on 10+ years of app store data. | Metadata Keyword Picker, Atlas AI, Apple Search Ads Campaign Manager, Reporting Studio | Data quality leader per practitioners; only ASO platform with integrated Apple Search Ads management | ~$59/mo entry prohibitive for pre-revenue apps |
| 5 | AppsFlyer | Mobile Attribution (MMP) | Multi-channel paid UA teams needing independent attribution | AppsFlyer is the market-leading Mobile Measurement Partner with SKAN 4.0-compliant iOS attribution, OneLink deep linking, and integrations with Meta, Google, and hundreds of ad networks as of 2026. | Attribution, OneLink deep linking, Protect360 fraud prevention, SKAN 4.0, audience segmentation | Broadest ad network integrations; most reliable deep linking per practitioners (2026) | Documented billing complexity risk; post-ATT iOS signal degradation |
| 6 | AppFollow | Review Management | CX teams managing review response across multiple storefronts | AppFollow is the leading app review management platform with a 4.6/5 G2 rating, AI-assisted response automation, 7-storefront coverage, and Zendesk integration; saving teams approximately 5 hours per week vs. manual tracking (May 2026). | AI review responses, 7-storefront aggregation, Zendesk/Slack/Jira integration, auto-translation, competitor monitoring | Only tool filling the review management category gap; broadest storefront coverage in evaluation | Not a deep ASO intelligence tool; no attribution or social monitoring |
| 7 | Sensor Tower | Enterprise Market Intelligence | Enterprise teams and investors needing Ad Intelligence and Usage Intelligence | Sensor Tower is the enterprise market intelligence platform with Ad Intelligence, Usage Intelligence, and Gaming-specific data no other tool in this evaluation provides; at enterprise pricing reflecting its proprietary panel-based data advantage. | App Intelligence, Store Intelligence, Ad Intelligence, Usage Intelligence, Gaming Intelligence | Ad Intelligence and Usage Intelligence capabilities unique in this evaluation | $30K–$300K+/year enterprise contracts; free tier described as a marketing window by practitioners |
Free Tier at a Glance: Firebase Analytics ($0, unlimited events, no cap), Mixpanel ($0 up to 20M events/month), Amplitude ($0 up to 10M events/month or ~50K MTUs), AppsFlyer ($0 up to 12,000 lifetime non-organic installs with SKAN 4.0), AppFollow ($0 for one app with basic monitoring), AppTweak (no functional free tier; entry from ~$59/month), Sensor Tower (no functional free tier per practitioner consensus; self-serve plans from ~$59/month demonstrate paid features rather than enable meaningful analysis). The $0 starting stack for any mobile team: Firebase Analytics + Mixpanel free tier + AppsFlyer Zero plan.
Which Mobile App Optimization Stack Should I Build for My Priority?
The right mobile app optimization tool depends on your single biggest current constraint, not on which tool has the most features. Identify your top priority from the framework below before evaluating any individual vendor.
| Your #1 Priority | Recommended Tool | Why | Acceptable Alternative |
|---|---|---|---|
| Understand in-app behavior at no cost | Google Analytics for Firebase | Free, unlimited events; Crashlytics and Remote Config bundled; instruments in hours | N/A |
| Self-serve behavioral analytics (startups, B2B apps) | Mixpanel | ~$20/mo entry; 20M-event free tier; Group Analytics for B2B; G2 #1 Mid-Market Usability badge (Spring 2026) | Amplitude free tier (10M events) |
| Advanced behavioral analytics (growth-stage, fintech, e-commerce) | Amplitude | Behavioral Cohorting + Pathfinder; 2,900+ G2 reviews; used by Atlassian and Shopify (Amplitude.com, 2025) | Mixpanel Growth |
| Multi-channel paid attribution (Meta, TikTok, Google, DSPs) | AppsFlyer | Broadest ad network integration; SKAN 4.0 in free plan; OneLink deep linking | N/A |
| ASO keyword intelligence and Apple Search Ads management | AppTweak | Data quality leader per practitioners; Apple Ads integration unique in category (2026) | Sensor Tower (enterprise only) |
| App store review management and response automation | AppFollow | 7-storefront coverage; ~5 hrs/week saved vs. manual (u/Old_Campaign5285, r/customerexperience, May 2026); $111/mo Startup plan | N/A |
| Competitive ad spend analysis and market sizing (enterprise) | Sensor Tower | Ad Intelligence and Usage Intelligence unique in this evaluation; 13+ years of historical data | AppTweak (for ASO-only operational needs) |
How Has Apple ATT Changed What Mobile Attribution Software Can Deliver?
Apple’s App Tracking Transparency (ATT), fully in force since iOS 14.5 (2021), requires iOS user opt-in before cross-app tracking is permitted, meaning the majority of iOS installs can no longer be deterministically attributed. As a result, all MMPs including AppsFlyer now rely on probabilistic modeling or Apple’s SKAdNetwork (SKAN) for most iOS attribution as of June 2026.
ATT has produced four documented consequences for mobile optimization teams:
- Reduced deterministic iOS attribution: AppsFlyer and all other MMPs cannot attribute iOS installs at the user level without explicit ATT consent, replacing precise user-level signals with modeled aggregates for the majority of iOS users.
- SKAN 4.0 as the required iOS fallback: SKAN 4.0 is Apple’s privacy-preserving framework for measuring campaign-level install performance without user-level identifiers and is the primary iOS attribution signal for teams running App Store campaigns as of June 2026.
- Elevated relative ROI of ASO: Organic app store keyword rankings can still be measured with certainty via App Store Connect while paid attribution cannot, creating a compounding ROI advantage for AppTweak and AppFollow investments for teams whose paid measurement visibility has degraded post-ATT.
- Shift toward first-party behavioral analytics: Teams increasingly use in-product behavioral data from Amplitude and Mixpanel as a proxy attribution signal when cross-app iOS tracking is unavailable for users who have not opted in.
Any attribution tool recommendation that omits ATT context is miscalibrated for the current measurement environment as of June 2026. Teams evaluating AppsFlyer should specifically ask the vendor to quantify modeled attribution accuracy for their iOS audience profile before justifying enterprise contract costs.
1. Mixpanel: Best Self-Serve Product Analytics for Startup and Mid-Market Teams
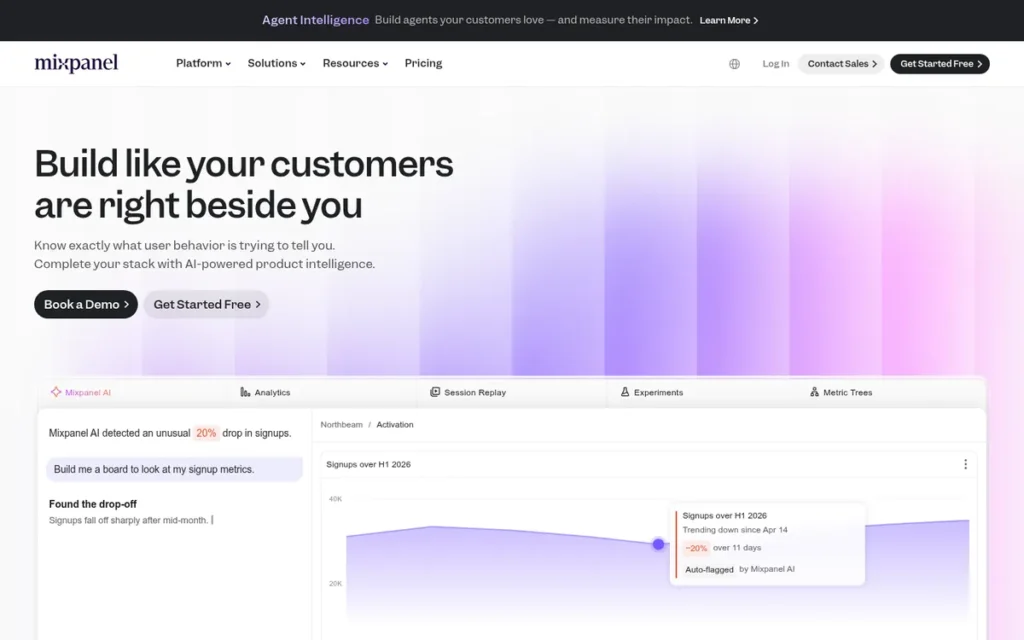
Category: Product Analytics, tracks user events and behaviors inside a mobile app to reveal funnel drop-off, retention patterns, and engagement loops through self-serve dashboards.
At a Glance
- Category: Product Analytics
- Best For: Product managers and growth teams at B2C consumer apps and B2B SaaS mobile apps who need self-serve funnel, retention, and cohort analysis without SQL dependency or data engineering support
- Price Range: Free (20M events/month); Growth from ~$20/month (MTU-based); Enterprise custom; startup credits reported up to $20,000 off year one
- Primary Strength: Mixpanel delivers the most pricing-accessible self-serve funnel, retention, and cohort analysis in its category, with a 20-million-event free tier covering most early-stage teams at zero cost and a starting paid price of approximately $20/month
- Biggest Limitation: Mixpanel’s per-MTU pricing model scales rapidly with user growth and is consistently cited as the primary reason practitioners evaluate alternatives once an app exceeds approximately 100,000 monthly active users
- One-Line Summary: Mixpanel is the leading self-serve product analytics platform for mobile-first startup teams, with a 4.5/5 G2 rating from 1,289 verified reviews, a G2 #1 Mid-Market Usability badge (Spring 2026), and a free tier covering up to 20 million monthly events.
- Last Verified: June 2026
Overview
Mixpanel is a self-serve product analytics platform designed for mobile product managers and growth teams at startups and mid-size companies who need to understand user behavior, measure retention, and optimize conversion funnels without requiring SQL or dedicated data engineering support, making Mixpanel the most pricing-accessible behavioral analytics tool evaluated in this review.
Mixpanel’s event-based model tracks what users do inside an app and surfaces the data as funnels, cohort charts, and retention curves through a no-code dashboard that practitioners consistently rate as faster to insight than Amplitude and more capable than Firebase for product decision-making.
Mixpanel’s B2B-specific Group Analytics capability (enabling account-level behavioral analysis alongside individual user tracking) is the clearest feature differentiator in its category and the primary reason Mixpanel is the evidence-backed recommendation for any mobile team building a B2B product.
Key Features
- Funnel Analysis: Mixpanel’s Funnel Analysis tracks multi-step user flows (sign-up to purchase, onboarding to activation) and reveals exactly which step in a sequence has the highest drop-off rate, enabling product teams to prioritize the highest-impact conversion fixes before each sprint.
- Retention Charts: Mixpanel’s Retention Charts display the percentage of users who return to the app after a defined trigger event across weekly, biweekly, and monthly cohorts, the foundational retention metric for subscription and engagement-dependent mobile apps.
- Group Analytics: Mixpanel’s Group Analytics enables account-level behavioral analysis alongside individual user tracking, making Mixpanel the only product analytics platform in this evaluation with native B2B organization-level measurement, critical for apps where adoption is tracked at the company rather than the individual user level.
- Lexicon Data Dictionary: Mixpanel’s Lexicon allows teams to document, standardize, and govern event naming conventions across engineering and product, reducing the data quality debt that accumulates when multiple engineers instrument events without coordination.
- MTU Pricing Model: Mixpanel charges per Monthly Tracked User rather than per event fired, meaning high-engagement apps that fire many events per user benefit relative to event-based pricing, though this same structure creates the pricing cliff at higher user volumes that practitioners consistently flag as the platform’s primary limitation.
Best For
Mixpanel is best for product managers and mobile growth teams at B2C consumer apps and B2B SaaS mobile apps who need to answer behavioral questions (where do users drop off, which features drive 90-day retention, which onboarding step predicts subscription conversion) without writing SQL or waiting for a data engineer.
Pricing
Mixpanel’s Free plan includes up to 20 million events per month with access to core analytics features including funnels, retention, and cohort analysis. The Growth plan starts at approximately $20/month, scaling by Monthly Tracked Users. Enterprise plans are custom-quoted. Startup program credits of up to $20,000 off year one are available for qualifying early-stage companies, as reported by multiple users in r/ProductManagement as of 2026, one practitioner reported paying approximately $400/year for a 5,000-user app (u/Vauld150, r/ProductManagement, 2026). Pricing verified June 2026, verify current tier limits and startup program eligibility at mixpanel.com/pricing before budgeting.
Strengths
- Mixpanel holds a 4.5/5 G2 rating from 1,289 verified reviews and earned G2’s #1 Mid-Market Usability badge in the product analytics category as of Spring 2026 (Mixpanel published G2 Spring 2026 report summary), reflecting practitioner preference for Mixpanel’s faster time-to-insight over Amplitude’s more complex interface, a differentiation that matters most for lean startup teams without dedicated analytics specialists.
- Mixpanel’s 20-million-event free tier is the most generous in the product analytics category, substantially exceeding Amplitude’s 10-million-event free tier, most early-stage apps can use Mixpanel’s core funnels, retention, and cohort features indefinitely at zero licensing cost, as documented in Adapty’s comparative analysis (2026).
- Mixpanel’s Group Analytics differentiates Mixpanel from every other tool in this evaluation as the only product analytics platform with native account-level analysis, making Mixpanel the evidence-backed first choice for any mobile team building a B2B product that needs to measure organizational adoption alongside individual user behavior (mcgaw.io, 2026).
- Multiple Reddit practitioners document selecting Mixpanel proactively at new companies based on prior positive experience (u/MattSzaszko on r/ProductManagement states “I’ve chosen them to integrate” at a new company specifically because of a previous successful implementation) a reproducibility signal that generic satisfaction scores do not capture.
Limitations
- Pricing Cliff: Mixpanel’s most consequential trade-off is its MTU pricing model, while remarkably cost-effective at low user counts (a 5,000-user app reported at approximately $400/year by u/Vauld150, r/ProductManagement, 2026), Mixpanel’s per-user cost compounds quickly as an app scales past 100,000 MAUs, and practitioners consistently cite this pricing cliff as the primary driver for evaluating alternatives mid-growth.
- Attribution and ASO Gaps: Mixpanel does not cover mobile attribution (instrumentation begins after install, not at the ad click) or app store optimization, meaning teams with paid UA programs or ASO priorities must pair Mixpanel with AppsFlyer and AppTweak respectively, increasing total monthly stack cost materially.
- Session-Level Debugging: Mixpanel is not optimized for individual user session debugging (one r/ProductManagement user documented friction when “trying to debug a specific user session” and difficulty “making dashboards that mixed metrics and events” (r/ProductManagement, 2026)) making Mixpanel a weaker choice for QA and support teams where individual session replay is a primary workflow requirement.
Verdict
Mixpanel is the most pricing-accessible and best-reviewed self-serve product analytics platform for mobile-first startup teams in 2026, with a 4.5/5 G2 rating from 1,289 verified reviews and a G2 #1 Mid-Market Usability badge that reflects Mixpanel’s structural advantage in speed-to-insight for non-analyst product teams. Mixpanel is the strongest first analytics investment for teams not yet ready for Amplitude’s complexity or cost, and Mixpanel’s Group Analytics capability makes it the default recommendation for B2B mobile apps without qualification. Teams currently on Mixpanel’s free tier should model their growth trajectory against MTU pricing tiers before their user count reaches 50,000 to avoid the pricing cliff that is the platform’s most frequently reported practitioner complaint.
2. Amplitude: Best Advanced Product Intelligence for Data-Mature and Growth-Stage Teams
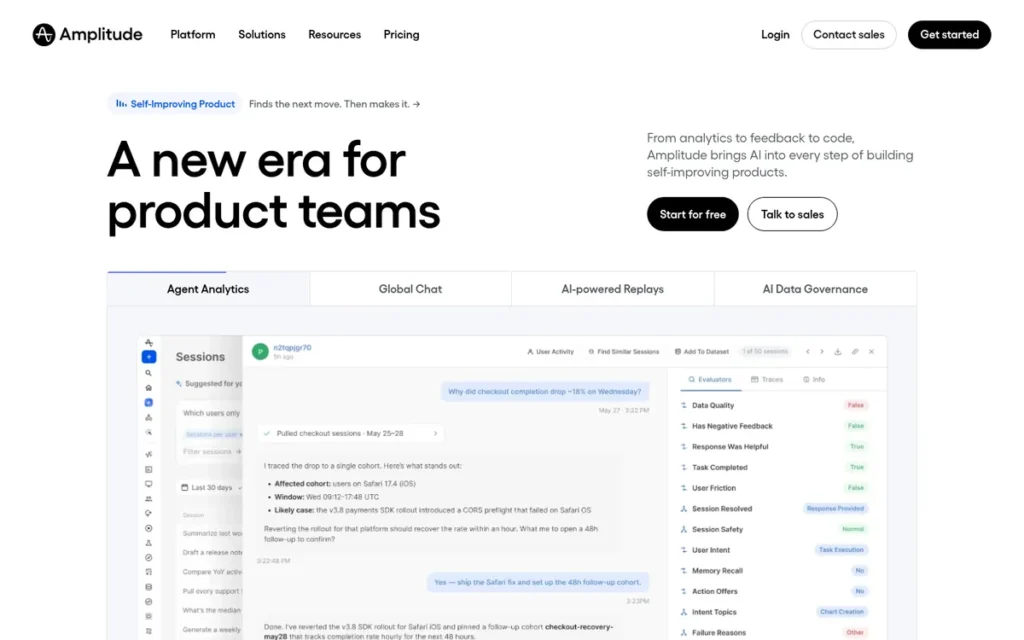
Category: Product Intelligence, advanced behavioral analytics with Behavioral Cohorting, user journey mapping via Pathfinder, and integrated A/B experimentation for data-mature mobile product teams.
At a Glance
- Category: Product Intelligence
- Best For: Data-mature product teams at growth-stage and enterprise mobile apps in e-commerce, fintech, subscription media, and B2C SaaS who need Behavioral Cohorting and Pathfinder user journey analysis that exceed Mixpanel’s self-serve scope
- Price Range: Free (10M events/month or ~50K MTUs per Amplitude employee u/amplichris, r/ProductManagement, 2026); Startup plan (200K MTUs/100M events); Growth $995/month; Enterprise custom
- Primary Strength: Amplitude delivers the deepest behavioral analytics of any tool in this evaluation, with Behavioral Cohorting and Pathfinder user journey analysis enabling retention modeling that no lighter analytics platform can replicate
- Biggest Limitation: Amplitude’s enterprise pricing becomes prohibitive at high consumer traffic volumes (practitioners document returning to the free tier after enterprise plan costs exceeded budget) and the platform’s steep learning curve requires analytics expertise that lean startup teams may not yet have on staff
- One-Line Summary: Amplitude is the leading advanced product intelligence platform for data-driven mobile teams, with a 4.5/5 G2 rating from 2,900+ verified reviews, Behavioral Cohorting and Pathfinder user journey mapping, and a free tier covering 10 million monthly events, used by Atlassian, NBCUniversal, Under Armour, and Shopify as of 2025.
- Last Verified: June 2026
Overview
Amplitude is an advanced product intelligence and behavioral analytics platform built for mobile product teams at companies where digital product experience drives core business outcomes (e-commerce, fintech, subscription media, and B2C SaaS) and where analytics investment is treated as a strategic function rather than an operational cost.
Amplitude tracks user events and surfaces behavioral patterns through Pathfinder (user journey visualization), Behavioral Cohorting (segment users by what they do, not who they are), and integrated A/B experimentation, a more analytically powerful stack than Mixpanel or Firebase, but one requiring greater analytics sophistication and budget commitment to use effectively.
Amplitude is publicly traded (Nasdaq: AMPL) and serves enterprise customers including Atlassian, NBCUniversal, Under Armour, and Shopify (Amplitude.com, 2025), confirming Amplitude’s strongest product-market fit at the growth-to-enterprise stage where the platform’s depth justifies its cost.
Key Features
- Pathfinder: Amplitude’s Pathfinder reveals the actual sequences users follow through a mobile app (including unexpected paths that drive retention or churn) enabling product teams to redesign information architecture based on observed user behavior rather than assumed ideal flows.
- Behavioral Cohorting: Amplitude’s Behavioral Cohorting segments users by what they do inside the product (specific event sequences, feature usage patterns) rather than by demographics, allowing teams to isolate users who activated a specific feature and then retained at 2x the baseline rate without SQL dependency (adapty.io, 2026).
- Integrated A/B Experimentation: Amplitude’s integrated experimentation engine allows teams to run product experiments and measure behavioral results inside the same analytics environment where cohort and retention data live, eliminating friction from syncing test results across separate tools.
- AI Assistant: Amplitude’s “Ask Amplitude” AI Assistant supports natural-language querying of behavioral data, though the broader practitioner community characterizes current AI analytics implementations as “natural language queries that write SQL and return charts” rather than transformative intelligence (u/middlerange, r/SaaS, 2025).
- Functional Free Tier: Amplitude’s free tier includes up to 10 million monthly events (or approximately 50,000 monthly tracked users, confirmed by Amplitude employee u/amplichris on r/ProductManagement, 2026), providing a functional seed-stage analytics environment at zero licensing cost.
Best For
Amplitude is best for product managers and data analysts at growth-stage and enterprise mobile apps in verticals where product experience is mission-critical (specifically e-commerce, fintech, subscription media, and social apps) who are ready to treat analytics as a strategic investment and need Behavioral Cohorting, user journey intelligence, and structured experimentation that exceed what Mixpanel’s more accessible interface can deliver.
Pricing
Amplitude’s Free plan includes up to 10 million monthly events (approximately 50,000 monthly tracked users per Amplitude employee u/amplichris, r/ProductManagement, 2026). The Startup plan covers up to 200,000 MTUs or 100 million events. The Growth plan is $995/month for up to 100 million monthly events. Enterprise plans are custom-quoted. Practitioners with high-volume consumer apps report returning to the free tier after enterprise plan costs became unaffordable, teams evaluating Amplitude should model MAU growth trajectory against the $995/month threshold before committing. Pricing verified June 2026, verify current tier limits at amplitude.com/pricing.
Strengths
- Amplitude holds a 4.5/5 G2 rating from over 2,900 verified reviews as of 2026 (G2, 2026) (the highest review volume of any tool in this evaluation) providing the broadest practitioner consensus base for evaluating real-world product quality and support experience.
- Amplitude is described by multiple independent reviewers as “clearly the better solution for large companies needing detailed information and analysis” and as delivering “the deepest and most precise product analytics”, a capability assessment consistent across mcgaw.io (2026) and adapty.io (2026) comparative analyses.
- Amplitude’s named customer base: including Atlassian, NBCUniversal, Under Armour, and Shopify across B2B SaaS, media, retail, and sports verticals (Amplitude.com, 2025), provides institutional credibility for enterprise procurement decisions where vendor longevity and reference customers are required evaluation criteria.
- Amplitude’s Behavioral Cohorting and Pathfinder capabilities enable product decisions no other tool in this evaluation can support: isolating the in-product event sequence that predicts 90-day retention, identifying the exact path users take before churning, and segmenting based on behavioral signals rather than demographic proxies.
Limitations
- Cost at Scale: Amplitude’s most consequential trade-off is cost at scale, while the $995/month Growth plan is manageable for mid-market teams, practitioners with high-volume consumer apps document returning to the free tier after enterprise pricing became “unaffordable” (u/Jon-A-Thon, r/ProductManagement, 2026), and the price-per-insight ratio deteriorates rapidly for apps that exceed the Growth plan’s event threshold without justifying a full enterprise contract.
- No Attribution Coverage: Amplitude does not cover mobile attribution: Amplitude’s instrumentation begins after install, not at the ad click, meaning paid UA teams must run AppsFlyer alongside Amplitude, increasing total stack cost and creating data reconciliation complexity between two separate platforms.
- Steep Learning Curve: Amplitude’s consistently documented steep learning curve requires analytics expertise that lean startup teams may not yet have on staff, making Mixpanel the stronger choice until the team includes a dedicated data analyst or product analyst role (UserGuiding, 2026).
Verdict
Amplitude is the most analytically powerful product intelligence platform in this evaluation, with a 4.5/5 G2 rating from 2,900+ verified reviews and the deepest Behavioral Cohorting and Pathfinder user journey capabilities of any tool for mobile teams in 2026. Amplitude is the correct choice for data-mature teams at growth-to-enterprise mobile apps in verticals where product experience is a primary competitive differentiator, specifically e-commerce, fintech, subscription media, and social apps where behavioral cohort intelligence directly informs roadmap and experimentation decisions. Teams evaluating Amplitude should model total stack cost against their MAU growth trajectory before committing, as the pricing transition from the functional free tier to enterprise-level pricing can be abrupt for high-volume consumer apps.
3. Google Analytics for Firebase: Best Free Analytics Foundation for Any Mobile App Team
Category: Free Analytics Foundation, event instrumentation, crash reporting, and baseline behavioral tracking for mobile apps, embedded within Google’s Firebase development platform at zero licensing cost.
At a Glance
- Category: Free Analytics Foundation
- Best For: Early-stage mobile teams, indie developers, and any app team needing zero-cost event instrumentation with Google Ads integration, crash monitoring via Crashlytics, and access to Firebase’s bundled development ecosystem before any paid analytics investment is justified
- Price Range: Free for core analytics (no event cap); costs arise only from Firebase infrastructure services (Firestore, Cloud Functions, Storage) on the Blaze pay-as-you-go plan, not from the analytics product itself
- Primary Strength: Google Analytics for Firebase is the only tool in this evaluation with a genuinely unlimited free tier for core mobile analytics, making it the universal starting point for any app team before paid analytics investment is justified
- Biggest Limitation: Firebase’s cohort analysis is characterized by independent reviewers as “basic only” and its funnel reporting as “basic templates,” and its attribution model is limited to Google Ads, making it insufficient as a standalone tool for multi-channel paid UA measurement or advanced behavioral product analysis
- One-Line Summary: Google Analytics for Firebase is the universal mobile analytics foundation used by the majority of early-stage app teams, offering unlimited event tracking, Crashlytics crash reporting, and native Google Ads integration at zero licensing cost as part of Google’s mobile development ecosystem.
- Last Verified: June 2026
Overview
Google Analytics for Firebase is a free, unlimited mobile analytics and event instrumentation service embedded within Google’s Firebase development platform, designed as the analytics foundation for any iOS or Android app team (from solo developers to growing startups) that needs to track user events, measure engagement, and connect behavioral data to Google Ads campaigns without upfront software cost.
Firebase Analytics supports up to 500 distinct event types per app and automatically captures foundational events including first_open and session_start with no monthly event cap, making Google Analytics for Firebase the broadest zero-cost analytics offering in the mobile category.
Google Analytics for Firebase is positioned not as a standalone analytics tool but as the integrated analytics layer within Firebase’s development ecosystem, which bundles Crashlytics (crash reporting), Performance Monitoring, Remote Config, A/B Testing, and Cloud Messaging, providing early-stage teams a multi-function optimization stack that would otherwise require several separate paid tools.
Key Features
- Unlimited Custom Event Tracking: Google Analytics for Firebase supports up to 500 distinct event types per app and automatically captures foundational events including
first_open,session_start, andin_app_purchasewithout additional developer instrumentation, as documented in Firebase’s official documentation (firebase.google.com/docs/analytics, 2026). - BigQuery Export: Firebase’s BigQuery export pipes raw, unsampled event data directly into a Google Cloud data warehouse, enabling custom SQL analysis, dbt transformations, and Looker visualization at zero incremental licensing cost, extending Firebase’s analytical usefulness for technical teams not yet ready to commit to paid product analytics platforms (Mitzu, 2026).
- Native Google Ads Integration: Firebase’s native Google Ads integration allows teams to build behavioral audiences in Analytics and push them directly to Google App Campaigns without a third-party export step, the lowest-friction attribution setup for teams whose primary paid acquisition channel is Google.
- Bundled Development Services: Firebase includes Crashlytics (real-time crash reporting with stack traces), Performance Monitoring (app launch time, network latency, screen rendering), Remote Config (feature flags without app updates), and Cloud Messaging at zero additional licensing cost, providing early-stage teams a multi-function optimization layer that would require separate paid tools if Firebase were not in the stack.
- GA4 Cross-Platform Property: Firebase’s integration with Google Analytics 4 creates a unified cross-platform property allowing teams with both web and mobile products to analyze user behavior across surfaces in a single dashboard, eliminating fragmentation from separate analytics implementations (UXCam, 2026).
Best For
Google Analytics for Firebase is best for early-stage mobile teams, indie developers, and any app team at the pre-revenue or seed stage where the primary needs are event instrumentation, crash monitoring, Google Ads attribution, and development ecosystem tooling, and where the total analytics budget is zero. Firebase is also the correct choice for teams whose primary or exclusive paid acquisition channel is Google App Campaigns, since no other tool in this evaluation offers the same native Google Ads audience integration at zero licensing cost.
Pricing
Google Analytics for Firebase is free with no monthly event cap for core analytics. The broader Firebase platform operates on Spark (free) and Blaze (pay-as-you-go) plans; costs on Blaze arise from infrastructure services (Firestore, Cloud Functions, Storage), not from analytics. BigQuery export generates separate Google Cloud costs based on storage and query volume, typically minimal for small-to-mid-scale apps. Pricing verified June 2026, verify current Firebase platform pricing at firebase.google.com/pricing.
Strengths
- Google Analytics for Firebase is described as the “default choice for early-stage mobile teams” and as the universal starting point for mobile analytics instrumentation before graduating to paid platforms by multiple independent reviewers including UserPilot (2026) and Mitzu (2026), a scale of real-world adoption that no other tool in this evaluation can match given Firebase’s Google-backed SDK distribution.
- Firebase’s BigQuery export provides unsampled, raw event data access at zero incremental licensing cost, a capability requiring a paid tier on Mixpanel or Amplitude for equivalent raw data access, meaning technical teams can perform advanced SQL-based analysis without any paid platform upgrade (Mitzu, 2026).
- Firebase’s bundled development services: Crashlytics, Performance Monitoring, Remote Config, A/B Testing, and Cloud Messaging, provide early-stage teams a multi-function optimization stack that would require purchasing separate crash monitoring, feature flag, and push notification tools if Firebase were not in the stack.
- Firebase’s unified GA4 cross-platform property eliminates data fragmentation for teams running both web and mobile products, enabling cross-surface user journey analysis in a single reporting environment without additional instrumentation cost (UXCam, 2026).
Limitations
- Shallow Analytics Depth: Firebase’s most consequential trade-off is analytics depth, independent comparisons characterize Firebase’s cohort analysis as “basic only” and its funnel reporting as “basic templates” Mitzu comparative analysis, 2026; the practical upgrade trigger is the moment a team exports Firebase data to a spreadsheet to answer a “which users retained at 30 days” question that Firebase’s basic cohort view cannot answer, at that moment, Mixpanel or Amplitude is the evidence-backed next investment.
- Google Ads-Only Attribution: Firebase’s attribution model is limited to Google Ads (last-click and last-engagement models, with standard UTM parameters for other channels), meaning any team running paid acquisition across Meta, TikTok, or multiple ad networks cannot use Firebase alone for cross-channel measurement accuracy Infotrust, 2026, a material constraint for growth-stage teams with multi-channel UA programs.
- Developer-Centric UI: Firebase’s console is optimized for developers rather than product managers or growth marketers, meaning self-serve behavioral analysis requires more technical fluency than Mixpanel or Amplitude’s purpose-built PM interfaces, creating a dependency on engineering time to answer product questions that standalone analytics platforms eliminate (UserPilot, 2026).
Verdict
Google Analytics for Firebase is the universal mobile analytics starting point in 2026, offering unlimited event tracking, crash reporting via Crashlytics, and Google Ads integration at zero licensing cost for any app team regardless of stage or budget. Firebase is the appropriate first instrumentation choice for most mobile teams without an existing analytics implementation, not because Firebase is the most capable tool in this evaluation, but because Firebase eliminates the cost of delayed analytics instrumentation and provides a functional foundation extendable via BigQuery without a paid platform upgrade. Teams should plan their Firebase-to-paid-analytics transition proactively: when cohort quality, funnel depth, or B2B group analytics requirements exceed Firebase’s basic capabilities, Mixpanel (for startup ease and B2B apps) or Amplitude (for data-mature growth teams) is the evidence-backed next investment.
4. AppTweak: Best ASO Intelligence Platform for Dedicated Optimization Practitioners
Category: ASO Intelligence, app store keyword research, ranking analytics, competitive monitoring, and Apple Search Ads campaign management for dedicated ASO practitioners and growth marketing teams.
At a Glance
- Category: ASO Intelligence
- Best For: Dedicated ASO specialists and growth marketing teams at mid-market and growth-stage mobile apps needing data-quality-first keyword intelligence, competitive metadata monitoring, and unified Apple Search Ads plus organic ASO management in one platform
- Price Range: ~$59/month entry-level; $549/month Scale (or $6,590/year); Enterprise custom
- Primary Strength: AppTweak is identified by experienced ASO practitioners as “the data quality leader today,” with Atlas AI trained on 10+ years of app store data and an organic installs-per-keyword metric that directly answers the ROI justification question for ASO investment
- Biggest Limitation: AppTweak’s entry pricing of ~$59/month is characterized as prohibitively high for pre-revenue and very early-stage apps in indie developer communities, and AppTweak does not cover mobile attribution or behavioral analytics, requiring stack pairing with additional paid tools
- One-Line Summary: AppTweak is the ASO intelligence and Apple Search Ads management platform rated highest for data quality by experienced practitioners, with a 4.6/5 G2 score, Atlas AI trained on 10+ years of app store data, and integrated paid-and-organic optimization tools used by 2,000+ mobile teams including Uber, Adobe, and Zynga as of 2026.
- Last Verified: June 2026
Overview
AppTweak is an App Store Marketing and Intelligence platform that combines ASO keyword research, ranking analytics, Apple Search Ads campaign management, app review monitoring, and market intelligence into a unified dashboard used by more than 2,000 mobile teams globally, including Uber, Adobe, and Zynga (AppTweak.com, 2026), making AppTweak the most feature-complete operational ASO tool among the platforms evaluated in this review for teams with a dedicated optimization function.
AppTweak’s Atlas AI is trained on more than 10 years of app store data across 100+ countries and publishes a 90% average accuracy claim in key markets for download and revenue estimates, this is a vendor-published figure that should be independently validated before being used in any internal business case, as noted in AppTweak’s Limitations section below.
AppTweak is the most frequently personally recommended ASO tool among active practitioners in r/AppStoreOptimization communities, an organic endorsement signal that review platform scores alone cannot replicate.
Key Features
- Metadata Keyword Picker: AppTweak’s Metadata Keyword Picker maps keyword research directly to ranking performance data and connects metadata optimization decisions to measurable ranking outcomes, bridging the gap between keyword identification and actionable title, subtitle, and keyword field changes that produce store ranking improvements (AppTweak LLM/AI info page, 2026).
- Atlas AI with Organic Installs-per-Keyword: AppTweak’s Atlas AI delivers keyword volume, relevancy, difficulty scores, and organic installs-per-keyword estimates, a metric that moves beyond generic keyword difficulty to actual download attribution per keyword, directly answering the ROI justification question for ASO budget decisions.
- Apple Search Ads Campaign Manager: AppTweak’s Campaign Manager integrates Apple Search Ads campaign management directly into the ASO intelligence platform, allowing growth teams to optimize both organic keyword rankings and paid Apple Search Ads campaigns in a single interface, the only ASO platform in this evaluation offering this unified paid-and-organic capability.
- Reporting Studio: AppTweak’s Reporting Studio merges data from App Store Connect, Google Play Console, and Mobile Measurement Partners (AppsFlyer, Adjust) into a unified performance dashboard, providing a single view of organic and paid acquisition performance without manual data consolidation from multiple sources.
- Competitor Intelligence: AppTweak monitors competitor keyword strategies, creative updates, and A/B tests across both the App Store and Google Play, surfacing competitive intelligence about metadata changes that allows teams to respond to competitor optimization moves before those moves affect relative ranking positions.
Best For
AppTweak is best for growth marketing teams, ASO specialists, and mobile marketers at mid-market apps (Series A and beyond, or apps generating meaningful organic download volume) who have a dedicated person or team responsible for ASO and need data-quality-first keyword intelligence and Apple Search Ads integration, rather than a lightweight tool for one-time metadata optimization that any free ASO tool can perform.
Pricing
AppTweak’s entry-level plans start at approximately $59/month. The Scale plan is $549/month (or $6,590/year). Enterprise plans are custom-quoted. The $59/month entry price is described by indie developer communities as a barrier for pre-revenue apps where keyword optimization ROI has not yet been established. Pricing verified June 2026, verify current tier features at apptweak.com/en/pricing before budgeting.
Strengths
- AppTweak holds a 4.6/5 rating on G2 and a 4.2/5 rating on Capterra as of 2026 AppFollow ASO tools roundup, 2026, the strongest dual-platform review profile of any dedicated ASO intelligence tool in this evaluation, with a named customer roster including Uber, Adobe, and Zynga confirming AppTweak’s fit across mobility, creative software, and gaming verticals (AppTweak.com, 2026).
- AppTweak is cited as “the data quality leader today” by u/Vivid_Log9337 (r/androiddev, 2024) and as “my personal fave” by u/tomroxspurs (r/AppStoreOptimization), organic practitioner endorsements from users who have directly compared multiple competing ASO platforms, providing trust signal that vendor marketing cannot replicate.
- AppTweak’s Apple Search Ads Campaign Manager positions AppTweak as the only ASO platform in this evaluation that manages both organic keyword optimization and paid App Store advertising in a single interface, a structural advantage for teams where paid and organic strategy must be coordinated to avoid keyword cannibalization and split optimization priorities.
- AppTweak’s Atlas AI dataset spans 10+ years of historical app store data going back to AppTweak’s founding in 2014 and covers 100+ countries, one of the deepest historical ASO datasets in the category, forming the foundation for the download estimate modeling and trend analysis that practitioners cite as AppTweak’s primary data quality advantage (AppTweak blog, 2026).
Limitations
- Pricing vs. ROI Threshold: AppTweak’s most consequential trade-off is pricing threshold relative to optimization ROI, at ~$59/month for an entry plan, AppTweak is cost-prohibitive for apps at the pre-revenue or very early stage where keyword traffic volume has not reached the point where metadata optimization produces measurable download lift, and the practitioner consensus that “all ASO tools are similar for indie developers” (u/Forward-Educator3822, r/AppStoreOptimization, 2025) directly challenges AppTweak’s value proposition below a certain app scale.
- No Attribution or Analytics Coverage: AppTweak does not cover mobile attribution or behavioral analytics, meaning teams with paid UA programs and retention KPIs must pair AppTweak with AppsFlyer and Mixpanel or Amplitude respectively, potentially tripling the monthly tool budget beyond AppTweak’s Scale plan cost alone.
- Unverified Accuracy Claim: AppTweak’s vendor-published “90% accuracy” claim for its download and revenue estimates has not been independently validated and should be scrutinized rather than cited as fact before any internal business case is built on AppTweak’s data quality claims (AppTweak alternative to Sensor Tower comparison page).
Verdict
AppTweak is the highest-rated ASO intelligence platform for dedicated optimization practitioners in 2026, with a 4.6/5 G2 score, organic community endorsement from active r/AppStoreOptimization practitioners, and the integrated Apple Search Ads management capability that no other ASO tool in this evaluation offers. AppTweak is the correct investment for any mobile team with a dedicated ASO function and meaningful organic download volume, the data quality advantage and unified paid-organic view justify the $549/month Scale commitment for teams where ASO is a primary growth lever. Teams without a dedicated ASO manager or without established organic traffic volume should evaluate whether a lower-cost entry tool adequately meets basic keyword research needs before committing to AppTweak’s pricing structure.
5. AppsFlyer: Best Mobile Attribution Platform (MMP) for Paid User Acquisition Teams
Category: Mobile Attribution (MMP), independent install and event attribution across all paid and organic channels, deep linking, fraud prevention, and privacy-safe measurement for apps with active paid user acquisition programs.
At a Glance
- Category: Mobile Attribution (MMP)
- Best For: Mobile growth teams and paid user acquisition managers at apps spending meaningfully on multi-channel paid acquisition (Meta, Google, TikTok, DSPs) who need independent attribution arbitration that Firebase’s Google Ads-only model cannot provide
- Price Range: Zero plan free (12K lifetime non-organic installs, SKAN 4.0 included); Growth ~$0.07/conversion after Welcome Package; Enterprise average $88,500/year (Vendr marketplace data, 2026; range $30K–$300K+)
- Primary Strength: AppsFlyer provides the most broadly integrated mobile attribution infrastructure available, with OneLink deep linking practitioners cite as the most reliable deferred deep linking implementation (u/Gilligan2404, r/SideProject, 2026) and connections to Meta, Google, Snapchat, and hundreds of ad network partners
- Biggest Limitation: AppsFlyer’s billing model has documented complexity risks (including a specific UI toggle that continued generating charges after service deactivation in a documented Reddit case (r/AppsFlyer, October 2024, acknowledged by an AppsFlyer employee)) and iOS attribution precision has materially degraded post-Apple ATT for apps with high iOS traffic share
- One-Line Summary: AppsFlyer is the market-leading Mobile Measurement Partner for multi-channel paid user acquisition teams, with SKAN 4.0-compliant iOS attribution, OneLink deep linking practitioners describe as the most reliable available, Protect360 fraud prevention, and the broadest ad network integration roster of any MMP in the market as of 2026.
- Last Verified: June 2026
Overview
AppsFlyer is a mobile attribution and marketing analytics platform that serves as an independent Mobile Measurement Partner (MMP), positioned between an app and its ad networks to provide neutral, third-party attribution of which campaign, channel, or creative deserves credit for each app install, in-app purchase, or retention event. AppsFlyer solves the systematic double-counting problem that occurs when multiple ad networks each claim credit for the same user acquisition.
AppsFlyer’s core products cover attribution, fraud prevention (Protect360), deep linking (OneLink), audience segmentation, SKAN 4.0-compliant iOS measurement, and privacy-safe data collaboration, making AppsFlyer the most comprehensive attribution infrastructure available for mobile teams with active paid UA programs across multiple ad networks.
AppsFlyer is the essential tool for any mobile growth team spending meaningfully on multi-channel paid acquisition where Firebase’s Google Ads-only attribution model leaves significant measurement blind spots across Meta, TikTok, and programmatic channels. Teams should review the ATT context section earlier in this article before evaluating iOS attribution precision for their specific audience.
Key Features
- Single Source of Truth Attribution: AppsFlyer’s attribution model tracks installs, in-app events, and revenue across all integrated ad network partners and provides a Single Source of Truth for campaign performance, eliminating the attribution discrepancy problem that occurs when multiple ad networks each claim credit for the same install (AppsFlyer attribution model documentation, 2026).
- OneLink Deep Linking: AppsFlyer’s OneLink handles deferred deep linking across iOS and Android (routing users through the install process and then to a specific in-app destination) and is described by practitioners as providing “more robust error handling” and “cleaner attribution data flow into analytics” than Branch and other alternatives (u/Gilligan2404, r/SideProject, 2026).
- Protect360 Fraud Prevention: AppsFlyer’s Protect360 fraud prevention suite uses machine learning to detect and filter fraudulent installs in real-time, protecting paid UA budgets from click injection, SDK spoofing, and device farm fraud across all integrated network partners.
- SKAN 4.0 Support: AppsFlyer’s SKAN 4.0 support: included in the free Zero plan, provides Apple’s privacy-preserving measurement framework for iOS 14.5+ users who have not opted into App Tracking Transparency, the only available attribution signal for the majority of iOS users in a post-ATT measurement environment.
- Broad Ad Network Integration: AppsFlyer integrates with Meta Ads, Google Ads, Snapchat, TikTok, and hundreds of additional ad network partners, the broadest integration roster of any MMP in the market, ensuring attribution visibility is maintained across virtually any paid channel a user acquisition team is likely to run (AppsFlyer official website, 2026).
Best For
AppsFlyer is best for mobile growth teams and paid user acquisition managers at apps spending meaningfully on multi-channel paid acquisition across Meta, Google, TikTok, or programmatic networks, specifically teams where accurate measurement of cost per install, LTV by channel, and campaign ROI directly determines UA budget allocation, and where Firebase’s Google Ads-only attribution creates material blind spots in cross-channel performance visibility.
Pricing
AppsFlyer’s Zero plan is free with SKAN 4.0 support and full SDK features, limited to 12,000 lifetime non-organic installs. The Growth plan charges approximately $0.07 per conversion after the Welcome Package; specific Welcome Package terms vary by contract. Enterprise plans are custom-quoted; Vendr marketplace data (2026) reports an average annual contract of $88,500 with a range of $30,000–$300,000+ depending on conversion volume, included modules (Protect360, Data Clean Room), and contract length. Teams should obtain a direct quote and explicitly map all billing mechanisms before signing any contract. Pricing verified June 2026, verify at appsflyer.com/pricing.
Strengths
- AppsFlyer’s OneLink deep linking is described by practitioners comparing it directly to Branch as “more robust once configured” with “better error handling” and “fewer production headaches” (u/Gilligan2404, r/SideProject, 2026), a reliability advantage with direct revenue implications for apps where broken post-install user flows represent material conversion loss.
- Vendr marketplace data (2026) reports an average AppsFlyer enterprise contract value of $88,500 with a range of $30,000–$300,000+ across enterprise deployments, a scale of institutional adoption that reflects practitioner confidence in AppsFlyer’s attribution reliability for high-budget UA operations at scale (Vendr, 2026).
- AppsFlyer integrates with Meta Ads, Google Ads, Snapchat, TikTok, and hundreds of ad network partners (a broader integration roster than any other MMP evaluated) ensuring attribution visibility is maintained regardless of which paid channels a team runs (AppsFlyer official website, 2026).
- AppsFlyer’s SKAN 4.0 support (included in the free Zero plan) provides the only compliant iOS attribution pathway for users who have not opted into ATT, the most critical technical compliance requirement for any app with significant iOS user acquisition spend in the post-ATT measurement environment as of June 2026.
Limitations
- Billing Complexity and Documented Risk: AppsFlyer’s most consequential trade-off is billing complexity combined with post-ATT signal degradation, a documented Reddit case (u/exclusivemobile, r/AppsFlyer, October 2024) describes a specific SKAN reporting UI toggle that continued generating charges after service deactivation, with the account ultimately escalated to a collections agency; an AppsFlyer employee acknowledged the issue publicly in the thread, confirming it as a real billing transparency risk rather than an isolated misunderstanding.
- Post-ATT iOS Signal Degradation: Apple’s App Tracking Transparency framework (which requires explicit user consent before cross-app tracking) has materially degraded deterministic iOS attribution for all MMPs including AppsFlyer; teams with iOS-heavy user bases should ask AppsFlyer to quantify current modeled attribution accuracy for their specific audience profile before justifying enterprise pricing at scale, as the signal loss is a structural reality unresolved as of June 2026.
- Single-Category Scope: AppsFlyer is exclusively an attribution and measurement tool (AppsFlyer does not provide behavioral analytics, ASO intelligence, or review management) meaning teams must budget for Mixpanel or Amplitude alongside AppsFlyer for in-product behavioral analysis, increasing total platform cost at growth stage.
Verdict
AppsFlyer is the market-leading Mobile Measurement Partner for multi-channel paid user acquisition teams in 2026, with the broadest ad network integration roster, the most practitioner-endorsed deep linking reliability, and SKAN 4.0 support required for compliant iOS measurement post-Apple ATT. AppsFlyer is the correct choice for any app team spending meaningfully on paid acquisition across multiple ad networks where Firebase’s single-channel attribution leaves critical measurement gaps, but teams must conduct a detailed billing review before contract signing and should model iOS attribution signal degradation into ROI expectations for iOS-heavy audiences. Teams not yet running significant multi-channel paid UA should stay on the free Zero plan until conversion volume justifies the Growth plan’s per-conversion cost.
6. AppFollow: Best App Review Management Platform, The Overlooked ASO Optimization Layer
Category: Review Management, app store review monitoring, AI-assisted response automation, sentiment analysis, and multi-store CX workflow management for consumer apps with active review volumes.
At a Glance
- Category: Review Management
- Best For: Customer experience leads, support managers, and product teams at consumer apps with high monthly review volumes who need to automate response workflows, aggregate feedback across multiple storefronts, and route review sentiment into helpdesk systems without proportionally scaling CX headcount
- Price Range: Free (1 app, basic features); Startup ~$111/month (5 apps); ~$179/month next tier; Enterprise custom
- Primary Strength: AppFollow delivers AI-assisted review response automation, 7-storefront aggregation, and Zendesk integration that a Head of CX at a 150-person consumer subscription company reported saves the support team approximately five hours per week compared to manual spreadsheet tracking (u/Old_Campaign5285, r/customerexperience, May 2026)
- Biggest Limitation: AppFollow’s ASO keyword intelligence is supplementary to its review management core, teams needing deep competitive keyword research or market sizing must pair AppFollow with a dedicated ASO tool like AppTweak, adding $59–$549/month to the stack
- One-Line Summary: AppFollow is the leading app review management platform for consumer apps, with a 4.6/5 G2 rating from 194 verified reviews, AI-assisted response automation, aggregated coverage across seven storefronts including iOS, Android, Amazon, and Huawei, and Zendesk integration, saving teams approximately five hours per week versus manual tracking as of May 2026.
- Last Verified: June 2026
Overview
AppFollow is an enterprise review management platform that centralizes review monitoring, AI-assisted response automation, sentiment analysis, keyword tracking, and competitive review intelligence across seven app storefronts (iOS App Store, Google Play, Mac App Store, Amazon Appstore, Huawei AppGallery, Samsung Galaxy Store, and Microsoft Store) in a single operational dashboard that no app store console or general-purpose analytics tool replicates.
AppFollow is distinguished from all other tools in this evaluation by its primary focus on review operations: app store rating algorithms in both the App Store and Google Play incorporate review velocity, average star rating, and developer response rate into category ranking calculations, making AppFollow a direct lever on store listing optimization, not merely a customer service tool.
AppFollow’s core value proposition for teams currently managing reviews manually is the reduction of labor through automation: AI-generated responses, rule-based routing by rating and language, and helpdesk integrations that compress the response window from days to minutes.
Key Features
- AI-Assisted Response Automation: AppFollow’s AI-assisted review response automation generates replies based on review content, star rating, language, and configurable rules, enabling support teams to maintain consistent, prompt response rates across thousands of monthly reviews without proportionally increasing review management headcount (AppFollow official blog, 2026).
- 7-Storefront Aggregation: AppFollow’s multi-store aggregation covers iOS App Store, Google Play, Mac App Store, Amazon Appstore, Huawei AppGallery, Samsung Galaxy Store, and Microsoft Store in a single dashboard, the broadest multi-storefront review management platform for globally distributed apps publishing across multiple storefronts.
- Helpdesk Integrations: AppFollow’s integrations with Zendesk, Slack, Jira, and Microsoft Teams create a closed operational loop where negative reviews automatically trigger support tickets or team alerts, compressing the response window from days (manual monitoring) to minutes (automated routing upon review submission).
- Auto-Translation: AppFollow’s auto-translation capability handles review management in local languages, specifically valuable for apps with significant user bases in Asian and European markets where incoming review content in Japanese, Korean, Chinese, or other languages cannot be processed at scale by manual English-speaking support teams (u/ereto2, r/Entrepreneur, 2019).
- Competitor Review Monitoring: AppFollow monitors competitor apps’ review sentiment trends, rating movements, and recent review themes, providing product intelligence about competitor strengths and user-reported weaknesses drawn from real customer feedback rather than competitor marketing materials (AppFollow blog, 2026).
Best For
AppFollow is best for customer experience leads, support managers, and product teams at consumer subscription apps, marketplace apps, and gaming apps with high monthly review volumes, specifically teams currently managing reviews manually in spreadsheets or through app store consoles who need to automate response workflows, aggregate multi-store feedback, and connect review sentiment to support ticket systems without expanding CX headcount proportionally to review volume growth.
Pricing
AppFollow’s Free tier covers 1 app with basic monitoring features. The Startup plan is approximately $111/month and covers 5 apps. The next pricing tier is approximately $179/month. Enterprise plans are custom-quoted on a per-app basis for large portfolios. A Head of CX at a 150-person consumer subscription app documented approximately 5 hours per week in saved labor versus manual spreadsheet tracking (u/Old_Campaign5285, r/customerexperience, May 2026), at typical CX labor rates, the ROI payback period is approximately 2–3 weeks versus the $111/month Startup plan cost. Pricing verified June 2026, verify current tier features at appfollow.io/pricing.
Strengths
- AppFollow holds a 4.6/5 G2 rating from 194 verified reviews as of 2026 (G2, per AppFollow blog citation, 2026), with reviewers specifically identifying ease of use, ease of setup, and ease of doing business with the company as AppFollow’s top-rated dimensions, precisely the criteria that matter most to CX teams without dedicated procurement or data engineering support.
- A Head of CX at a 150-person consumer subscription app reported that AppFollow “probably saves the support team 5 hours a week vs the spreadsheet they used to keep” for monitoring iOS and Android reviews with rating-drop alerts and competitor app tracking (u/Old_Campaign5285, r/customerexperience, May 2026), translating to approximately 260 hours of recovered annual labor, a documented ROI that exceeds the Startup plan cost within weeks.
- AppFollow’s 7-storefront coverage (iOS, Android, Mac, Amazon, Huawei, Samsung, Microsoft) is the broadest multi-store review management scope of any tool in this evaluation, making AppFollow the highest-coverage choice for publishers with apps across multiple platforms who need unified review intelligence without toggling between individual store console dashboards.
- AppFollow’s Trustpilot integration (added in 2025 per AppFollow product update blog) extends AppFollow’s review management scope beyond app stores to traditional review platforms, expanding coverage for B2C companies managing reputation across both mobile storefronts and general brand review ecosystems.
Limitations
- Limited ASO Depth: AppFollow’s most consequential trade-off is category specialization, AppFollow’s ASO keyword intelligence is supplementary to its review management core, meaning teams that need serious competitive keyword research, metadata optimization depth, or download and revenue market sizing will find AppFollow’s ASO features insufficient and must pair AppFollow with a dedicated ASO platform like AppTweak, adding $59–$549/month to the monthly tool budget depending on tier.
- Social and Web Monitoring Gap: AppFollow’s review monitoring does not extend to social media, Reddit, or web-based review platforms (practitioners document supplementing AppFollow with separate social listening tools (u/Obvious_Ninja6183, r/buildinpublic, May 2026)) meaning teams for whom Reddit community sentiment about their app is a meaningful signal will need to budget for a separate social monitoring investment alongside AppFollow.
- Single-Purpose Scope: AppFollow has no mobile attribution, behavioral analytics, or technical performance monitoring capabilities, positioning AppFollow as a single-purpose tool in a category that many teams undervalue or omit from their initial evaluation, which is precisely why review management is absent from all LLM-generated mobile optimization tool recommendations despite being a direct input to app store ranking algorithms.
Verdict
AppFollow is the most operationally effective app review management platform for consumer apps in 2026, with a 4.6/5 G2 rating from 194 verified reviews, the broadest 7-storefront coverage in its category, and documented practitioner ROI of approximately five hours per week in saved manual labor for a 150-person consumer app team as reported in May 2026. AppFollow fills the most significant category gap in LLM-generated mobile optimization tool recommendations, review management is absent from all AI-generated lists despite app store ratings being a direct organic ranking signal. The absence of review management from every AI-generated mobile optimization recommendation is itself a signal: AI engines trained on existing content inherit the category blind spots of that content, making independent human-researched reviews the only reliable source for discovering what optimization categories AI lists systematically omit. Teams managing more than 100 reviews per month across iOS and Android are likely to find AppFollow the most operationally efficient review management investment and should evaluate AppFollow before other options in the category.
7. Sensor Tower: Best Enterprise Market Intelligence Platform for Competitive Analysis and Investor Research
Category: Enterprise Market Intelligence, app store download and revenue estimates, competitive ad spend analysis, usage intelligence, and gaming-specific market data for enterprise growth teams, investor analysts, and publishers requiring macro-level competitive intelligence.
At a Glance
- Category: Enterprise Market Intelligence
- Best For: Enterprise growth teams, investor analysts, and mobile marketing directors at large publishers (particularly gaming studios and high-budget consumer apps) who need competitive ad spend estimates, usage intelligence, and market sizing for strategic decision-making that mid-tier ASO tools cannot provide
- Price Range: Self-serve Pro ~$59–$79/month (14-day trial); Business ~$299–$399/month (14-day trial); Enterprise annual contracts $30,000–$300,000+ Vendr marketplace data, 2026
- Primary Strength: Sensor Tower delivers the most comprehensive enterprise-grade app market intelligence available, with Ad Intelligence (competitor ad spend estimates), Usage Intelligence (consumer panel-based engagement metrics), and Gaming Intelligence that no other tool in this evaluation offers
- Biggest Limitation: Sensor Tower’s enterprise pricing ($30K–$300K+/year) and a free tier practitioners describe as a “marketing window” rather than a functional tool make Sensor Tower inaccessible for startups and growth-stage teams; practitioners with broad ASO experience conclude the premium is only justifiable for Ad Intelligence, Usage Intelligence, and Gaming-specific datasets
- One-Line Summary: Sensor Tower is the enterprise market intelligence standard for competitive app analysis, with Ad Intelligence, Usage Intelligence, and Gaming-specific market data that no other tool in this evaluation provides, at enterprise pricing that reflects a proprietary panel-based data advantage, with contracts ranging from $30,000 to $300,000+ per year Vendr marketplace data, 2026.
- Last Verified: June 2026
Overview
Sensor Tower is a multi-module mobile app market intelligence platform offering App Intelligence (downloads, revenue, rankings, keyword tracking), Store Intelligence (category-level market sizing), Ad Intelligence (creative performance and estimated ad spend), Usage Intelligence (active users, engagement metrics), and Gaming Intelligence, serving enterprise mobile teams, investors, and competitive intelligence analysts who need strategic-level app ecosystem data rather than the operational ASO workflow tools that serve the majority of the target audience in this review.
Sensor Tower was founded in 2013 and has built 13+ years of historical app store data into an enterprise intelligence platform serving the gaming, entertainment, and high-budget consumer app markets. Sensor Tower’s strongest product-market fit is at the enterprise level where competitive market intelligence at scale justifies Sensor Tower’s significant pricing premium over mid-tier alternatives.
Sensor Tower occupies a distinct market position from operational tools like AppTweak: where AppTweak serves the daily workflow of an ASO practitioner optimizing keyword metadata, Sensor Tower serves the strategic workflow of a growth director benchmarking market share, an investor conducting due diligence, or a gaming studio tracking competitor ad creative rotation.
Key Features
- App Intelligence: Sensor Tower’s App Intelligence module tracks download and revenue estimates, keyword rankings, and competitor metadata changes across both the App Store and Google Play, providing the competitive positioning foundation for market entry analysis and category benchmarking (Sensor Tower official website, 2026).
- Ad Intelligence: Sensor Tower’s Ad Intelligence module estimates competitor ad spend and tracks ad creative performance across major mobile advertising networks, enabling UA teams to identify which creative formats and audience messaging are performing for competitors before committing equivalent investment to similar assets; this capability is unavailable in any other tool in this evaluation.
- Usage Intelligence: Sensor Tower’s Usage Intelligence module provides active user estimates and engagement metrics derived from a proprietary consumer panel, data unavailable through app store consoles or standard ASO tools, positioning Sensor Tower above all other tools in this evaluation for market-share benchmarking at the strategic level.
- Gaming Intelligence: Sensor Tower’s Gaming Intelligence module delivers game-specific market data including genre performance trends, player spending patterns, and competitive download benchmarks, the most specialized capability in this evaluation for mobile gaming studios with a formal competitive intelligence mandate.
- Store Intelligence: Sensor Tower’s Store Intelligence provides category-level market sizing data, enabling growth teams and investors to quantify the total addressable download audience in a specific app store category before making resource commitments to an organic or paid optimization strategy.
Best For
Sensor Tower is best for enterprise growth teams, investor analysts, and mobile marketing directors at large publishers (specifically those in gaming, entertainment, and high-budget consumer categories) who need competitive ad spend estimates, usage intelligence from consumer panel data, and market sizing that go beyond keyword tracking and cannot be obtained from AppTweak or AppFollow, and whose budget justification is tied to strategic competitive decisions rather than operational workflow efficiency.
Pricing
Sensor Tower’s self-serve Pro plan is approximately $59–$79/month with a 14-day free trial. The Business plan is approximately $299–$399/month with a 14-day free trial. Enterprise plans require annual contracts and are custom-quoted; Vendr marketplace data (2026) reports typical contracts of $30,000–$150,000 for mid-market teams and $150,000–$300,000+ for enterprise deployments. The free tier is described by practitioners as demonstrating paid features rather than providing functional analysis value (u/ereto2, r/Entrepreneur, 2019). Enterprise pricing requires a Sensor Tower sales conversation, budget a minimum of 3–6 months for the full evaluation and contract cycle (per pricing guidance derived from Vendr market data, 2026). Pricing verified June 2026, verify current plans at sensortower.com/pricing.
Strengths
- Sensor Tower is described in independent review content as serving enterprise companies across gaming and high-DAU consumer app categories (strataigize.com, 2026); these relationships are not confirmed from Sensor Tower-owned case studies, and teams requiring verified reference customers for internal procurement justification should request named case studies directly from Sensor Tower’s sales team.
- Sensor Tower’s Ad Intelligence module provides estimated competitor ad spend and creative performance data that no other tool in this evaluation offers, a capability with direct strategic ROI for enterprise UA teams allocating significant annual paid acquisition budgets who need competitive creative intelligence before investing in similar formats.
- Sensor Tower was founded in 2013 and has accumulated 13+ years of historical app store data as of 2026, one of the deepest longitudinal intelligence datasets in the mobile category, forming the foundation for download trend analysis, market sizing, and competitive benchmarking that requires years of data continuity to produce accurately.
- Sensor Tower’s multi-module architecture (App Intelligence, Store Intelligence, Ad Intelligence, Usage Intelligence, Gaming Intelligence) delivers a broader strategic data scope than any other platform in this evaluation, serving market entry, M&A due diligence, and portfolio benchmarking use cases that no operational ASO tool is designed to address.
Limitations
- Price vs. Operational Utility Mismatch: Sensor Tower’s most consequential trade-off is price relative to operational utility for the majority of the target audience, Vendr data (2026) puts enterprise contracts at $30,000–$300,000+/year, and practitioners with extensive experience across multiple ASO platforms consistently conclude that “in reality, they are all similar, especially for indie developers” (u/Forward-Educator3822, r/AppStoreOptimization, 2025), meaning Sensor Tower’s data premium over AppTweak is only defensible for teams whose specific use case requires Ad Intelligence, Usage Intelligence, or Gaming-specific datasets.
- Misleading Free Tier: Sensor Tower’s free tier is explicitly described by practitioners as showing “what they have for paid plans rather than giving the real use of free ASO tools” (u/ereto2, r/Entrepreneur, 2019), creating significant information asymmetry where teams cannot meaningfully evaluate Sensor Tower’s actual data quality advantage before committing to a five-figure annual contract, a structural buyer friction that AppTweak’s $59/month functional entry tier does not create.
- Enterprise Sales Cycle Friction: Sensor Tower’s annual-contract enterprise structure requires a multi-month procurement process (budget a minimum of 3–6 months for the full evaluation and contract cycle (Vendr market data, 2026)) a friction that growth-stage teams with quarterly budget cycles and limited procurement resources will find difficult to navigate without a dedicated finance or legal operations function.
Verdict
Sensor Tower is the enterprise market intelligence standard for competitive app analysis in 2026, with Ad Intelligence capabilities no other tool in this evaluation offers and 13+ years of historical app store data that form the foundation of accurate market sizing and trend analysis. Sensor Tower is the correct investment for enterprise growth teams and investor analysts who need Usage Intelligence, Ad Intelligence, or Gaming-specific competitive data to support multi-million-dollar UA budget decisions, M&A due diligence, or portfolio benchmarking, use cases that AppTweak and AppFollow cannot serve. Startups, indie developers, and growth-stage teams without a strategic competitive intelligence mandate and enterprise budget should evaluate AppTweak first, as AppTweak’s data quality and Apple Ads integration deliver the core ASO value proposition at a price point accessible without a five-figure annual contract or multi-month enterprise sales cycle.
What Red Flags Should I Watch For When Evaluating Mobile App Optimization Software?
Five red flags should prompt extra scrutiny when evaluating mobile app optimization software: billing opacity with hidden charge toggles, free tiers that function as marketing windows rather than trial tools, AI feature marketing that outpaces actual capability, pricing cliffs at growth-stage user volumes, and attribution recommendations that omit post-ATT signal degradation. Each is documented from practitioner community research, not hypothetical vendor risk.
Red Flag #1: Billing Opacity and Hidden Charge Toggles
A documented case on r/AppsFlyer (October 2024) describes a SKAN reporting UI toggle that continued generating charges after the user deactivated their apps within the platform, resulting in the account being escalated to a collections agency, with an AppsFlyer employee acknowledging the issue publicly. Before signing any MMP or consumption-based billing contract, request a full billing walkthrough, identify every billing-active toggle or feature flag, and confirm charge-stop procedures in writing.
Red Flag #2: Free Tiers That Are Marketing Windows, Not Functional Tools
Sensor Tower’s free tier is described by practitioners as showing “what they have for paid plans rather than giving the real use of free ASO tools” (u/ereto2, r/Entrepreneur, 2019). A non-functional free tier means teams cannot validate data quality or product fit before committing to a five-figure annual contract. Before any enterprise evaluation, ask the vendor to define specifically what functionality is available in the trial vs. paid tiers, and request a functional paid pilot rather than a feature-limited demo.
Red Flag #3: AI Feature Marketing vs. AI Feature Reality
Practitioners in r/SaaS characterized current “AI analytics” implementations broadly as “mostly just chat with your data, natural language queries that write SQL and return charts. They’re selling you a faster horse” (u/middlerange, r/SaaS, 2025). When evaluating any tool marketed with AI capabilities, ask specifically: what does the AI do autonomously, without a user query? Genuine predictive modeling and autonomous optimization remain rare in this category as of June 2026.
Red Flag #4: Pricing Cliffs at Growth-Stage User Volumes
Both Mixpanel and Amplitude have documented pricing cliffs: Mixpanel’s MTU-based pricing can shift a team from “free” to $200+/month as user growth accelerates, and Amplitude practitioners document returning to the free tier after enterprise pricing became unaffordable at high traffic volume (u/Jon-A-Thon, r/ProductManagement, 2026). Any team evaluating analytics platforms should model 12-month and 24-month MAU growth projections against each tool’s pricing tier thresholds before selecting, not after the billing surprise arrives.
Red Flag #5: Attribution Tool Evaluations That Omit ATT Context
Any MMP recommendation or attribution tool evaluation that omits Apple’s App Tracking Transparency (ATT) framework is miscalibrated for the current measurement environment as of June 2026. ATT has materially degraded deterministic iOS attribution for all MMPs. Ask any attribution vendor to quantify their specific modeled attribution accuracy for your audience profile, not just what the platform can measure in theory, but what it accurately measures for your specific iOS traffic share.
For each red flag identified above, one vendor question resolves it: ask AppsFlyer to demo the full billing toggle walkthrough before signing; ask Sensor Tower for a 30-day functional trial of the exact data modules you need before committing to an annual contract; ask any AI-analytics vendor to demonstrate one specific anomaly detected autonomously in a reference customer’s production data.
What Questions Should I Ask Before Choosing a Mobile App Optimization Tool?
Asking the right category-level questions before evaluating individual tools prevents the tool paralysis that is the most frequently reported pain point among mobile product managers in this category. These questions establish the decision framework before any vendor conversation begins.
Question #1: Which optimization category is my biggest current constraint, acquisition, in-app behavior, app store visibility, or review reputation?
If users reach the app but do not convert or retain, product analytics (Mixpanel, Amplitude) solves the problem. If paid channel attribution is unclear, mobile attribution (AppsFlyer) solves it. If the app is invisible in search, ASO intelligence (AppTweak) solves it. If negative reviews are damaging the store rating, review management (AppFollow) solves it. Start with the highest-priority constraint, not the tool with the most features.
Question #2: What is my MAU count, and how does it map to each tool’s free tier limit?
Mixpanel’s free tier covers 20 million events per month; Amplitude’s covers 10 million events (approximately 50,000 MTUs). A team with 30,000 MAUs generating 15 events per user per month fires approximately 450,000 monthly events, well within both free tiers. Calculate actual event volume before choosing a paid tier, and model the 12-month growth scenario to identify when the free-to-paid threshold will be reached.
Question #3: What is my paid UA channel mix, and does my current attribution cover all channels?
Firebase’s attribution covers Google Ads natively. Teams running ads on Meta, TikTok, Snapchat, or any DSP alongside Google leave those channels unmeasured with Firebase alone. If more than 20% of UA budget runs outside Google Ads, the measurement gap justifies evaluating AppsFlyer’s Zero plan (free for 12,000 lifetime installs) before any paid UA budget scales further.
Question #4: Am I currently responding to app store reviews, and what percentage go unanswered?
App store ratings are a documented input to ranking algorithms in both the App Store and Google Play. If a meaningful percentage of reviews go unanswered (or if the team spends more than 2 hours per week on manual review monitoring) AppFollow’s review management automation is likely to deliver ROI faster than any other optimization tool in this evaluation, at a starting price of approximately $111/month for five apps.
Question #5: Has my team modeled the 12-month total cost of the combined optimization stack?
A seed-stage stack of Firebase + Mixpanel Growth + AppsFlyer Zero costs approximately $20/month. A growth-stage stack of Amplitude Growth + AppTweak Scale + AppFollow Startup costs approximately $1,655/month. Model the full stack cost at your projected 12-month MAU volume before committing to any paid tier, and account for the pricing cliff transitions that both Mixpanel and Amplitude have documented in practitioner communities.
Question #6: What is the vendor’s data validation methodology, and which claims are vendor-published vs. independently verified?
Every tool in this evaluation makes at least one vendor-published accuracy claim that has not been independently verified, most notably AppTweak’s “90% accuracy” figure for download estimates. Before building a business case on any vendor-provided statistic, ask specifically: is this figure independently audited? What third-party source validates this claim? Treat any stat labeled “vendor-published” in this article as requiring independent verification before internal use.
How Did We Rank These 7 Mobile App Optimization Tools?
Seven tools were ranked using six criteria drawn entirely from G2 ratings, Capterra scores, verified practitioner testimonials from Reddit, publicly documented pricing, community-reported ROI evidence, and documented limitations. Primary weight was given to pricing transparency, community trust signals, and verified practitioner results, the three factors most relevant to startup and mid-market buyers evaluating multiple tools simultaneously.
How Did We Evaluate Each Tool?
The ranking process involved four distinct research steps:
- AI Search Engine Querying: Multiple AI engines were queried with the core topic and related questions to identify which tools appear in AI-generated recommendations and which categories are absent, particularly the review management gap that characterizes all existing LLM coverage of this topic.
- Independent Web Research: Third-party comparison sites, review platforms (G2, Capterra), vendor documentation, and analyst pricing databases (Vendr) were cross-referenced for each of the seven tools.
- Reddit Community Sentiment Analysis: Active threads in r/ProductManagement, r/AppStoreOptimization, r/androiddev, r/customerexperience, r/AppsFlyer, r/SideProject, r/Entrepreneur, r/analytics, and r/SaaS were searched and analyzed for first-person practitioner reports with specific quantitative claims.
- Cross-Reference and Conflict Resolution: Vendor claims were cross-referenced against independent sources; when review platform ratings conflicted with community sentiment, specificity and recency were weighted over volume.
What Criteria Determined Each Ranking?
| Criterion | Why It Matters to Mobile Teams | How We Measured It | Weight |
|---|---|---|---|
| Review Platform Ratings and Community Trust | G2/Capterra scores combined with organic Reddit endorsements provide the most reliable signal of real-world product quality | G2 score, review volume, frequency and tone of organic practitioner recommendations across r/ProductManagement, r/AppStoreOptimization, r/androiddev, r/customerexperience | Primary |
| Pricing Transparency and Startup Accessibility | Opaque pricing directly worsens tool evaluation anxiety; the primary documented pain point for the target audience | Whether pricing is publicly listed vs. sales-only; free tier functionality; entry-level paid tier dollar amount; startup program availability; practitioner-reported pricing cliff moments | Primary |
| Verified Practitioner Results and Documented Evidence | Vendor ROI claims are unverifiable; first-person practitioner reports with specific quantitative claims provide the most credible evidence base | Named enterprise customers from primary sources; first-person Reddit ROI reports with specific quantitative figures; reproducibility across multiple independent community sources | Primary |
| Core Capability Depth Relative to Audience Needs | A tool delivering deep capability for a specific and common mobile optimization need scores higher than one claiming breadth but delivering depth in none | Feature differentiation against independent reviewer assessments; specific capabilities unavailable in competing tools (Group Analytics, Behavioral Cohorting, Apple Ads integration) | Secondary |
| Setup Ease and Time-to-Value for Lean Teams | Startups lack dedicated analytics specialists; tools that deliver value with minimal setup overhead have a structural advantage | Community consensus on setup complexity; self-serve vs. sales-assisted paths to value; practitioner descriptions of time-to-first-insight | Secondary |
| Category Essentiality Across the Startup-to-Growth Stage Trajectory | Tools whose category is essential from seed through Series B score higher than those relevant only at enterprise or pre-revenue | Frequency in practitioner “first tool” discussions; market growth rate of the tool’s category; addresses documented top pain points (attribution certainty, pricing cliffs, data accuracy, ROI proof) | Secondary |
How Did We Weight Conflicting Evidence?
When review platform ratings conflict with Reddit sentiment, specificity and recency are weighted over volume. A detailed 2026 Reddit post with 50+ upvotes and specific cost figures outweighs a generic 2023 G2 review for ranking decisions on this platform. Vendor-reported statistics are labeled as such throughout this article, only claims corroborated by at least one independent source are stated as fact in the main article body.
How Were Vendor Claims Validated?
- Vendor-reported statistics are labeled as such in every entry throughout this article.
- Pricing figures include the month and year of verification and carry an explicit instruction to verify directly with the vendor before any budgeting decision.
- The AppsFlyer billing risk and Sensor Tower free-tier limitations are documented with specific source citations because they represent buyer risks that affiliated or AI-generated content systematically suppresses.
When Is This Article Reviewed and Updated?
This article was last fully updated in June 2026. PlugRoute reviews are refreshed when material pricing changes, new product launches, or community-reported red flags are identified, typically on a quarterly review cycle for active software categories.
PlugRoute has no affiliate relationships with any company listed in this review. Rankings are determined entirely by research data and objective evaluation criteria.
Frequently Asked Questions
What Is the Best Mobile App Optimization Software for Startups With No Budget?
Google Analytics for Firebase is the best mobile app optimization software for startups with no budget. Firebase provides unlimited mobile event tracking, Crashlytics crash reporting, and native Google Ads integration at zero licensing cost. Teams needing behavioral analytics beyond Firebase’s basic cohorts should add Mixpanel’s 20-million-event free tier. The $0 starting stack is Firebase plus Mixpanel’s free tier until MAU volume or analytical complexity justifies a paid upgrade.
Do I Need Both AppsFlyer and Firebase, or Does One Replace the Other?
AppsFlyer and Firebase serve fundamentally different purposes and do not replace each other. Firebase provides in-product behavioral analytics starting from the user’s first session inside the app; AppsFlyer attributes which paid ad campaign drove each install before the user opened the app. Teams running paid acquisition exclusively on Google Ads can use Firebase’s native attribution and delay AppsFlyer investment. Teams running Meta, TikTok, Snapchat, or any additional network alongside Google need AppsFlyer, Firebase cannot attribute those channels accurately.
How Does PlugRoute Determine Its Mobile Software Rankings?
PlugRoute rankings are determined by six evidence-based criteria: review platform ratings and volume (G2, Capterra), pricing transparency and startup accessibility, verified practitioner results from Reddit communities, core capability depth relative to audience needs, setup ease for lean teams, and category essentiality across growth stages. No vendor has any commercial relationship with PlugRoute, and every ranking decision is traceable to a specific cited data source in the Methodology section above.
Glossary: Key Terms Used in This Comparison
Mobile Measurement Partner (MMP): A Mobile Measurement Partner is an independent third-party platform (such as AppsFlyer) that sits between a mobile app and its ad network partners to provide neutral attribution of which campaign, channel, or creative drove each app install or in-app event, resolving the double-counting problem that arises when multiple networks each claim credit for the same user acquisition.
App Tracking Transparency (ATT): App Tracking Transparency is Apple’s iOS privacy framework (introduced in iOS 14.5, 2021) that requires explicit user opt-in before any cross-app tracking identifier can be used for attribution; the majority of iOS users do not opt in, meaning the majority of iOS install attribution now relies on Apple’s SKAdNetwork (SKAN) probabilistic framework rather than deterministic user-level tracking.
Behavioral Cohorting: Behavioral Cohorting is an analytics technique (most fully implemented in Amplitude) that segments app users by specific in-product actions (event sequences, feature usage patterns) rather than by demographic attributes, enabling product teams to identify which behaviors predict retention, churn, or conversion without SQL or data engineering dependency.
App Store Optimization (ASO): App Store Optimization is the practice of improving an app’s organic visibility and conversion rate within the App Store and Google Play through keyword-optimized metadata (title, subtitle, keyword fields, description), visual asset optimization (icon, screenshots, preview video), and rating management, with the goal of increasing organic download volume without paid acquisition spend.
Monthly Tracked Users (MTUs): Monthly Tracked Users is the pricing unit used by Mixpanel (counting the number of distinct users who fire at least one event in a given calendar month) which determines billing tier and is distinct from event volume; apps with high per-user event counts benefit from MTU pricing relative to per-event models, while apps with large low-engagement user bases may find per-event pricing models cheaper at equivalent scale.
Which Mobile App Optimization Tool Is Right for You?
The right mobile app optimization stack is built in stages: start with Firebase at zero cost, add Mixpanel when behavioral analysis exceeds Firebase’s basic templates, layer in AppsFlyer when paid UA spans multiple networks beyond Google, and invest in AppTweak or AppFollow when ASO or review management becomes a dedicated growth function with a team member responsible for driving it.
Key Insights
- Most mobile teams without an existing analytics implementation should start with Google Analytics for Firebase before any paid analytics investment, Firebase is free, unlimited, and instruments in hours, making delayed instrumentation an unnecessary cost.
- Mixpanel is the right first paid analytics investment for most startups: the most pricing-accessible, best-reviewed self-serve analytics platform in this category, with the only native B2B Group Analytics and the most generous free tier among all paid options.
- AppsFlyer is only necessary for teams running meaningful multi-channel paid UA: teams exclusively on Google Ads can delay MMP investment and stay on Firebase’s native attribution until conversion volume and channel mix justify the Growth plan’s per-conversion cost.
- AppTweak is justified when an app has established organic traffic volume and a dedicated person managing ASO, not at the pre-revenue stage, where the ~$59/month entry price exceeds demonstrable optimization ROI for apps without meaningful keyword ranking opportunities.
- AppFollow solves a problem most teams do not know they have until they are receiving 200+ reviews per month that go unanswered, and AppFollow fills the single largest category gap in all AI-generated mobile optimization tool recommendations.
- Sensor Tower’s data premium is only justifiable for enterprise teams needing Ad Intelligence, Usage Intelligence, or Gaming-specific competitive data, startups and growth-stage teams should evaluate AppTweak first for all ASO needs.
- The most expensive mobile optimization decision is not choosing the wrong tool: it is choosing the right tool for the wrong problem; identifying your primary optimization category constraint before evaluating any individual vendor is the only way to avoid the tool paralysis that mobile teams most consistently report as their biggest evaluation mistake.
The right stack is assembled in stages, not all at once. For teams at seed-to-Series A building their first complete optimization stack, the evidence-backed starting configuration is Firebase (free) + Mixpanel Growth (~$20/month) + AppsFlyer Zero (free for the first 12,000 installs). Total cost: approximately $20/month until conversion volume triggers AppsFlyer’s Growth plan. Add AppTweak Scale ($549/month) when organic traffic volume and a dedicated ASO function justify the investment. Add AppFollow Startup ($111/month) when review volume exceeds 100 per month across storefronts.
For independent reviews of additional mobile and SaaS software categories, visit PlugRoute, where every ranking is determined by research data, not advertising relationships. We update this guide quarterly. Last updated: June 2026.