Sentry is the best overall mobile app debugging tool for cross-platform production observability, Firebase Crashlytics is the only genuinely unlimited free crash reporter for budget-constrained teams, and BrowserStack leads real-device testing for hardware-specific mobile bugs. No single tool covers the entire mobile debugging lifecycle, most teams need at least two complementary tools selected by use case.
Mobile debugging tooling is deeply fragmented across crash reporting, network inspection, remote logging, and real-device testing. Choosing the wrong combination leaves production failures completely invisible, and current AI assistant recommendations compound the problem: every major LLM tested for this research (Perplexity, ChatGPT) continues recommending Flipper for React Native debugging, a recommendation confirmed incorrect by Meta’s official GitHub repository, which designates v0.239.0 as the final React Native-compatible release.
PlugRoute has no affiliate relationships with any company listed. Rankings are determined entirely by research data and objective evaluation criteria.
“Literally last night I swapped from Crashlytics to Sentry and I couldn’t be amazed at how much easier it was to setup and use. Also tons of actual info is given during errors that really help debug user issues.” (u/FireflyDan, r/FlutterDev, February 2025)
Takeaway: This active migration story (not a theoretical preference, but a same-night tool switch in a production application) confirms that Sentry’s richer per-error context drives deliberate mid-production Crashlytics replacements, not only new-project decisions.
TL;DR: Top Picks at a Glance
- Sentry provides the widest verified cross-platform coverage (Android, iOS, React Native, Flutter, Linux) and richest production crash context in this evaluation, including AI-assisted root cause analysis via the Seer assistant.
- Firebase Crashlytics is the only genuinely unlimited and free crash reporter in this evaluation, the safest first crash reporting choice for any team where observability budget is zero or unpredictable.
- BrowserStack provides access to 3,500+ real physical device models across 21 global data centers and is the only tool in this evaluation capable of reproducing hardware-specific and OS-version-specific mobile bugs that emulators cannot surface.
- Charles Proxy provides local HTTPS traffic inspection via a one-time $50/license purchase with no cloud dependency, no subscription, and no data transmitted outside the developer’s network.
- Instabug (now Luciq.ai) transforms production users into debugging collaborators through shake-to-report bug filing that packages the last 60 seconds of session context (screenshots, network logs, and device state) automatically with every user report.
- Bugfender is the only tool in this evaluation designed to stream live device logs from production user devices, surfacing non-crash behavioral failures invisible to every crash reporter in this category.
What Are the Six Categories of Mobile App Debugging Tools?
Six distinct categories map the mobile debugging lifecycle, understanding which category addresses your current gap is the most important step before evaluating any specific tool.
The six categories are:
- Category 1: Production Observability Platforms: Sentry and Firebase Crashlytics capture crash events, stack traces, and performance data from production apps running on real user devices in real-time, without a debugger attached.
- Category 2: In-App Mobile Quality Platforms: Instabug (officially rebranded to Luciq.ai on September 24, 2025) combines crash reporting with user-initiated bug reporting, session replay, and in-app feedback, transforming production users into debugging collaborators.
- Category 3: Remote Device Loggers: Bugfender streams live device logs from production user devices to a cloud console, surfacing non-crash behavioral failures that are invisible to every crash reporter in this evaluation.
- Category 4: Real-Device Testing Clouds: BrowserStack provides cloud-based access to 3,500+ physical Android and iOS device models, the only tool in this evaluation capable of reproducing hardware-specific and device-model-specific bugs that emulators structurally cannot surface.
- Category 5: Network Traffic Inspectors: Charles Proxy routes mobile device traffic through a local desktop proxy to enable full decryption and manipulation of HTTPS API calls during development.
- Category 6: Development-Stage Debug Clients: Flipper is a free, open-source desktop application for native Android log viewing, layout inspection, and network debugging, officially deprecated for React Native as of version 0.73.
The most important architectural distinction in this evaluation is between production-capable tools (Sentry, Firebase Crashlytics, Instabug, Bugfender) and development-stage-only tools (Charles Proxy, Flipper).
To illustrate why this distinction matters: a silent login flow failure (where the API returns HTTP 200 but the user session is never created) is invisible to Charles Proxy (not deployed in production), invisible to Firebase Crashlytics (no exception fires), and invisible to BrowserStack (a QA tool only). Only Bugfender, via application log streaming, or Sentry with custom error instrumentation would surface this failure in production. Knowing which category of failure your users experience determines which tool layer you actually need.
A complete mobile debugging stack requires at minimum one production observability tool and one development-stage network inspection tool.
How Do the Top Mobile App Debugging Tools Compare at a Glance?
| Rank | Company | Category | Best For | One-Line Summary | Key Capabilities | Primary Strength | Key Limitation |
|---|---|---|---|---|---|---|---|
| 1 | Sentry | Production Observability Platform | Cross-platform crash reporting + AI debugging | Sentry is the most comprehensively evidenced mobile error tracking and performance observability platform in 2026, with AI-assisted debugging via Seer, self-hosting for data-residency compliance, and verified SDK support for Android, iOS, React Native, Flutter, and Linux. | Crash reporting, performance monitoring, session replay, AI root-cause (Seer), Code Owners routing, self-hosting option | Broadest verified cross-platform SDK coverage with active February 2026 product investment and self-hosted option eliminating event-quota risk | Event quota capped at 50,000 events/month on paid cloud tiers; exhaustion risk during production incidents |
| 2 | Firebase Crashlytics | Crash Reporter | Free, unlimited crash reporting | Firebase Crashlytics is the only fully free, volume-unlimited crash reporting tool in this evaluation, providing production crash visibility at zero cost with no risk of event-quota exhaustion during production incidents. | Crash reporting, ANR detection, NDK crash support, Google Analytics breadcrumbs, Android Studio App Quality Insights integration | Completely free with no event-volume caps on any Firebase plan; structural immunity to quota-exhaustion risk | Dashboard quality and symbolication reliability documented as insufficient for complex crash triage |
| 3 | BrowserStack | Real-Device Testing Cloud | Hardware-specific and OS-version-specific bugs | BrowserStack is the leading real-device mobile testing cloud with 3,500+ physical device models, 50,000+ enterprise customers, and 1 billion tests processed annually; the largest independently verified solution for hardware-dependent mobile bugs outside a physical device lab. | App Live manual sessions, App Automate CI/CD, 21 global data centers, geolocation testing, Appium/Cypress/Playwright support | Only tool in this evaluation providing access to real physical hardware for device-specific bug reproduction | VPN incompatibility blocks access in enterprise environments; base tier caps automated testing at 100 minutes/month |
| 4 | Instabug (Luciq.ai) | In-App Mobile Quality Platform | Consumer apps with user-reported bugs | Luciq.ai (formerly Instabug, officially rebranded September 24, 2025) is the leading mobile-first app quality platform combining crash reporting, shake-to-report bug filing, and 60-second session context capture in a single SDK for Android, iOS, and React Native. | Crash reporting, shake-to-report with 60-second session capture, session replay, built-in HTTP network inspector, in-app feedback and surveys | Shake-to-report delivers a pre-packaged 60-second diagnostic bundle with every user bug report; unavailable from any other tool in this evaluation | Pricing not publicly disclosed; legacy Instabug API on active deprecation timeline under Luciq.ai rebrand |
| 5 | Charles Proxy | Network Traffic Inspector | HTTPS traffic inspection during API development | Charles Proxy is the most battle-tested HTTP/HTTPS network debugging proxy for mobile development, with a local-only architecture, $50 one-time license, and no data transmitted to cloud servers. | SSL proxying (HTTPS decryption), Map Local response substitution, Map Remote endpoint redirection, network throttling, real-time breakpoints | Local-only traffic capture with no cloud dependency; all HTTPS inspection stays within the developer’s machine | Development-stage only; requires manual proxy configuration and CA certificate installation; dated Java-based UI |
| 6 | Bugfender | Remote Device Logger | Diagnosing non-crash production failures | Bugfender is the specialized remote device logging platform deployed on 46+ million devices across 9,000+ apps (as of 2018), enabling developers to stream logs from any production user device without physical access or a crash event as a prerequisite. | Real-time remote log streaming, UI event logging, logcat integration, React Native plugin | Only tool in this evaluation capable of surfacing non-crash behavioral production failures invisible to all crash reporters | Free tier retains logs for 24 hours only; insufficient for production debugging without paid plan commitment |
| 7 | Flipper | Open-Source Mobile Debug Client | Native Android only; DEPRECATED for React Native 0.73+ | Flipper is Meta’s free MIT-licensed open-source debug client that remains valid for native Android debugging but is officially deprecated for React Native as of version 0.73, and should not be selected for any new React Native project in 2026. | Log viewing, network inspector plugin, layout inspection, extensible plugin API, MIT license | MIT-licensed and completely free; Meta’s internal Litho team uses Flipper as their standard native Android debugging tool | Officially deprecated for React Native as of version 0.73; v0.239.0 is the final compatible release per Meta’s official GitHub repository |
Which Mobile App Debugging Tool Should I Choose for My Use Case?
| Developer Context | Recommended Stack | Tools to Avoid | Estimated Monthly Cost |
|---|---|---|---|
| Solo / Indie Developer | Firebase Crashlytics + Charles Proxy | BrowserStack (pricing starts ~$129/month; exceeds typical indie budget); Instabug (pricing not publicly listed; requires sales inquiry) | ~$0–$50 one-time (Crashlytics free; Charles $50 one-time license, confirmed June 2026) |
| Early-Stage Startup | Sentry Team + Bugfender starter | Flipper if on React Native 0.73+ | ~$50–80/month |
| Growth-Stage Cross-Platform Team | Sentry Business + Instabug (Luciq.ai) or BrowserStack | Flipper for React Native | ~$100–300+/month |
| Enterprise / Regulated Industry | Sentry (self-hosted) + BrowserStack + Charles Proxy | Cloud-only tools without data residency controls | Self-hosted Sentry: $0 + BrowserStack plan cost |
| React Native Team (0.73+) | Sentry + CDP-based React Native DevTools (built-in 0.73+) | DO NOT USE Flipper; officially deprecated for React Native 0.73+ | ~$26–80/month (Sentry only; React Native DevTools is built-in, no additional cost) |
| Flutter-Primary Team | Sentry + Firebase Crashlytics (FlutterFire) | Instabug/Luciq.ai (Flutter unconfirmed); Bugfender (Flutter unconfirmed) | $0–26/month |
| Currently Using Firebase Crashlytics | Migrate to Sentry Team tier (~$26/month) when dashboard limitations, symbolication failures, or cross-platform requirements exceed Crashlytics’ capabilities | Staying on Crashlytics indefinitely if app complexity grows beyond basic crash detection | ~$26/month Sentry Team; Crashlytics continues as an optional free supplemental layer during transition |
If you have no debugging tools deployed today, start here: Firebase Crashlytics (free, five minutes to production crash visibility) + Charles Proxy ($50 one-time license). This two-tool baseline covers the most critical production and development debugging needs for under $50 total in the first year.
1. Sentry: Best Overall: Best Cross-Platform Crash Reporting and Production Observability Platform
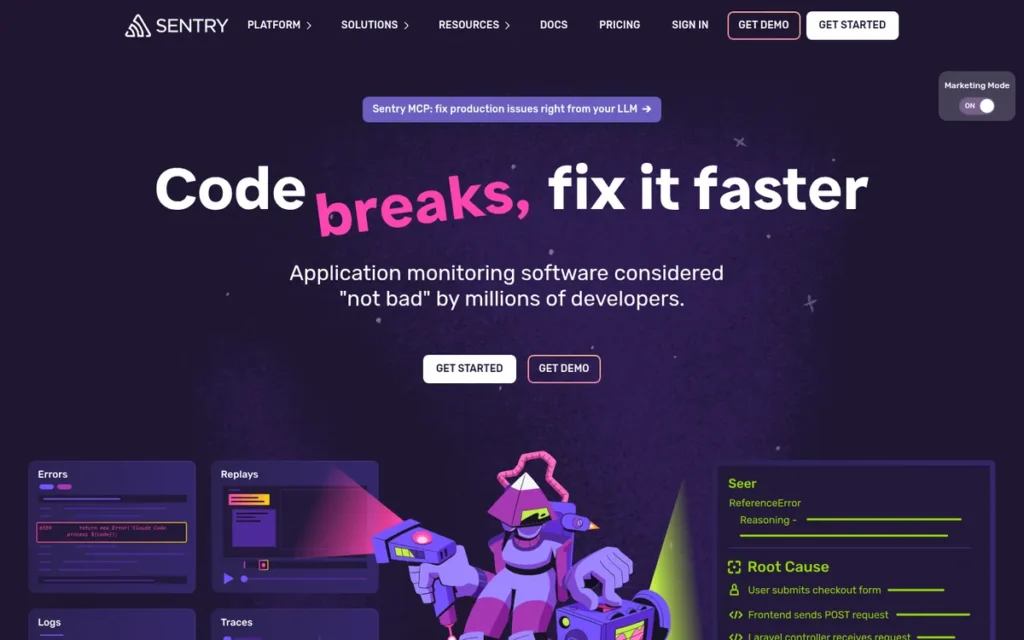
Category: Production Observability Platform, captures crashes, errors, and performance issues from production mobile apps with contextual debugging data, AI-assisted root cause analysis via Seer, and an optional self-hosted deployment that eliminates event-quota pricing risk entirely.
At a Glance
- Category: Crash Reporter + Performance Observability Platform
- Best For: Cross-platform mobile teams (Android, iOS, React Native, Flutter) needing production crash reporting with rich diagnostic context, performance monitoring, and optional self-hosted deployment for regulated industries
- Price Range: Free (event-capped Developer tier) / ~$26/month Team / ~$80/month Business (both paid tiers include 50,000 events/month base quota, confirmed at sentry.io/pricing, June 2026) / Self-hosted free (open source)
- Primary Strength: Sentry delivers richer crash context than any alternative in this evaluation (stack traces, breadcrumbs, screenshots, session replay, and AI-assisted root cause via Seer) in a single SDK covering Android, iOS, React Native, Flutter, and Linux
- Biggest Limitation: Sentry’s cloud-hosted tiers cap event capture at 50,000 events per month; a production incident generating thousands of errors per minute can exhaust this allocation within hours, cutting off diagnostic visibility precisely when it is most needed
- One-Line Summary: Sentry is the most comprehensively evidenced mobile error tracking and performance observability platform in 2026, offering AI-assisted debugging via Seer, self-hosting for data-residency compliance, and verified cross-platform SDK support across Android, iOS, React Native, Flutter, and Linux.
- Last Verified: June 2026
Overview
Sentry is the best overall mobile debugging platform for cross-platform teams, ranked #1 because it delivers the broadest verified SDK coverage, the richest per-crash diagnostic context, and the most active mobile-specific product investment of any tool in this evaluation, validated by two February 2026 product launches. Sentry’s self-hosting option uniquely eliminates the event-quota pricing risk that affects the cloud-hosted tiers.
Sentry is an open-source application performance monitoring and error tracking platform that combines crash reporting, performance monitoring, distributed tracing, mobile session replay, an AI debugging assistant (Seer), Code Owners routing, and a self-hosted deployment path in a single platform, making Sentry the most functionally complete production observability tool in this evaluation for teams managing multiple mobile codebases.
Key Features
- Contextual Crash Data: Sentry captures stack traces, breadcrumbs, device metadata, and screenshots simultaneously for every crash event, providing the diagnostic depth developers need to reproduce production bugs on specific device-and-OS combinations without physical device access.
- Seer AI Debugging Assistant: Sentry’s Seer AI assistant analyzes incoming errors and surfaces probable root causes and suggested fixes, reducing the time between alert and resolution for recurring production error patterns across Android, iOS, React Native, and Flutter applications.
- Mobile App Size Analysis: Sentry introduced Mobile App Size Analysis in February 2026 (BusinessWire, February 10, 2026), enabling developers to identify and reduce binary bloat before it impacts App Store install conversion rates, with confirmed coverage for React Native and Flutter cross-platform targets (Sentry blog, 2026).
- Code Owners Routing: Sentry’s Code Owners integration automatically routes new issues to the responsible engineering team based on file ownership rules, reducing manual triage burden in multi-team organizations where crash ownership is otherwise ambiguous.
- Self-Hosted Deployment: Sentry offers a fully self-hosted deployment path via its MIT-licensed open-source repository, allowing teams with GDPR, data residency, or enterprise security requirements to run Sentry with no data leaving their own infrastructure and no event-quota constraints, removing the primary pricing risk of the cloud-hosted tiers.
Best For
Sentry is best for engineering teams at growth-stage startups and product companies that need production crash monitoring and performance observability across multiple mobile platforms, particularly React Native or Flutter teams managing several codebases, teams in regulated industries requiring self-hosted infrastructure, and developers whose previous Firebase Crashlytics deployments have been limited by dashboard quality or cross-platform coverage requirements.
Pricing
Sentry’s Developer tier is free with event-volume caps that can be exhausted during production incidents. The Team tier is approximately $26/month and the Business tier approximately $80/month per organization, both paid tiers include a base quota of 50,000 events per month, with additional events billed pay-as-you-go above the base (confirmed at sentry.io/pricing, June 2026). Self-hosted deployment via the open-source Sentry repository is free at any event volume, removing quota constraints entirely for teams with DevOps resources. Verify current tier limits before relying on free-tier event volumes for high-traffic production apps.
Strengths
- Sentry launched Mobile App Size Analysis (BusinessWire, February 10, 2026) and the Seer AI debugging assistant within a 12-month window, demonstrating active mobile-specific product investment unmatched by any other tool in this evaluation with independently verifiable, dated evidence.
- Sentry received the top-voted community endorsement in a February 2025 r/FlutterDev thread, 25 upvotes, u/benjaminabel: “I vote for Sentry. Much easier to integrate and it doesn’t include a lot of native libs like Crashlytics does” (r/FlutterDev, February 2025), confirming consistent developer preference for Sentry’s SDK footprint.
- Sentry supports Linux in addition to Android, iOS, React Native, and Flutter: cross-platform breadth that Firebase Crashlytics cannot match for multi-target development teams, confirmed in developer community comparisons (r/FlutterDev, u/scognito, 2025).
- Sentry’s open-source, self-hostable architecture eliminates event-quota pricing risk and satisfies GDPR and enterprise data residency requirements, a structural privacy and cost-control advantage over all cloud-only tools in this evaluation.
Limitations
- Event-Quota Exhaustion Risk: Sentry’s most consequential trade-off is its cloud-hosted event-quota pricing model, both the Team (~$26/month) and Business (~$80/month) tiers include a base quota of 50,000 events per month (confirmed at sentry.io/pricing, June 2026), and a production incident generating thousands of errors per minute can exhaust this allocation within hours, cutting off diagnostic visibility precisely when it is most needed.
“You have an error you didn’t see, you get a bit of traffic, it eats up all your quota and then you either pay more or you don’t see anything until the next month.” (u/rykh72, r/FlutterDev, February 2025)
Takeaway: The event-quota risk is not a theoretical edge case, it occurs precisely during high-traffic incidents when real-time visibility is most critical. Teams expecting incident-driven error spikes should configure sampling rates proactively or evaluate the self-hosted deployment option.
- Configuration Overhead for Smaller Teams: Sentry’s breadth of features: distributed tracing, session replay, Code Owners routing, performance monitoring, and the Seer AI assistant, represents meaningful setup investment for solo developers or single-platform apps where Firebase Crashlytics provides comparable crash visibility at zero configuration cost.
- Self-Hosting Infrastructure Cost: Sentry’s self-hosted option eliminates event-quota risk but introduces infrastructure maintenance overhead, teams must operate and maintain their own Sentry instance, adding DevOps cost and complexity that cloud-only teams may not have capacity to absorb.
Verdict
Sentry is the highest-ranked mobile debugging and observability platform in this evaluation because it delivers the broadest verified cross-platform coverage, the richest per-crash diagnostic context, and the most active mobile-specific product investment of any tool assessed, validated by dated evidence from February 2026 product launches and consistent first-place preference in developer community voting across r/FlutterDev, r/androiddev, and r/reactnative. Sentry’s self-hosting option uniquely eliminates the event-quota pricing risk inherent in the cloud-hosted tiers, and the 50,000-event monthly base quota is a specific, evaluable threshold that teams can compare against their production traffic volumes before committing to cloud plans. Teams that need a single SDK covering Android, iOS, React Native, Flutter, and production-to-development observability will find Sentry the most comprehensively evidenced choice in this evaluation for 2026.
2. Firebase Crashlytics: Best Free Option: Best for Budget-Constrained Teams and Google Ecosystem Apps
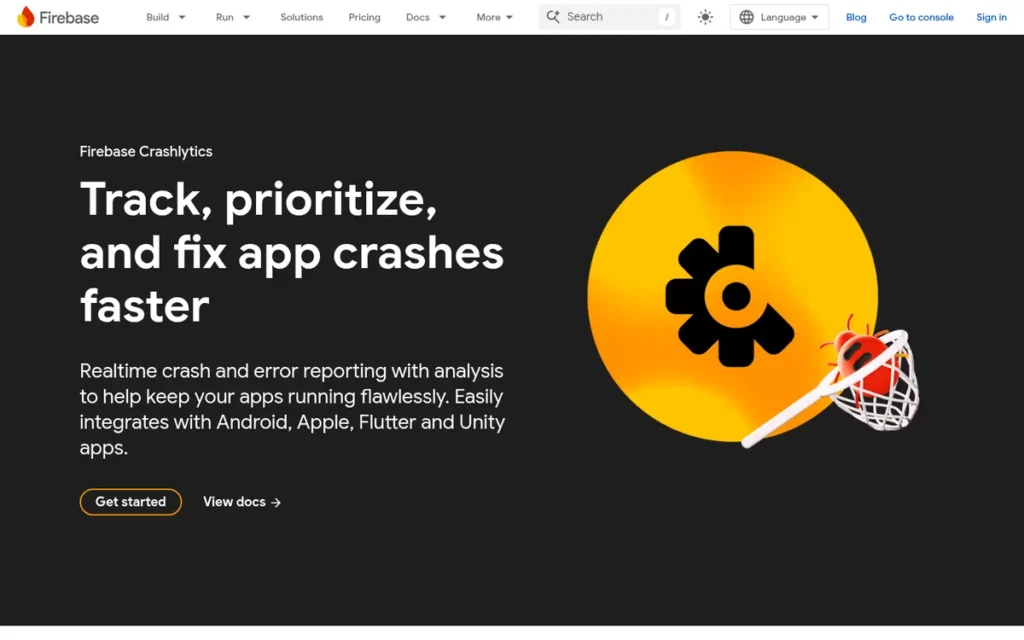
Category: Crash Reporter, captures crash events, stack traces, and ANR conditions from production mobile apps and groups them into actionable issues in a web dashboard; completely free on all Firebase plans with no volume limits.
At a Glance
- Category: Crash Reporter
- Best For: Indie developers, early-stage startups, and Google ecosystem teams needing production crash reporting with zero cost, zero event limits, and direct Android Studio integration
- Price Range: Free: unlimited crashes on both Firebase Spark (free) and Blaze (pay-as-you-go) plans; no per-event or per-device charges (verified at firebase.google.com/pricing, June 2026)
- Primary Strength: Firebase Crashlytics is the only crash reporting tool in this evaluation that is completely free with no event-volume caps, ensuring production crash visibility is never cut off by quota exhaustion regardless of app traffic volume
- Biggest Limitation: Firebase Crashlytics’ dashboard has documented symbolication reliability issues and is widely described by developers as difficult to navigate, filter, and prioritize, reducing the operational utility of crash data the tool successfully captures
- One-Line Summary: Firebase Crashlytics is the only fully free, volume-unlimited crash reporting tool in this evaluation, providing production crash visibility for Android and iOS apps at zero cost with no risk of event-quota exhaustion during production incidents.
- Last Verified: June 2026
Overview
Firebase Crashlytics is the best zero-cost crash reporting starting point for any team where budget is constrained, the only tool in this evaluation completely free with no event-volume caps on any Firebase plan, eliminating the quota exhaustion risk that affects Sentry’s cloud-hosted tiers. Firebase Crashlytics should be every new mobile app’s first production crash reporter.
Firebase Crashlytics is Google’s free crash reporting SDK for Android, iOS, Flutter, and React Native, providing real-time crash reports, ANR detection, NDK crash support, Google Analytics breadcrumbs, and direct Android Studio App Quality Insights integration. Firebase Crashlytics’ technical lineage traces from Crashlytics Inc. (pre-2013) through Twitter’s Fabric acquisition (2013) to the current Google Firebase integration (2017), over a decade of battle-tested crash capture across millions of production apps.
Key Features
- Unlimited Free Crash Reporting: Firebase Crashlytics is listed as a zero-cost Firebase product on both the Spark and Blaze plans (verified at firebase.google.com/pricing, June 2026), with no per-event charges, no per-device charges, and no volume limits, structurally eliminating the event-quota exhaustion risk that affects Sentry’s cloud-hosted tiers.
- Superiority Over Google Play Console: Firebase Crashlytics substantially outperforms Google Play Console’s native crash reporting, one developer documented Play Console showing 766 crashes with only 50 readable stack traces for the same events (r/androiddev, u/Shtrever, 2020). The architectural reasons for this gap, SDK-level instrumentation vs. OS-level crash capture, have not changed since that comparison.
- Android Studio IDE Integration: Firebase Crashlytics integrates directly with Android Studio’s App Quality Insights panel (developer.android.com/studio/debug/app-quality-insights), allowing developers to navigate from a crash report to the exact responsible code line without leaving their IDE.
- ANR and NDK Support: Firebase Crashlytics detects Android Not Responding (ANR) events and supports NDK crash reporting for apps using native C/C++ code, extending crash coverage to non-JVM failures that pure Java/Kotlin crash reporters miss.
- Google Analytics Breadcrumbs: Firebase Crashlytics captures breadcrumbs via Google Analytics event data, reconstructing the sequence of user actions before a crash to provide behavioral context beyond the raw stack trace, without requiring additional SDK configuration.
Best For
Firebase Crashlytics is best for indie developers, early-stage startups, and small teams already in the Firebase ecosystem who need production crash reporting at zero ongoing cost, particularly teams for whom the alternative to Crashlytics is no crash monitoring at all, or teams whose traffic volume is unpredictable enough that event-quota-based pricing would create financial exposure.
Pricing
Firebase Crashlytics is free on both the Firebase Spark (no-cost) plan and the Firebase Blaze (pay-as-you-go) plan, no per-event charges, no per-device charges, no volume limits for crash reporting specifically (verified at firebase.google.com/pricing, June 2026). Teams using the Blaze plan for other Firebase services incur usage charges for those services but not for Crashlytics. There is no paid upgrade path within Crashlytics, teams that outgrow its capabilities typically migrate to Sentry rather than upgrading within the Firebase ecosystem.
Strengths
- Firebase Crashlytics is completely free on all Firebase plans with no crash-volume limits (verified at firebase.google.com/pricing, June 2026) (the only such tool in this evaluation) ensuring production incident visibility is never interrupted by quota exhaustion regardless of error spike volume.
- Firebase Crashlytics substantially outperforms Google Play Console’s native crash reporting: one developer documented Play Console showing 766 crashes with only 50 readable stack traces for identical events (r/androiddev, u/Shtrever, 2020), confirming Crashlytics provides materially superior crash capture for the same event set.
- Firebase Crashlytics benefits from a technical lineage spanning Crashlytics Inc. (pre-2013), Twitter Fabric (2013), and Google Firebase (2017), over a decade of continuous development that predates the Firebase platform itself, providing a battle-tested crash capture foundation.
- Firebase Crashlytics integrates directly into Android Studio’s App Quality Insights panel (developer.android.com/studio/debug/app-quality-insights), enabling IDE-native crash navigation without context switching for Android-primary development teams.
Limitations
- Dashboard Quality and Symbolication Failures: Firebase Crashlytics’ most consequential trade-off is the persistent gap between its crash detection capability and its dashboard quality, the tool captures crash events reliably but provides limited tooling to navigate, filter, and prioritize that data.
Developers in a January 2025 r/swift community thread described “atrocious dashboarding” (u/ryan-not-bryan), “plenty of issues with symbolicating crashes” (u/thecodingart), and “zero people whose promotions depend on this product.”
Takeaway: The “zero people whose promotions depend on this product” observation reflects community consensus that Google has not prioritized Crashlytics as an investment target, teams encountering symbolication failures should treat migration to Sentry as the natural next step rather than a sign of Crashlytics failure.
- SDK Dependency Bloat: Firebase Crashlytics pulls in the entire Firebase dependency tree, adding significant build weight that developers optimizing for lean app binary sizes cite as a technical objection, “It’s easy to add and works great, but the dependency graph is insane. I think it’s too large for my taste” (u/konrad1977, r/swift, January 2025).
- No Advanced Observability Features: Firebase Crashlytics provides no AI-assisted root cause analysis, no session replay, no performance monitoring beyond crash data, and no Code Owners routing, capabilities teams consistently outgrow as app complexity increases, typically driving migration to Sentry.
Verdict
Firebase Crashlytics earns its #2 ranking as the best zero-cost crash reporting option in this evaluation, occupying a structurally distinct niche from Sentry by being genuinely unlimited and free rather than event-quota-capped on cloud tiers. Firebase Crashlytics is the correct first choice for any team where budget constraints are real, where Google ecosystem integration is already in place, or where the alternative to deploying Crashlytics is no production crash visibility at all. Teams that encounter its well-documented dashboard and symbolication limitations should treat migration to Sentry as a natural product maturation step, Crashlytics has served its purpose by delivering free production crash data during the critical early phase when observability budget is often zero.
3. BrowserStack: Best for Real-Device Testing: Best for Reproducing Hardware-Specific and OS-Version-Specific Mobile Bugs
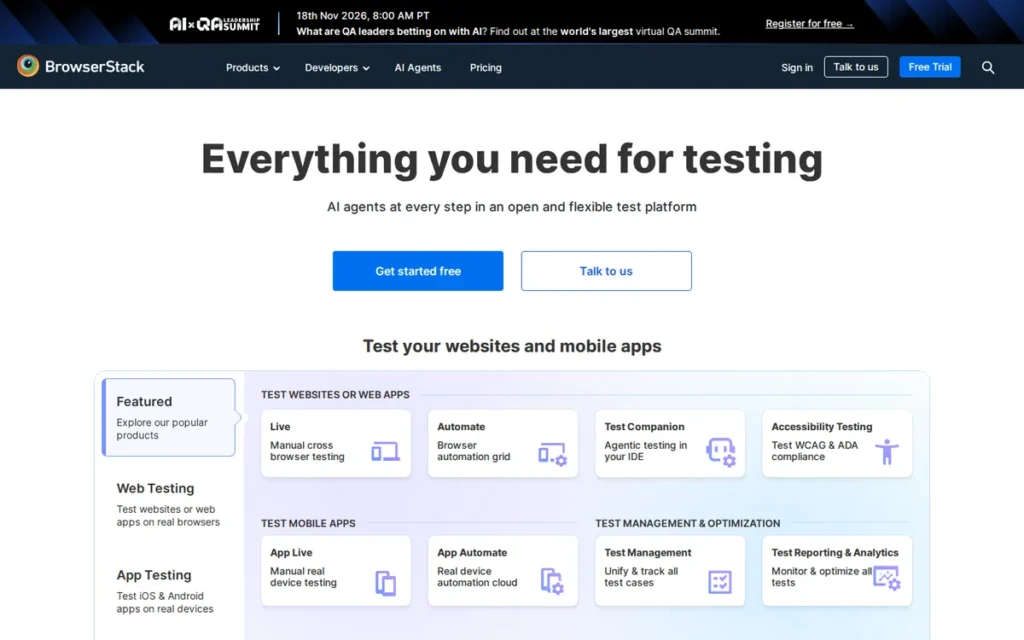
Category: Real-Device Testing Cloud, provides cloud-based access to physical Android and iOS devices for manual debugging, automated regression testing, and geolocation validation without maintaining a physical device lab.
At a Glance
- Category: Real-Device Testing Cloud
- Best For: QA engineers and engineering managers who need to reproduce hardware-specific, device-model-specific, or OS-version-specific bugs on real physical Android and iOS devices, or who need CI/CD regression pipelines requiring real-device automated testing
- Price Range: ~$129–$249/month for combined web and mobile plans (referenced in comparison sources, June 2026); base tier caps automated testing at 100 minutes/month, verify current mobile-specific pricing at browserstack.com/pricing
- Primary Strength: BrowserStack provides access to 3,500+ real physical device models across 21 global data centers, making it the only tool in this evaluation that can reproduce hardware-specific, device-model-specific, and OS-version-specific bugs that emulator-based alternatives cannot surface
- Biggest Limitation: BrowserStack’s documented VPN incompatibility blocks access in enterprise environments with mandatory corporate VPN (a structural blocker that cannot be resolved through configuration changes) and the base tier caps automated testing at 100 minutes per month, insufficient for active QA sprint cadences
- One-Line Summary: BrowserStack is the leading real-device mobile testing cloud with 3,500+ physical device models, 50,000+ enterprise customers, and 1 billion tests processed annually, the largest independently verified solution in this evaluation for reproducing hardware-dependent mobile bugs outside a physical device lab.
- Last Verified: June 2026
Overview
BrowserStack is the only tool in this evaluation providing access to real physical hardware for testing, the appropriate choice for teams with documented hardware-specific or OS-version-specific bugs that emulator-based alternatives cannot reproduce. BrowserStack ranked #3 for the most validated infrastructure scale in this evaluation: 3,500+ physical device models, 21 global data centers, and 1 billion tests processed annually.
BrowserStack is a cloud-based real-device testing platform, founded in 2011 in Mumbai, India by Ritesh Arora and Nakul Aggarwal, offering App Live for manual interactive device sessions and App Automate for CI/CD-integrated automated testing on real physical hardware. BrowserStack’s 21 global data centers enable geolocation-specific testing, and its device inventory covers obscure regional and legacy device-OS combinations that teams cannot cost-effectively maintain in physical form.
Key Features
- App Live Manual Device Sessions: BrowserStack App Live provides interactive, real-time access to physical Android and iOS devices for manual debugging and exploratory testing, with session artifacts including screenshots, videos, network logs, and console errors automatically captured without additional configuration.
- App Automate for CI/CD: BrowserStack App Automate supports Appium, Selenium, Cypress, and Playwright automation frameworks with CI/CD pipeline integration, enabling automated regression testing on real physical devices without purchasing or maintaining a physical device lab.
- 21 Global Data Centers for Geolocation Testing: BrowserStack’s 21 global data centers enable geolocation-specific testing (verifying app behavior with location-specific content, currency formats, and regional regulatory requirements) that emulator-based tools cannot replicate at the physical hardware level.
- 3,500+ Physical Device Models: BrowserStack’s device inventory covers 3,500+ distinct physical device models, a 2026 press release (PR Newswire, 2026) cites 30,000+ real devices and browsers, reflecting unique device, OS, and browser configuration combinations across the fleet; this article uses the physical device model count as the more conservative and directly comparable measure of hardware diversity.
- Enterprise-Scale Infrastructure: BrowserStack has served 50,000+ customers across 135+ countries and processes 1 billion tests per year (BrowserStack company page, 2026), providing infrastructure scale and reliability validated at levels that smaller real-device testing alternatives have not documented.
Best For
BrowserStack is best for QA engineers, mobile development teams, and engineering managers at product companies whose apps regularly surface device-specific behavior differences, OS-version-specific failures, or geolocation-dependent content requirements, and for teams operating CI/CD pipelines requiring automated regression testing on real physical hardware rather than emulators.
Pricing
BrowserStack web and mobile combined plans were referenced in comparison sources at approximately $129/month, $199/month, and $249/month as of mid-2026, App Live and App Automate mobile-specific pricing should be confirmed at browserstack.com/pricing, as plan structures change regularly. A base tier documented in a March 2023 r/softwaretesting thread caps automated testing at 100 minutes per month (u/DiotimaTuzzi), verify current allocations before committing. Teams evaluating cost should also compare Sauce Labs and LambdaTest, cited by community members in a May 2026 r/softwaretesting thread as offering comparable device inventories at lower price points.
Strengths
- BrowserStack processes 1 billion tests per year across 21 global data centers, serving 50,000+ customers (BrowserStack company page, 2026), an infrastructure scale no other tool in this evaluation approaches, validating enterprise-grade reliability for high-frequency automated mobile testing.
- BrowserStack is consistently identified in independent comparisons as the most comprehensive solution for real-device geolocation testing and visual regression testing (ghostinspector.com, 2026), areas where emulators cannot replicate physical hardware behavior regardless of software sophistication.
This reliability advantage is confirmed by practitioners through direct head-to-head platform comparison. Users on r/QualityAssurance shared their experience in January 2025:
“From our own experience with both, BrowserStack is clearly faster and more reliable. With Sauce Labs, we were just seeing a lot of random failures.” Posted by u/OneIndication7989
Takeaway: BrowserStack’s reliability advantage over Sauce Labs is validated by practitioners through direct head-to-head deployment experience, not just independent benchmark comparisons.
- BrowserStack supports Selenium, Appium, Cypress, and Playwright automation frameworks with CI/CD integration, enabling teams to incorporate real-device testing into existing pipelines without requiring framework migration or new tooling expertise.
- BrowserStack was founded in 2011 and has reached 6 million developer signups globally (per industry comparison data at sourceforge.net, 2026, not independently confirmed from BrowserStack’s primary company page), providing over 14 years of infrastructure investment and platform maturity.
Limitations
- VPN Incompatibility: Enterprise Blocker: BrowserStack’s most consequential trade-off is its documented VPN incompatibility, enterprise environments commonly enforce full-tunnel or split-tunnel VPN policies for all outbound traffic, and BrowserStack’s cloud platform requires direct internet access that cannot be resolved through configuration changes. This creates a structural blocker requiring IT security exception requests: “BrowserStack is slow and cumbersome. Also expensive and not worth it unless you have the money to spare… it doesn’t work with VPN which was a big deal in my previous company” (u/volen, r/softwaretesting, March 2023).
- Base-Tier Minute Cap: BrowserStack’s documented base tier caps automated testing at 100 minutes per month (u/DiotimaTuzzi, r/softwaretesting, March 2023), insufficient for teams running active regression suites where a single QA sprint can exhaust the monthly allocation well before the billing cycle ends.
- Eroding Device-Count Advantage and QA-Only Scope: BrowserStack’s historical device-count advantage has been reduced as Sauce Labs and LambdaTest have expanded their device inventories, a May 2026 r/softwaretesting thread explicitly noted that “scalability and execution speed usually matter more long-term than just having the largest device list.” Additionally, BrowserStack provides no production monitoring, crash reporting, or remote logging and must be paired with production observability tools in any complete mobile debugging stack.
Verdict
BrowserStack earns its #3 ranking as the highest-validated real-device testing platform in this evaluation, delivering the only documented enterprise-scale solution for the specific problem of reproducing hardware-dependent, device-and-OS-version-specific mobile bugs on physical hardware. BrowserStack occupies a structurally non-overlapping niche, it does not replace crash reporters or network debuggers, but it addresses the category of bugs no emulator-based tool can surface. Teams whose apps generate documented device-specific failures, operate CI/CD pipelines requiring real-device regression testing, or need geolocation testing capability will find BrowserStack’s premium cost justified; teams that have not documented device-specific failure patterns should evaluate whether emulator coverage is sufficient before committing to BrowserStack’s pricing.
4. Instabug (Luciq.ai): Best for In-App User Bug Reporting: Best for Consumer Apps Where Users Are the Primary Debugging Channel
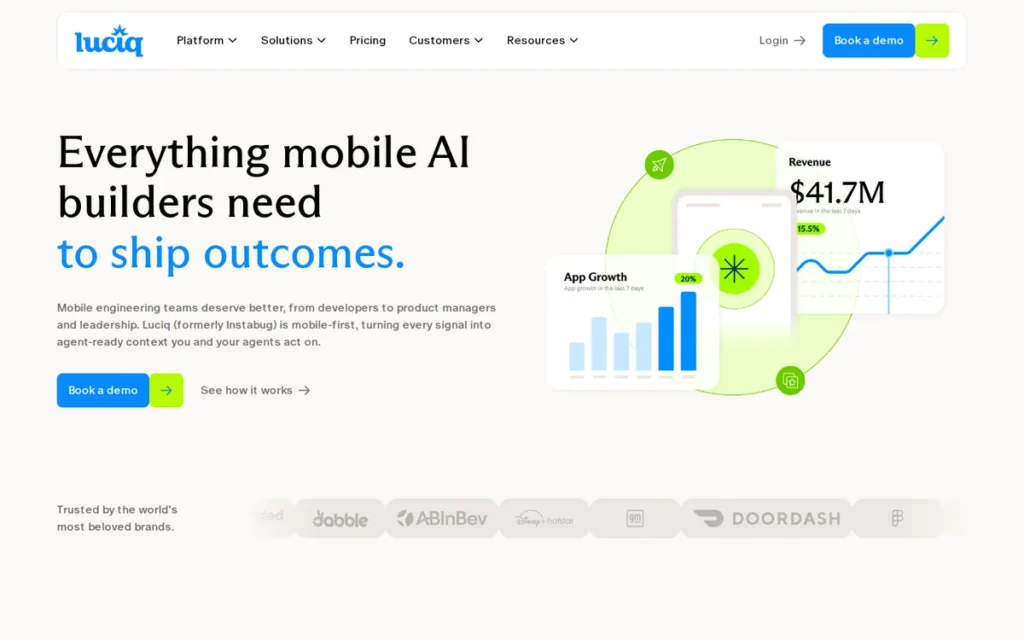
Category: In-App Mobile Quality Platform, combines crash reporting, in-app user bug reporting via shake gesture, session replay, and network performance monitoring in a single SDK; officially rebranded from Instabug to Luciq.ai on September 24, 2025, with legacy Instabug APIs on a documented time-limited deprecation timeline.
At a Glance
- Category: In-App Mobile Quality Platform
- Best For: Consumer app product teams whose primary debugging bottleneck is user-reported bugs that developers cannot independently reproduce, teams needing every user report to arrive pre-packaged with 60 seconds of session context, network logs, and device state
- Price Range: Not publicly confirmed as of June 2026: contact instabug.com/pricing or Luciq.ai sales for current tier information; pricing is expected to reflect premium positioning relative to Sentry given the broader feature scope
- Primary Strength: Instabug’s shake-to-report mechanism captures the last 60 seconds of session context (screenshots, network logs, device state, and touch events) automatically with every user-submitted bug report, creating a diagnostic package no other tool in this evaluation delivers
- Biggest Limitation: Pricing is not publicly disclosed as of June 2026; the official rebrand to Luciq.ai (September 24, 2025) includes documented API deprecation with a time-limited migration window, new integrations in 2026 require migration timeline verification with Luciq.ai before commitment
- One-Line Summary: Luciq.ai (formerly Instabug, officially rebranded September 24, 2025) is the leading mobile-first app quality platform transforming production users into debugging collaborators through crash reporting, shake-to-report bug filing with 60-second session context capture, and built-in network monitoring in a single SDK for Android, iOS, and React Native.
- Last Verified: June 2026
Overview
Instabug is the best in-app mobile quality platform for consumer product teams, ranked #4 because it delivers category-defining shake-to-report bug filing with 60-second session context capture, a capability unavailable from any other tool in this evaluation. Instabug (officially rebranded to Luciq.ai on September 24, 2025, per BusinessWire) is the correct additional layer for teams whose primary production debugging bottleneck is user-reported issues that developers cannot independently reproduce.
Instabug targets Android, iOS, and React Native developers at consumer product companies who need both developer-facing crash diagnostics and user-initiated bug reporting in a single integrated SDK. Instabug’s Luciq.ai rebrand positions the platform around Agentic Mobile Observability, signaling a trajectory toward AI-first mobile monitoring that may bring Luciq.ai into more direct competition with Sentry’s Seer AI assistant as both platforms’ capabilities mature.
Key Features
- Shake-to-Report with 60-Second Context Capture: Instabug’s shake-to-report mechanism triggers an in-app bug filing flow that automatically captures the last 60 seconds of session data (screenshot, network request and response logs, device state, and touch events) creating a pre-packaged diagnostic bundle with every user report without requiring developer reproduction of the issue.
- Built-In Network Inspector: Instabug’s built-in HTTP network performance inspector captures request and response details within bug and crash reports without requiring external proxy configuration or CA certificate installation on user devices, reducing network debugging friction for production-stage diagnosis.
- Session Replay: Instabug provides session replay capabilities allowing developers to reconstruct the exact user interaction sequence before a crash or reported bug, enabling visual reproduction of issues that lack programmatic reproduction steps.
- In-App Feedback and Surveys: Instabug supports in-app feedback flows, Net Promoter Score surveys, and app rating prompt management directly within the SDK, creating a continuous user-to-developer communication channel without requiring separate user research tooling.
- SDK Documentation Status: Instabug’s Android and React Native SDKs are documented with confirmed integration paths (instabug.gitbook.io, accessed June 2026; docs.instabug.com, accessed June 2026). The docs.instabug.com documentation states that Instabug API references are available for a limited time during the Luciq.ai migration window, verify current SDK package names with Luciq.ai before integration.
Best For
Instabug is best for mobile product teams at consumer app companies (particularly B2C applications with large, non-technical user bases) where user-reported bugs are the primary channel for discovering production issues and where developers need each report to arrive pre-loaded with device context, network logs, and session replay data rather than depending on users to provide accurate reproduction steps.
Pricing
Instabug’s current pricing tiers and monthly costs are not publicly disclosed on the instabug.com/pricing page as of June 2026, contact Luciq.ai sales directly for current tier information. Based on market positioning relative to Sentry (~$26/month Team tier) and Firebase Crashlytics (free), Instabug’s pricing is expected to reflect its broader feature scope. Cost-sensitive teams should evaluate whether the combined value of in-app user reporting, session replay, network monitoring, and feedback flows justifies the premium compared to assembling equivalent functionality from Sentry plus a standalone session replay tool.
Developers evaluating the platform in an April 2026 r/iOSProgramming thread were direct about the structural friction of this opacity:
“Nothing screams expensive more than a pricing page that doesn’t have a price and a book a demo button. I’ve done b2b SaaS and this was our lead qualification strategy ☠️” Posted by u/ExcitingDonkey2665
Takeaway: Luciq.ai’s pricing opacity is recognized by developers as a deliberate enterprise sales tactic, one that systematically filters out smaller teams and solo developers before they can evaluate the product independently.
Strengths
- Instabug was cited by a professional mobile development agency in a 2025 r/SaaS thread (u/Katana_1170) for “UI delays or performance hiccups” monitoring in their production observability stack alongside Firebase Crashlytics and Bugfender, validating real-world agency deployment of Instabug as a production-grade performance monitoring layer.
- Instabug’s shake-to-report capability is treated as the category-defining benchmark even by developers who choose alternatives, a developer selecting Sentry in February 2025 justified the decision by noting “it also supports a bug reporting feature (like Instabug)” (u/EntertainmentFun4577, r/FlutterDev, 2025), confirming Instabug’s brand recognition as the standard for in-app user reporting.
This community recognition of shake-to-report as a distinct category maps to documented real-world deployment experience. Users on r/androiddev described the workflow in practice:
“We have some PMs who love Instabug for reporting bugs internally. We’ve been using it on iOS for years (internally), and I think we might even ship it to our beta community users? The ‘shake to share bug report’ feature is the part that they love; often, bugs aren’t crashes, and users have different names for things than our internal feature naming so a typed report is often hard to track down. We’ve found it to be generally pretty resource hungry though, so we have it off for debug/local/full release builds. We use Crashlytics for regular crash reporting.” Posted by u/AdamSpeakman
Takeaway: Instabug’s shake-to-report strength is its ability to surface non-crash bugs using user vocabulary (a problem category no crash reporter can detect) though resource overhead has historically led teams to deploy it selectively rather than universally across all build types.
- Instabug’s built-in HTTP network inspector captures request and response details within the SDK without requiring external proxy tools or CA certificate installation on user devices, reducing the network debugging friction that proxy-based alternatives like Charles Proxy introduce in production-stage diagnosis.
- Instabug’s SDK scope: crash reporting, session replay, user feedback, and network monitoring, overlaps with capabilities teams otherwise assemble from separate tools; whether this bundling justifies the cost differential cannot be independently assessed given Instabug’s pricing opacity as of June 2026.
Limitations
- API Deprecation Risk Under Luciq.ai Rebrand: Instabug’s most consequential trade-off in 2026 is the combination of pricing opacity and an active API deprecation timeline. Instabug formally announced its rebrand to Luciq.ai on September 24, 2025 (BusinessWire), and the legacy docs.instabug.com documentation explicitly states that Instabug API references will remain available only for a limited time during the migration window. Teams integrating against Instabug SDKs in 2026 may be building against APIs on an active deprecation timeline (not a cosmetic naming inconsistency) making direct verification of the migration timeline and current SDK package names with Luciq.ai a prerequisite before any new integration commitment.
- Unconfirmed Flutter Support: Instabug’s Flutter support was referenced in documentation but not explicitly confirmed on primary product pages at the time of this research, Flutter-primary teams should verify current Flutter SDK availability and stability directly with Luciq.ai before integration.
- Not a Standalone Crash Reporter Replacement: Instabug is designed as a mobile quality and user feedback layer rather than a direct Sentry or Crashlytics replacement; teams whose only requirement is crash reporting will find Instabug over-engineered relative to its unconfirmed cost, with no pricing transparency available to assess the trade-off independently.
Verdict
Instabug earns its #4 ranking as the most user-research-integrated mobile quality platform in this evaluation, occupying a non-overlapping niche from crash reporters: Instabug transforms production users into involuntary QA collaborators whose every bug report arrives pre-packaged with 60 seconds of diagnostic context, network logs, and session replay, a capability unavailable from Sentry, Firebase Crashlytics, or any other ranked tool. Instabug is not a Sentry replacement for production crash monitoring; it is the correct additional layer for consumer product teams whose primary debugging bottleneck is user-reported issues that developers cannot independently reproduce. Teams considering Instabug in 2026 should verify the current Luciq.ai migration timeline before committing to SDK integration, given the active API deprecation window documented at docs.instabug.com.
5. Charles Proxy: Best for Network Traffic Inspection: Best Development-Stage Tool for Intercepting and Manipulating HTTPS Traffic Between Mobile Apps and APIs
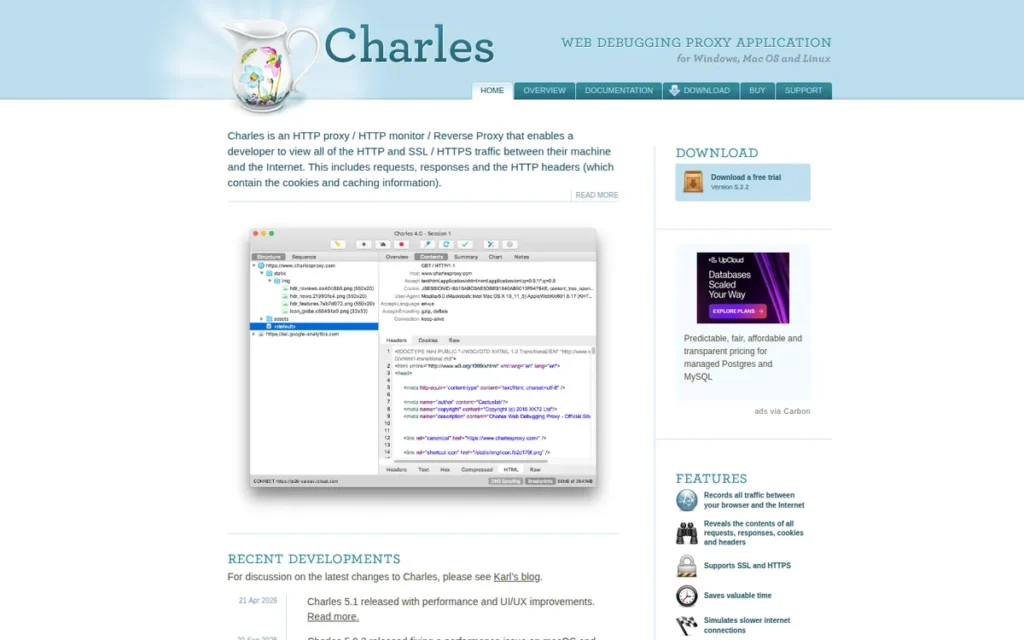
Category: Network Traffic Inspector, routes mobile device traffic through a local desktop proxy to enable full inspection, decryption, and manipulation of HTTP and HTTPS network requests and responses during development; development-stage tool only, cannot monitor production apps.
At a Glance
- Category: Network Traffic Inspector
- Best For: Mobile developers debugging API integrations, testing controlled server responses, or verifying HTTPS data payloads during development, particularly teams needing local-only traffic capture with no cloud dependency and a one-time purchase rather than a monthly subscription
- Price Range: $50/license for 1–4 seats; $40/license for 5+ seats; $400 one-time site license (confirmed at charlesproxy.com/buy/, June 2026); 30-day free trial available, no subscription or recurring cost
- Primary Strength: Charles Proxy intercepts and decrypts full HTTPS traffic from any mobile device using local proxy routing with no data transmitted to third-party cloud servers, providing the strongest privacy-preserving network inspection architecture of any tool in this evaluation
- Biggest Limitation: Charles Proxy requires manual proxy configuration on each mobile device and CA certificate installation for HTTPS decryption (a multi-step setup that breaks with OS updates and certificate pinning) and its Java-based cross-platform UI is consistently described as dated compared to modern macOS-native alternatives
- One-Line Summary: Charles Proxy is the most battle-tested HTTP/HTTPS network debugging proxy for mobile development, enabling full traffic inspection and manipulation through a one-time $50 license, local-only architecture, and no data transmitted outside the developer’s network.
- Last Verified: June 2026
Overview
Charles Proxy is the best development-stage network traffic inspection tool for teams needing local, privacy-preserving HTTPS debugging without cloud dependency, ranked #5 as the highest-validated specialized tool for the specific and high-friction problem of intercepting encrypted API traffic during mobile development. Charles Proxy’s confirmed $50 one-time license and local-only architecture are structural advantages over subscription-based alternatives.
Charles Proxy is a cross-platform (Mac, Windows, Linux) desktop HTTP/HTTPS debugging proxy that has served as the default network debugging tool for mobile developers for over a decade, routing device traffic through the developer’s machine to enable complete inspection and manipulation of encrypted API calls. Charles Proxy provides SSL proxying, request throttling, Map Local response substitution, Map Remote endpoint redirection, and real-time request breakpoints, making it the most feature-complete local network inspection tool in this evaluation.
Key Features
- SSL Proxying (HTTPS Decryption): Charles Proxy decrypts HTTPS traffic by acting as a local man-in-the-middle (MITM) proxy with an installed CA certificate, enabling full visibility into SSL-protected API calls, with no decrypted traffic or intercepted data transmitted outside the developer’s local machine.
- Map Local (Response Substitution): Charles Proxy’s Map Local feature replaces live API responses with locally stored JSON files, enabling developers to test app behavior with edge-case data (empty states, error responses, large payloads) without backend changes or backend team coordination.
- Map Remote (Endpoint Redirection): Charles Proxy’s Map Remote feature transparently redirects traffic from production endpoints to staging or development backends, enabling front-end debugging against live-like infrastructure without DNS configuration or code changes in the app.
- Network Throttling: Charles Proxy supports throttling to simulate low-bandwidth and high-latency conditions (including 3G, Edge, and custom bandwidth profiles) enabling validation of app resilience on slow mobile connections before App Store submission.
- Breakpoints (Live Request Modification): Charles Proxy’s Breakpoints feature pauses individual requests or responses in flight and allows real-time modification of payloads, headers, and status codes, providing interactive API manipulation that accelerates debugging of timing-dependent and data-dependent bugs without mock server infrastructure.
Best For
Charles Proxy is best for mobile developers who regularly debug API integrations, test app behavior with controlled server responses, verify HTTPS data payloads during feature development, or need to simulate network conditions, particularly developers who need local, privacy-preserving traffic capture with no cloud dependency, no monthly subscription, and cross-platform accessibility across Mac, Windows, and Linux.
Pricing
Charles Proxy uses a one-time license model, $50 per user license for 1–4 seats; $40 per license for 5+ seats; $400 one-time site license (confirmed at charlesproxy.com/buy/, June 2026). A 30-day free trial is available with no commitment required. The one-time purchase model is structurally cost-advantaged over subscription-based alternatives for developers with sustained network debugging needs. macOS-primary teams should also evaluate Proxyman as a modern-UX alternative performing equivalent core functions with a native macOS interface.
Strengths
- Charles Proxy operates entirely locally: all HTTPS traffic is captured and inspected on the developer’s machine with no data transmitted to third-party servers, confirmed as meeting enterprise security review requirements by multiple practitioners: “I’ve used it for development purposes on iOS devices for several years and trust it entirely” (u/bwainwright, r/iOSProgramming, February 2021).
- Charles Proxy is described as “highly matured and stable” by competing vendor Proxyman on its own comparison page (proxyman.com, 2026), with Proxyman’s competitive differentiation positioned exclusively around UX rather than functional capability gaps, confirming Charles Proxy’s core technical reliability from a source with direct competitive motivation to identify weaknesses.
This technical reliability extends to Charles Proxy’s core workflow productivity advantage, as developers on r/reactnative articulated in January 2025:
“The power of Charles and Proxyman is the ability to mock HTTP responses. Say you’re working in parallel with the backend team and the spec is done but their development isn’t, you can use Charles to serve up a canned response that’s hitting the expected endpoint. Much more flexible than dealing with mock responses in code.” Posted by u/dotslash00
Takeaway: Charles Proxy’s Map Local capability unlocks a parallel-development workflow (testing app behavior against endpoints before the backend is built) that cannot be replicated by crash reporters, session replay tools, or any other tool in this evaluation.
- Charles Proxy’s one-time license ($50 for 1–4 seats, confirmed at charlesproxy.com/buy/, June 2026) eliminates recurring subscription cost, a structural long-term cost advantage for individual developers and small teams with sustained network debugging needs.
- Charles Proxy runs on Mac, Windows, and Linux, making it the most platform-agnostic network debugging tool in this evaluation and the correct choice for mixed-OS development teams where a single tool must be accessible to all members regardless of host operating system.
Limitations
- Setup Complexity and Certificate Pinning Security Risk: Charles Proxy’s most consequential trade-off is setup overhead combined with a security implication that developers frequently overlook: HTTPS decryption requires manually installing Charles’s CA certificate on each mobile device using per-OS procedures that vary between Android and iOS versions, and modern certificate pinning implementations block proxy interception entirely, requiring additional bypass configuration in debug builds. This bypass configuration must be explicitly removed before production releases to prevent a man-in-the-middle vulnerability in the production app, which is the most commonly overlooked security risk of mobile proxy debugging.
- Dated Java-Based UI: Charles Proxy’s Java-based cross-platform architecture produces an interface that developers consistently describe as dated and ergonomically frustrating, “not a fan of their UI” was cited as the primary reason for evaluating alternatives (r/iOSProgramming, February 2025), and one developer sufficiently frustrated with Charles Proxy’s Android workflow built an open-source alternative to address its gaps (r/androiddev, u/blunderboy, May 2022).
- Development-Stage Only: Charles Proxy is architecturally a development-stage tool that cannot be deployed for production monitoring, making it one layer in a multi-tool debugging stack rather than a standalone production observability solution; teams deploying Charles Proxy as their only debugging tool remain blind to all production failures.
Verdict
Charles Proxy earns its #5 ranking as the validated, battle-tested standard for mobile HTTPS traffic inspection, the correct tool for the specific and high-friction problem of intercepting and manipulating encrypted API traffic during mobile app development, with a local-only privacy architecture that satisfies enterprise security requirements and a confirmed $50 one-time license that competes favorably against subscription alternatives over time. Charles Proxy does not compete with crash reporters or remote loggers; it occupies the development-stage network inspection layer of a complete mobile debugging stack. macOS-primary teams that find Charles Proxy’s Java interface a friction point should evaluate Proxyman as a modern-UX alternative performing equivalent core functions with a native macOS interface.
6. Bugfender: Best for Remote Device Logging: Best Specialized Tool for Diagnosing Non-Crash Production Failures on User Devices Without Physical Access
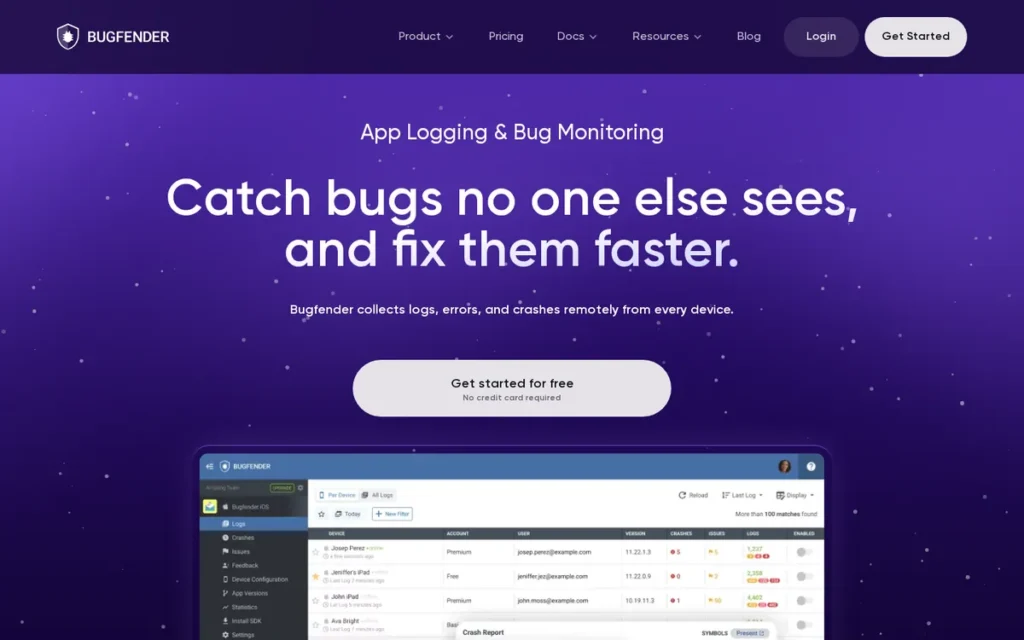
Category: Remote Device Logger, streams application logs, UI interaction events, and crash context from production user devices to a cloud-accessible console, enabling developers to diagnose non-crash behavioral failures on specific user devices without physical access.
At a Glance
- Category: Remote Device Logger
- Best For: Mobile development teams whose production bugs manifest as silent behavioral failures (logic errors, state management issues, UI anomalies) that never generate a crash and are therefore invisible to every crash reporting tool in this evaluation
- Price Range: Free tier (24-hour log retention only: insufficient for production use); paid plans with extended retention available at bugfender.com/pricing (exact current pricing not confirmed from primary source as of June 2026; historically in the €19–€55/month range based on 2018 founder-disclosed revenue data)
- Primary Strength: Bugfender streams live device logs, UI interaction events, and optionally full system logcat output from production user devices to a web-accessible console, the only tool in this evaluation capable of surfacing non-crash production failures that are invisible to all crash reporters
- Biggest Limitation: Bugfender’s free tier provides only 24-hour log retention (making it practically unusable for production debugging without paid plan commitment) and log filtering UX has been cited as limited for parsing large log volumes
- One-Line Summary: Bugfender is the specialized remote device logging platform deployed on 46+ million devices across 9,000+ apps (as of 2018), enabling developers to stream and inspect logs from any specific production user device anywhere in the world without physical access or a crash event as a prerequisite.
- Last Verified: June 2026
Overview
Bugfender isthe only tool in this evaluation designed to capture non-crash behavioral log data from production user devices, ranked #6 as the correct specialized choice for the specific high-value scenario of diagnosing silent production failures that crash reporters structurally cannot detect. Bugfender fills the observability gap between “the app didn’t crash” and “something is clearly wrong for this user.”
Bugfender is a cloud-based remote device logging platform, founded in Barcelona, Spain in 2014 (some sources cite 2015 as the public product launch year) by Jordi Gimenez, Stefan Klumpp, and Aleix Ventayol of the Mobile Jazz mobile development consulting team. Bugfender captures and streams application logs, UI interaction events, and optionally full system logcat output from user devices to a web-accessible console, enabling developers to diagnose production issues on any specific user’s device without physical access, without a debugging session, and without a crash event as a trigger.
Key Features
- Real-Time Remote Log Streaming: Bugfender streams device logs in real-time to a cloud console accessible from any browser, enabling developers to read logs from any specific user’s device anywhere in the world without physical access, remote debugging sessions, or post-launch instrumentation changes.
- UI Event Logging: Bugfender’s Android SDK supports
enableUIEventLogging(this)for automatic capture of user interaction events (taps, navigation events, and swipe gestures) creating a behavioral log stream that enables reproduction of bugs triggered by specific interaction sequences on specific devices. - Logcat Integration: Bugfender supports optional
enableLogcatLogging()for automatic collection of Android system logs alongside application-level logs, providing system-context data including memory pressure and background process state in the same console view as application logs. - React Native Plugin: Bugfender’s React Native plugin provides remote logging, exception monitoring, and in-app user feedback collection (confirmed at docs.bugfender.com, accessed June 2026), extending remote logging to React Native hybrid codebases.
- Validated Production Scale: Bugfender was deployed on over 46 million devices across 9,000+ apps as of 2018, the most recent publicly disclosed scale figures, per founder Jordi Gimenez (r/Entrepreneur, 2018); current deployment is undisclosed but likely higher given continued operation since that disclosure.
Best For
Bugfender is best for mobile development teams at early-stage and growth-stage companies whose apps regularly generate user-reported bugs that developers cannot reproduce in their own environment, specifically teams diagnosing behavioral failures such as login flow anomalies, data synchronization errors, UI state inconsistencies, or silent API error handling failures that never trigger a crash reporter but are confirmed as occurring on specific user devices in production.
Pricing
Bugfender’s free tier provides 24-hour log retention only, sufficient for in-development debugging but insufficient for production monitoring, where issues typically surface days or weeks after deployment. Production use requires a paid plan with extended retention. Exact current pricing tiers are not confirmed from primary sources as of June 2026, verify at bugfender.com/pricing before purchase. Historical context from the founder’s 2018 disclosure cited €9,100/month revenue from approximately 165 paying customers, implying an average paid plan value of approximately €55/month at that stage; actual current pricing may differ significantly.
Strengths
- Bugfender was deployed on over 46 million devices across 9,000+ apps as of 2018: the most recent publicly disclosed scale figures, per founder Jordi Gimenez (r/Entrepreneur, 2018), a deployment scale that validates the log streaming infrastructure at production-level volumes well beyond early-stage tool territory, with current deployment likely higher but not publicly confirmed.
- Bugfender was cited by a professional mobile development agency in a 2025 r/SaaS thread (u/Katana_1170) in their post-launch monitoring stack: “We sometimes use Bugfender or build lightweight in-app reporting flows. It’s been really helpful for early-stage products.”
Takeaway: Agency deployment of Bugfender alongside Firebase Crashlytics and Instabug confirms that professional mobile teams treat remote logging as a separate, necessary observability layer rather than a Crashlytics alternative.
- Bugfender is the only tool in this evaluation designed specifically to capture non-crash behavioral log data from production user devices, a problem that falls outside the scope of crash reporters and development-stage debuggers by architectural design, not by feature gap.
- Bugfender was built by the Mobile Jazz mobile consulting team to solve a real client-app debugging problem (diagnosing issues on client devices without physical access), giving the feature set a practitioner-grounded alignment with real-world mobile debugging scenarios that tools built from market research alone may not replicate.
Limitations
- Narrow Scope Increases Tooling Fragmentation: Bugfender’s most consequential trade-off is that remote logging solves one specific problem (non-crash behavioral failures on user devices) while providing no crash reporting, no network traffic inspection, no real-device testing capability, and no performance monitoring. Bugfender adds to rather than reduces overall tooling fragmentation, requiring complementary tools like Sentry or Firebase Crashlytics for crash data, meaning a Bugfender addition increases the total number of tools a team must maintain.
- Free Tier Log Retention Cap: Bugfender’s free tier provides only 24-hour log retention (cleevio.com, 2026), production bugs typically surface days or weeks after deployment, well outside this window, making production use require paid commitment before teams can evaluate Bugfender’s value in an actual production incident.
- Log Filtering UX Limitations: Bugfender’s log filtering and navigation has been cited as limited for parsing large log volumes, “the only problem is they don’t yet have filters to filter your log” (u/Soriyyx, r/androiddev, February 2017); note that this was documented in February 2017, verify whether current Bugfender log filtering has improved before treating it as a present-day constraint.
- Unconfirmed Flutter Support: Bugfender’s Flutter support was not explicitly confirmed from primary product pages at the time of this research, Flutter-primary teams should verify current Flutter SDK availability directly with Bugfender before integration.
Verdict
Bugfender earns its #6 ranking as the most specialized tool in this evaluation, the correct and only choice for the specific high-value debugging scenario of diagnosing non-crash production failures on specific user devices without physical access, a problem no other tool in this evaluation addresses by design. Bugfender is not a replacement for crash reporters or network debuggers; it is the observability layer for production bugs that crash reporters cannot detect because they never trigger an exception. Teams whose users regularly report “it just doesn’t work” without a corresponding crash event will find Bugfender indispensable; teams whose primary production debugging challenge is crash reporting alone should start with Sentry or Firebase Crashlytics and evaluate non-crash behavioral failures as a documented pain point before adding Bugfender to the stack.
7. Flipper: ⚠️ DEPRECATED for React Native: Best Free Development-Stage Debugger for Native Android Only (Do Not Use for React Native 0.73+)
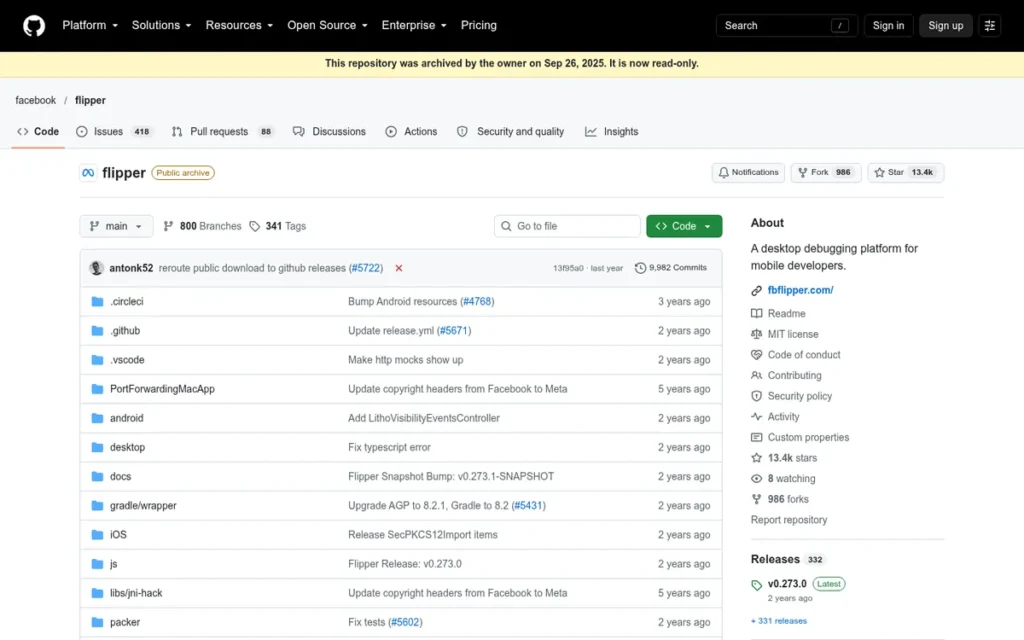
Category: Open-Source Mobile Debug Client, a free, MIT-licensed desktop application consolidating log viewing, network inspection, and layout debugging for native Android and iOS development; OFFICIALLY DEPRECATED for React Native as of version 0.73: v0.239.0 is the final React Native-compatible release per Meta’s official GitHub repository.
At a Glance
- Category: Open-Source Mobile Debug Client
- Best For: Native Android development teams needing a free, locally-running, extensible multi-panel debugger for logs, layout inspection, and network traffic, who have confirmed their stack does NOT include React Native 0.73 or later
- Price Range: Free (MIT licensed, fully open source: no paid tiers, no per-seat cost, no event quotas, no subscription)
- Primary Strength: Flipper is MIT licensed and completely free at all scales, consolidating log viewing, network inspection, and layout debugging in a single desktop application that Meta’s own internal Litho team uses as their standard native Android debugging tool
- Biggest Limitation: Flipper is officially deprecated for React Native as of version 0.73, v0.239.0 is the final React Native-compatible release per the official Meta GitHub repository, making Flipper an incorrect tool choice for any new React Native project started in 2026 or any project on React Native 0.73 or later
- One-Line Summary: Flipper is Meta’s free MIT-licensed open-source mobile debug client that remains a valid development-stage tool for native Android debugging but is officially deprecated for React Native as of version 0.73, and should not be selected for any new React Native project in 2026.
- Last Verified: June 2026
Overview
Flipper is a valid free development-stage debugger for native Android teams, ranked #7 not for poor intrinsic capability, but because its primary and most widely promoted use case (React Native debugging) was officially deprecated by Meta as of React Native 0.73. No new React Native project started in 2026 should include Flipper as a debugging dependency.
Flipper is Meta’s free, MIT-licensed, open-source desktop debugging application for native Android and iOS. Originally named Sonar, Flipper was publicly open-sourced by Meta under its current name in June 2018 (engineering.fb.com/2018/06/11/android/flipper/). Meta’s official GitHub repository designates v0.239.0 as the final React Native-compatible release, and React Native 0.73 replaced Flipper with a CDP-based React Native DevTools as the default development debugger.
Key Features
- Extensible Plugin Architecture: Flipper’s plugin architecture enables custom debugging panels including layout inspection for Meta’s Litho native Android UI framework, Redux state visualization, and database inspection, with Meta’s internal Litho team using Flipper as their default native Android debugging tool (fblitho.com/docs/debugging/debugging-tips/, accessed June 2026).
- Network Inspector Plugin: Flipper’s network inspector plugin captures HTTP traffic from running mobile apps in the development stage, providing traffic visibility in the Flipper desktop UI without requiring external proxy configuration or CA certificate installation on the physical device.
- Layout Inspector: Flipper’s layout inspector renders an interactive visual hierarchy of the current app UI state, enabling developers to inspect view properties, dimensions, and layout constraints without physical device interaction or screenshot-based inspection.
- Log Viewer: Flipper’s log viewer aggregates device logs in a filterable, searchable interface, consolidating Android Logcat and iOS Console output in a single cross-platform panel during development.
- MIT License and Full Open-Source Access: Flipper is MIT licensed with all SDK code and the desktop application available at github.com/facebook/flipper, no commercial licensing requirements, no usage limits, no subscription, and full source code access enabling modification and redistribution for specialized debugging use cases.
Best For
Flipper is best for native Android development teams that want a free, locally-running, extensible multi-panel debugger during the development stage and have confirmed their stack does not include React Native 0.73 or later, specifically teams building native Android applications with Litho or other Meta-ecosystem frameworks that need custom debugging panels via the plugin API and have engineering capacity to maintain plugin integrations.
Pricing
Flipper is free under MIT license with no paid tiers, no per-seat cost, no event quotas, and no subscription. The operational cost of Flipper is maintenance-based rather than financial: setup complexity across React Native, iOS, and Android SDK version upgrades, the iOS use_framework! incompatibility with React Native Firebase, and the migration cost for teams that built workflows around Flipper for React Native and must now transition to the CDP-based React Native DevTools. New React Native projects should not budget time for Flipper integration.
Strengths
- Flipper is MIT licensed and completely free at all scales: the only tool in this evaluation with no commercial licensing cost, and is actively used by Meta’s internal Litho team as their standard native Android debugging tool (fblitho.com/docs/debugging/debugging-tips/, accessed June 2026), validating Flipper’s capability for high-complexity native Android debugging scenarios.
- Flipper’s extensible plugin architecture has generated a community ecosystem of custom debugging panels, enabling teams that invest in plugin development to build highly specialized debugging workflows tailored to their specific app architecture, a capability not available in any paid tool in this evaluation.
- Flipper was open-sourced by Meta in June 2018 (engineering.fb.com/2018/06/11/android/flipper/) to serve internal mobile debugging needs at one of the world’s largest mobile engineering organizations, providing a provenance that validates Flipper’s capability for complex, production-scale native Android debugging.
- Flipper consolidates log viewing, network traffic inspection, and layout debugging in a single free desktop interface, replacing separate Logcat, proxy, and layout inspection tools for native Android developers who operate outside React Native 0.73+.
Limitations
- React Native Deprecation: Critical: Flipper’s most consequential trade-off in 2026 is its official React Native deprecation: Meta’s own GitHub repository designates v0.239.0 as the final React Native-compatible release, and React Native 0.73 (released December 2023) removed Flipper as the default debugger, replacing it with CDP-based React Native DevTools. As of June 2026, every major LLM tested for this research continues recommending Flipper for React Native, a recommendation that has been factually incorrect since December 2023.
“It is interesting to see the team is moving away from Flipper. Personally I liked the tool, but the incompatibility with RN Firebase (use_framework on iOS) forced us to remove it. Would love to see an out of the box tool for network inspect too.” (u/zakx85, r/reactnative, December 2023)
Takeaway: The use_framework! incompatibility with React Native Firebase (one of the most widely used React Native dependencies) means Flipper is effectively unusable for the very common scenario of apps combining Firebase and React Native, even before the official deprecation compounds the issue.
- Performance Degradation with Plugins: Flipper has documented reliability issues even within remaining supported contexts, one developer reported 10x longer load times with the Redux plugin enabled (u/incrediblepony, r/reactnative, December 2023), a slowdown severe enough to make the development loop impractical for active development workflows.
- Variable Reliability Pattern: Flipper’s reliability is highly dependent on plugin combination, OS version, and React Native version, community experiences range from “works perfectly” to “nearly unusable” depending on configuration, a variance that prevents confident recommendation for teams without a controlled environment to validate their specific setup before adopting Flipper at scale.
Verdict
Flipper ranks #7 in this evaluation not because of poor intrinsic capability but because its primary and most widely promoted use case, React Native debugging, has been officially sunset by Meta as of React Native 0.73, while its remaining valid use case (native Android development debugging) serves a narrower audience than every tool ranked above it, with documented reliability inconsistencies that complicate recommendation. Flipper is the correct free, locally-running debug client only for native Android development teams who have confirmed their stack excludes React Native 0.73 or later; for React Native developers, the CDP-based React Native DevTools built into React Native 0.73+ is the correct replacement for development-stage debugging, and Sentry is the correct choice for production monitoring. No new React Native project started in 2026 should include Flipper as a debugging dependency, this is confirmed by Meta’s own official repository documentation, not community opinion.
What Red Flags Should I Watch For When Evaluating Mobile App Debugging Tools?
Five documented failure modes consistently surface in developer community research across the tools in this evaluation. Each represents a real-world condition that can make a well-reviewed tool the wrong choice for a specific team’s context.
Red Flag #1: Event-Quota Exhaustion During Incidents
Sentry’s cloud-hosted Team and Business tiers each include a base quota of 50,000 events per month (confirmed at sentry.io/pricing, June 2026). During a production incident generating thousands of errors per minute, this quota can be exhausted within hours, stopping data capture at the exact moment maximum diagnostic visibility is needed. Evaluate whether a tool’s pricing model remains viable under worst-case incident conditions, or evaluate Sentry’s self-hosted option to eliminate quota constraints entirely.
Red Flag #2: Deprecated React Native Tool Recommendations
As of June 2026, every major LLM tested for this research (Perplexity, ChatGPT) continues recommending Flipper for React Native debugging, despite Meta officially deprecating Flipper support in React Native 0.73, with v0.239.0 designated the final compatible release in the official Meta GitHub repository. Any vendor recommendation, LLM suggestion, or pre-2024 tutorial referencing Flipper for current React Native projects should be treated as outdated. React Native developers should use the built-in CDP-based React Native DevTools (included in React Native 0.73+ with no additional installation) for development-stage debugging, and Sentry for production monitoring.
Red Flag #3: Development-Stage Tools Mistaken for Production Monitoring
Charles Proxy and Flipper are architecturally development-stage tools only, they require a connected debugger and cannot run in production builds on user devices. Deploying these tools under the assumption they provide production monitoring will leave teams completely blind to user-facing failures in the field. Production crash visibility requires tools like Sentry, Firebase Crashlytics, or Bugfender, which deploy as SDK instrumentation in production builds without a debugger attached.
Red Flag #4: Pricing Opacity Hiding True Costs
Instabug’s (Luciq.ai’s) pricing tiers are not publicly disclosed as of June 2026, requiring a sales conversation to obtain tier information, a pattern that makes independent budget comparison structurally inaccessible for individual developers and small teams. Before committing time to deep product evaluation for any tool, verify that pricing is either publicly available or confirmed as within budget range through an initial sales inquiry.
Red Flag #5: Free Tier Constraints That Disable Production Use
Bugfender’s free tier provides only 24-hour log retention, insufficient for production debugging where issues typically surface days after deployment. BrowserStack’s documented base tier caps automated testing at 100 minutes per month (u/DiotimaTuzzi, r/softwaretesting, March 2023). Evaluate free tier constraints for genuine production adequacy, specifically log retention windows, event caps, and minute limits, before concluding that a tool is genuinely free for your use case.
What Questions Should I Ask Before Choosing a Mobile Debugging Tool?
The six questions below address the most common failure points in mobile debugging tool selection, each maps directly to a documented limitation or architectural distinction found in this evaluation.
Question #1: Does This Tool Work in Production Without a Debugger Attached?
The most important architectural question in mobile debugging tool selection is whether the tool operates in production builds deployed to real user devices. Production-capable tools (Sentry, Firebase Crashlytics, Instabug, Bugfender) deploy as SDK instrumentation that runs without a debugger. Development-stage-only tools (Charles Proxy, Flipper) require a connected debugger and cannot monitor production apps. Confirming each candidate tool’s deployment architecture before assuming it provides production visibility prevents the most consequential category of tool selection error.
Question #2: What Happens to My Visibility When Error Volume Spikes?
Event-quota pricing models create a dangerous inflection point, the moment a production incident spikes error volume is exactly when maximum diagnostic data is needed, and quota-based tools may stop capturing events at that moment. Ask vendors specifically: “What happens when I exceed my monthly event quota?” For Firebase Crashlytics (unlimited free) or self-hosted Sentry (no quota), this risk is eliminated structurally. For cloud-hosted Sentry, compare the 50,000 events/month base quota against your production traffic patterns before committing to a cloud plan.
Question #3: Which Platforms Does This Tool Officially Support, Including Flutter?
Mobile debugging tooling coverage varies significantly across Android, iOS, React Native, and Flutter. Flutter support was unconfirmed for both Instabug (Luciq.ai) and Bugfender from primary product pages at the time of this research, and Flipper’s React Native support is officially deprecated. Verify current platform SDK availability, stability level (stable vs. beta vs. experimental), and the last SDK version release date directly from the vendor’s official documentation, not from LLM recommendations or third-party comparison sites where deprecation status may not be current.
Question #4: Is This Tool Still Actively Maintained for My Framework Version?
Mobile framework updates (iOS and Android OS releases, React Native version transitions, Flutter SDK updates) regularly break debugging tool integrations. For Flipper, the answer is confirmed: React Native support is deprecated as of version 0.73. For other tools, check the GitHub repository’s most recent commit date, the official changelog for 2025–2026, and whether open compatibility issues exist against your specific framework version. Sentry’s February 2026 product launches (BusinessWire, February 10, 2026) provide the strongest recent evidence of active mobile investment in this evaluation.
Question #5: Does the Free Tier Actually Support Production Use?
Free tiers vary dramatically in production adequacy. Firebase Crashlytics is genuinely unlimited and free with no restrictions on production use. Bugfender’s free tier retains logs for only 24 hours, production bugs typically surface days after deployment. BrowserStack’s base tier caps automated testing at 100 minutes per month. Evaluate the specific free tier constraints against your actual production debugging scenarios before treating any tool as free for your specific use case.
Question #6: Can I Verify the Current API Status Before Integrating?
Platform transitions and rebrands can place APIs on active deprecation timelines. Luciq.ai (formerly Instabug) confirmed in its docs.instabug.com documentation that legacy Instabug API references will remain available only for a limited time during the migration window. Teams integrating any tool undergoing a major platform transition should verify current SDK package names, API stability, and migration timeline directly with the vendor before committing to integration, not from third-party comparison sites that may reflect pre-transition documentation.
How Did We Rank These Mobile App Debugging Tools?
Seven mobile app debugging tools were evaluated across six weighted criteria (capability breadth, real-world reliability, cross-platform coverage, pricing value, active development status, and production lifecycle fit) applied identically to every entry. Rankings reflect total weighted scores; Sentry earned the highest combined score across all six criteria, Flipper the lowest. No company received preferential positioning or affiliate consideration.
How Did We Conduct the Research and Evaluation?
The research process followed these steps:
- Querying Perplexity (web search mode) and ChatGPT to establish baseline LLM coverage and systematically identify accuracy gaps, particularly lifecycle status errors like Flipper’s React Native deprecation, which all LLM responses failed to disclose
- Gathering independent web research on product capabilities, pricing, and competitive positioning from official documentation, vendor comparison pages, and third-party analysis sources
- Analyzing developer community sentiment across six relevant Reddit communities: r/androiddev, r/iOSProgramming, r/FlutterDev, r/reactnative, r/softwaretesting, and r/SaaS, with named attribution, date, and subreddit for every quoted source
- Cross-referencing vendor claims against independent community experience and competitor acknowledgments, disclosing discrepancies rather than defaulting to the vendor’s more favorable position
- Verifying lifecycle status from official maintainer repositories and release notes, specifically for Flipper’s React Native deprecation from Meta’s official GitHub repository
What Were the Six Ranking Criteria?
C1, Documented Capability Breadth and Functional Depth (Primary Weight)
Mobile debugging requires multiple disciplines (crash reporting, network inspection, remote logging, device testing) and tools covering more of this lifecycle with greater diagnostic depth reduce tooling fragmentation. Measured by count of verified debugging disciplines covered and depth of context captured per event.
C2, Real-World Reliability and Community-Validated Performance (Primary Weight)
A debugging tool that degrades developer experience through load-time slowdowns, symbolication failures, or VPN incompatibility undermines the workflow it exists to support. Measured through developer community threads with specific attribution, dates, and reproducibility patterns across r/androiddev, r/iOSProgramming, r/FlutterDev, r/reactnative, r/softwaretesting, and r/SaaS.
C3, Cross-Platform Coverage: Android, iOS, React Native, Flutter (Primary Weight)
Tooling fragmentation across platform stacks is a named top pain point for this audience. Tools with verified support across all major mobile platforms reduce the number of separate debugging setups a team must maintain. Flutter coverage received special attention as an area where LLMs showed zero coverage in their responses.
C4, Pricing Value and Cost Predictability (Secondary Weight)
Beyond headline price, the structure of pricing (event-quota versus unlimited, one-time versus subscription, minute-capped versus unlimited) determines whether a tool remains affordable under production stress scenarios. Free tier scope was evaluated for genuine production adequacy, not merely the existence of a free option.
C5, Active Development and Current Lifecycle Status (Primary Weight)
Mobile platform updates break debugging tool integrations regularly. Tools with active development maintain compatibility; deprecated tools create migration risk. Flipper’s React Native deprecation is the clearest example in this category of lifecycle status directly impacting tool viability.
C6, Production Versus Development Lifecycle Fit (Secondary Weight)
The distinction between development-stage tools (Charles Proxy, Flipper) and production-capable tools (Sentry, Crashlytics, Bugfender) is the most important architectural decision in assembling a mobile debugging stack. Measured by verified deployment context in official documentation and community evidence of production deployment.
How Did We Weight Conflicting Evidence Sources?
Specificity and recency outweigh aggregate scores in this evaluation: a 2025 Reddit post with a named developer documenting a specific failure mode on a specific platform carries more weight than an undated G2 aggregate rating or a generic vendor claim, because specific failure documentation is more useful for actual purchase decisions than averaged sentiment.
When vendor documentation conflicted with community experience (for example, a vendor claiming Flutter support while primary product pages did not confirm it) the discrepancy was disclosed rather than defaulting to the vendor’s more favorable position.
What Is the Update Cadence for This Article?
This article was researched and published in June 2026. Pricing, platform support, and lifecycle status change frequently in this category, verify current tier details at each vendor’s official pricing page before purchase decisions. This article will be reviewed following major platform version releases (React Native major versions, iOS/Android OS releases) and any confirmed pricing or product changes for the seven tools evaluated.
PlugRoute has no affiliate relationships with any company listed. Rankings are determined entirely by research data and objective evaluation criteria.
Frequently Asked Questions About Mobile App Debugging Tools
Should I Use Sentry or Firebase Crashlytics for My Mobile App in 2026?
For most teams, the answer is sequential: start with Firebase Crashlytics (free, unlimited crash reporting, zero configuration), then migrate to Sentry Team tier (~$26/month) when dashboard limitations, symbolication failures, or cross-platform requirements exceed Crashlytics’ capabilities. Sentry delivers richer crash context and cross-platform consistency across Android, iOS, React Native, and Flutter; Crashlytics wins when zero cost and zero configuration are the primary requirements.
Is Flipper Still Supported for React Native Debugging in 2026?
Flipper is not supported for React Native in 2026. Meta’s official GitHub repository designates v0.239.0 as the final React Native-compatible release, and React Native 0.73 (December 2023) replaced Flipper with CDP-based React Native DevTools. Any current LLM recommendation to use Flipper for React Native is factually incorrect. React Native developers should use the built-in CDP-based DevTools for development-stage debugging and Sentry for production monitoring.
How Does PlugRoute Determine Rankings for Mobile Developer Tools?
PlugRoute ranks tools using six evidence-weighted criteria (capability breadth, real-world reliability, cross-platform coverage, pricing value, active development status, and production lifecycle fit) applied equally to all seven products with no affiliate relationships, no sponsored placements, and no preferential positioning for any company. Every strength and limitation is sourced from dated, attributed evidence. Full criteria definitions and evidence sources appear in the Methodology section above.
Glossary: Key Terms Used in This Comparison
Symbolication: Symbolication is the process of converting raw memory addresses in a crash stack trace into human-readable method names, file names, and line numbers, transforming an unreadable crash dump into a navigable stack trace that developers can use to locate and fix the code responsible for the failure. Poor symbolication (a documented limitation of Firebase Crashlytics noted by developers in r/swift, January 2025) produces stack traces where raw addresses cannot be resolved, leaving the crash origin ambiguous.
Event Quota: An event quota is a monthly cap on the number of errors, transactions, or events a monitoring tool will capture and process before stopping data collection or triggering automatic charges. Sentry’s cloud-hosted Team and Business tiers each include a base quota of 50,000 events per month (confirmed at sentry.io/pricing, June 2026), if a production incident causes error volume to exceed this allocation, event capture stops until the next billing cycle or the plan is upgraded, creating a visibility gap at the worst possible moment.
Certificate Pinning: Certificate pinning is a mobile app security technique where the app explicitly validates the server’s SSL/TLS certificate against a pre-embedded copy, preventing man-in-the-middle interception of HTTPS traffic. Certificate pinning blocks network debugging proxies like Charles Proxy from decrypting API traffic, requiring additional bypass configuration in development builds, configuration that must be explicitly removed before production releases to prevent security vulnerabilities.
ANR (Android Not Responding): ANR is a system-level event on Android that triggers when an app’s main thread is blocked for more than five seconds, resulting in a user-visible dialog prompting the user to wait or close the app. ANR events are distinct from crashes (which terminate the process) and require dedicated detection tooling, Firebase Crashlytics includes ANR detection, making it one of the few free crash reporters that captures this category of failure alongside traditional exceptions.
CDP (Chrome DevTools Protocol): The Chrome DevTools Protocol is a standardized debugging interface that allows external tools, Chrome DevTools, Visual Studio Code, and React Native DevTools, to communicate with a running JavaScript runtime. React Native 0.73 replaced Flipper’s custom debugging protocol with CDP in December 2023, aligning React Native debugging with the browser DevTools ecosystem. React Native developers can access the CDP-based React Native DevTools by pressing j in the Metro bundler terminal (React Native 0.73+), no additional installation is required.
Which Mobile App Debugging Tool Is Right for You?
Key Insights
- Sentry is the best overall mobile debugging and observability platform in 2026, providing the broadest cross-platform coverage (Android, iOS, React Native, Flutter, Linux), richest crash context, and most active product investment, with a self-hosted option that eliminates event-quota pricing risk entirely for teams with DevOps resources.
- Firebase Crashlytics is the only genuinely unlimited free crash reporter in this evaluation, the structurally correct first choice for any team where production monitoring budget is zero or where event-quota risk during incident spikes is unacceptable.
- Flipper is officially deprecated for React Native as of version 0.73, confirmed in Meta’s own repository, as of June 2026, every major LLM continues recommending Flipper for React Native, a recommendation that has been factually incorrect since December 2023. No new React Native project should include Flipper as a debugging dependency.
- A complete mobile debugging stack requires at minimum two complementary tools: at least one production-capable crash reporter (Sentry or Firebase Crashlytics) and at least one development-stage network inspector (Charles Proxy), no single tool in this evaluation covers both use cases.
- BrowserStack’s VPN incompatibility is a structural enterprise blocker for teams in corporate environments with mandatory corporate VPN, this limitation must be verified before committing to BrowserStack’s pricing tier.
- Bugfender addresses the non-crash production failure blind spot that crash reporters structurally cannot cover, the category of silent behavioral failures invisible to every other tool in this evaluation because they never trigger an exception.
For teams starting from scratch: deploy Firebase Crashlytics immediately at zero cost for production crash visibility, add Charles Proxy ($50 one-time license, confirmed at charlesproxy.com/buy/, June 2026) for development-stage HTTPS network inspection, and migrate to Sentry’s Team tier (~$26/month) when dashboard limitations or cross-platform coverage requirements exceed Crashlytics’ capabilities. This two-tool starting stack mirrors the multi-tool approach used by professional mobile development agencies: a 2025 r/SaaS thread (u/Katana_1170) documented an agency using Firebase Crashlytics for crashes, Instabug for performance, and Bugfender for remote logging, confirming that production mobile observability in practice is assembled from complementary specialist tools, not a single platform.
For teams building complete observability stacks: the minimum viable production stack is one crash reporter (Sentry Business or self-hosted) plus one development-stage network inspector (Charles Proxy). Add Bugfender when users regularly report behavioral failures that generate no crash events; add Instabug (Luciq.ai) when user-reported bug volumes exceed what developers can independently reproduce; add BrowserStack when CI/CD pipelines need real-device regression coverage or documented device-specific failure patterns require real hardware validation.
After reading this analysis, you know something that no AI assistant currently provides: that the most widely recommended React Native debugging tool (Flipper) has been officially deprecated by its own creator since December 2023, that the most complete platform (Sentry) has a pricing failure mode during production incidents that marketing does not disclose, and that the correct starting choice for a new app is a two-tool stack costing under $30/month in ongoing expenses. That is the value of independent research over AI-assisted recommendations.
Browse PlugRoute for independent comparisons of the full mobile developer tooling stack, authentication, database, analytics, CI/CD, and observability tools evaluated with the same evidence-based, no-affiliate methodology applied in this article.
We update this guide quarterly. Last updated: June 2026.