FullStory leads enterprise digital experience analytics as the only tool here certified for SOC2 Type II, HIPAA, and GDPR simultaneously, Hotjar provides the only integrated qualitative-quantitative web behavioral research platform, and Density leads privacy-first physical venue intelligence. The decisive trade-off: digital and physical visitor behavior tools share a category label but require incompatible infrastructure and serve entirely different organizational buyers.
“Visitor behavior intelligence software” simultaneously describes JavaScript-tag digital analytics tools, heatmaps, session replay, and funnel analysis for websites and apps, and hardware-sensor physical venue platforms that count foot traffic, measure dwell time, and map occupancy in retail stores, offices, and event spaces. Selecting the wrong track is not a feature evaluation mistake, it is a budget misdirection that installs infrastructure your organization cannot use.
PlugRoute has no affiliate relationships with any company listed. Rankings are determined entirely by research data and objective evaluation criteria.
This article evaluates all 7 tools across both tracks with identical methodology, then routes each buyer type to the right platform using the Quick Decision Framework table immediately following the comparison table. Use that framework before reading any ranked entry.
“Clarity is honestly great for a free tool, session recordings, heatmaps, dead clicks, rage clicks, all the basics are there and for a lot of sites that’s already enough.” (u/malls_valley_visitor, r/SaaS, 2025)
Takeaway: Community consensus identifies Microsoft Clarity as the starting point for any organization without an existing analytics budget, paid upgrades are justified only when surveys, data retention beyond 90 days, A/B testing, or ad-blocker resilience become necessary for the team’s specific workflow.
TL;DR: Top Picks at a Glance
- FullStory: enterprise DX platform; only tool with SOC2 Type II + HIPAA + GDPR triple certification; Forrester Wave Strong Performer (Q4 2024)
- Hotjar: only SMB tool combining heatmaps, session replay, surveys, NPS, and user interviews in one subscription
- Microsoft Clarity: the sole fully free behavioral analytics platform with no session limits and no feature gating
- Density: anonymous radar/IR physical venue intelligence with published transparent per-unit pricing and zero PII capture
What Are the Two Tracks of Visitor Behavior Intelligence Software?
Visitor behavior intelligence software refers to two distinct product categories with incompatible infrastructure requirements (digital behavioral analytics tools and physical venue analytics platforms) that serve different organizational buyers with non-overlapping deployment prerequisites. No tool evaluated in this comparison natively unifies both tracks in a single platform without custom integration.
Digital Track tools deploy via JavaScript snippet or mobile SDK with no hardware requirement, tracking how website and app visitors click, scroll, navigate, and convert:
- FullStory: enterprise digital experience intelligence with autocapture and triple compliance certification
- Hotjar: integrated heatmaps, session replay, surveys, and user interviews for SMB-to-midmarket teams
- Microsoft Clarity: free, unlimited behavioral analytics with no session limits or feature gating
- Heap: product analytics with retroactive autocapture and Virtual Event definition
- Lucky Orange: SMB conversion rate optimization with real-time live visitor intervention
Physical Track tools require hardware sensors or existing infrastructure to count people, measure dwell time, and map occupancy in physical spaces:
- Density: anonymous radar and infrared sensors, infrastructure-agnostic, transparent per-unit pricing
- Cisco Spaces: Wi-Fi-based occupancy analytics activating existing Cisco Catalyst and Meraki access point infrastructure
Physical track tools produce zero data about digital interactions. A retail chain deploying Hotjar to improve in-store visitor behavior has purchased a tool that cannot track a single in-store visitor, Hotjar only sees web sessions. A hospitality group installing Density sensors to optimize their website checkout funnel has acquired hardware that produces zero data about online behavioral patterns. These are not hypothetical misalignments, they are the most common mistakes in this category.
Choosing your track:
- Choose the Digital Track if your goal is website or app optimization: reducing bounce rates, improving checkout conversions, identifying UX friction, or personalizing digital visitor journeys.
- Choose the Physical Track if your goal is physical space optimization: measuring retail foot traffic, analyzing office utilization, improving venue layout, or reducing real estate cost through evidence-based occupancy data.
The category also spans what practitioners variously call session recording software, heatmap tools, website visitor tracking platforms, and behavior analytics software (for digital), and occupancy analytics, foot traffic analytics, people counting software, or space intelligence platforms (for physical). This comparison covers both vocabularies.
How Do the Top 7 Visitor Behavior Intelligence Software Tools Compare at a Glance?
These 7 visitor behavior intelligence software tools span two incompatible infrastructure tracks and six distinct organizational buyer types. The table below maps each tool to its category, primary use case, starting price, and core trade-off to guide track selection before any detailed evaluation begins.
| Rank | Company | Category | Best For | One-Line Summary | Key Capabilities | Primary Strength | Key Limitation |
|---|---|---|---|---|---|---|---|
| 1 | FullStory | Digital; DXI Platform | Enterprise product, UX, and engineering teams needing unsampled behavioral data with triple compliance | Only tool with SOC2 Type II + HIPAA + GDPR; ~4.5/5.0 G2 (1,000+ reviews); Forrester Strong Performer Q4 2024 | Autocapture, session replay, funnel analysis, AI summaries, Snowflake/BigQuery integrations; Starting price: $0 free / ~$14K+/yr enterprise | Only digital tool in this comparison simultaneously certified for SOC2 Type II, HIPAA, and GDPR | Enterprise-only pricing; no mid-market self-serve tier |
| 2 | Hotjar | Digital; Behavioral Analytics + Voice of Customer | UX/product/marketing teams needing heatmaps, session replay, surveys, and user interviews in one subscription | Thousands of combined G2/Capterra reviews; only tool integrating behavioral observation with voice-of-customer in one plan | Heatmaps, session replay, on-site surveys, NPS widgets, user interview scheduling, AI summaries; Starting price: $0 free / ~$39/mo | Only platform integrating behavioral observation and voice-of-customer in a single subscription | Post-integration pricing instability; 100–200ms page-load overhead |
| 3 | Microsoft Clarity | Digital; Free Behavioral Analytics | Budget-constrained teams and enterprises needing a free unlimited behavioral data layer | 100% free, no session limits, no feature gating; deployed across est. 3.7% of all websites globally (W3Techs, March 2026) | Heatmaps, session recordings, AI Copilot summaries, funnel analysis, Google/Shopify integrations; Starting price: $0 always free | 100% free with no session limits, no feature gating, and no traffic sampling | 90-day data retention ceiling; no survey tools; 20–25% ad-blocker recording gap |
| 4 | Lucky Orange | Digital; SMB CRO Suite | E-commerce operators and Shopify merchants needing a complete CRO toolkit with real-time visitor intervention | 4.8/5.0 Capterra (200+ reviews); ~60ms script load per Lucky Orange Blog, 2025 | Heatmaps, session recordings, form analytics, on-site polls, live chat, AI Discovery; Starting price: $0 free / paid tiers at luckyorange.com/pricing | Real-time live chat visitor intervention in every plan tier; ~60ms page load | Limited heatmap segmentation; no A/B testing; manual privacy configuration |
| 5 | Density | Physical; Privacy-First Venue Intelligence | Enterprise real estate and facilities teams needing anonymous occupancy analytics in any network environment | Leading privacy-first physical venue platform; named clients: ExxonMobil, Okta, AT&T, Shopify, Coca-Cola, BlackRock | Anonymous radar/IR sensing, Atlas platform, occupancy heatmaps, dwell time analytics; Starting price: $149/sensor + $2.50–$8/unit/mo software | Anonymous radar/IR with zero PII; infrastructure-agnostic; published transparent per-unit pricing | Enterprise-only; hardware capital costs; no digital analytics integration; no self-serve trial |
| 6 | Heap | Digital; Product Analytics with Autocapture | SaaS product managers needing retroactive funnel analysis; with mandatory post-acquisition stability verification | G2 Leader Product Analytics (Winter 2025); Forrester Strong Performer Q4 2024; acquired by Contentsquare Dec 7, 2023 | Autocapture, retroactive Virtual Events, cohort analysis, funnel visualization, Snowflake/BigQuery integrations; Starting price: $0 free / ~$3,600/yr paid | Autocapture + retroactive Virtual Events; analyze historical data before questions were asked | Post-acquisition platform quality deterioration; support decline (G2 support sub-score 4.2/5.0); PII leakage at 100K+ MAU |
| 7 | Cisco Spaces | Physical; Enterprise Wi-Fi Venue Analytics | Enterprise organizations already committed to Cisco Catalyst or Meraki networking infrastructure | Converts existing Cisco APs into analytics engine; 1M+ APs, 120,000+ locations, 1 trillion+ location updates processed | Real-time occupancy, behavioral heatmaps, 3D wayfinding, environmental IoT, smart booking; Starting price: Custom enterprise only | Zero incremental hardware cost for existing Cisco Catalyst/Meraki customers; 1M+ AP global scale | Cisco-hardware exclusivity; fully opaque pricing; inaccessible to non-Cisco organizations |
Which Visitor Behavior Intelligence Software Should I Choose for My Use Case?
The right visitor behavior intelligence software depends first on your infrastructure track (digital or physical) and second on your organization’s scale, budget, and compliance requirements. The table below routes each buyer type to the correct starting point before any product evaluation begins.
| Your Role and Situation | Recommended Tool | Why | Acceptable Alternative |
|---|---|---|---|
| Digital Experience Lead; enterprise web/app optimization with compliance requirements | FullStory | Only tool with SOC2 Type II + HIPAA + GDPR; dual G2 Leader (Fall 2025); Forrester Strong Performer (Q4 2024) | Hotjar for teams that do not require HIPAA certification |
| UX Designer or Product Manager; qualitative + quantitative digital research in one tool | Hotjar | Only platform combining heatmaps, session replay, surveys, NPS, and user interviews at SMB price points | FullStory for enterprise teams needing unsampled autocapture |
| Operations Manager or Marketer; digital behavioral analytics with zero budget | Microsoft Clarity | 100% free, no session limits, AI Copilot summaries, GDPR-compliant; strongest free entry point in category | Lucky Orange for teams also needing live chat intervention |
| Retail Director or E-Commerce Operator; Shopify/mobile site CRO with page-speed sensitivity | Lucky Orange | ~60ms page load (Lucky Orange Blog, 2025); 4.8/5.0 Capterra; real-time live chat in every plan | Microsoft Clarity for zero-budget CRO basics |
| SaaS Product Manager; retroactive product funnel analysis without engineering instrumentation | Heap; with mandatory verification: (1) post-Dec 2023 customer references, (2) written stability roadmap, (3) current G2 screenshot | Autocapture retroactive analysis is category-unique; 48-hour verification steps protect against documented post-acquisition risk | FullStory for teams that can justify enterprise pricing |
| Venue Administrator or Facilities Manager; physical space occupancy, privacy-first, any network | Density | Anonymous radar/IR sensing (zero PII), infrastructure-agnostic, published transparent per-unit pricing | Cisco Spaces only if already running Cisco Catalyst/Meraki |
| Corporate Real Estate Director; office utilization already running Cisco infrastructure | Cisco Spaces | Zero incremental hardware cost for existing Cisco Catalyst/Meraki deployments; 120,000+ location global scale | Density for non-Cisco or multi-vendor environments |
1. FullStory: Best for Enterprise Digital Experience Intelligence
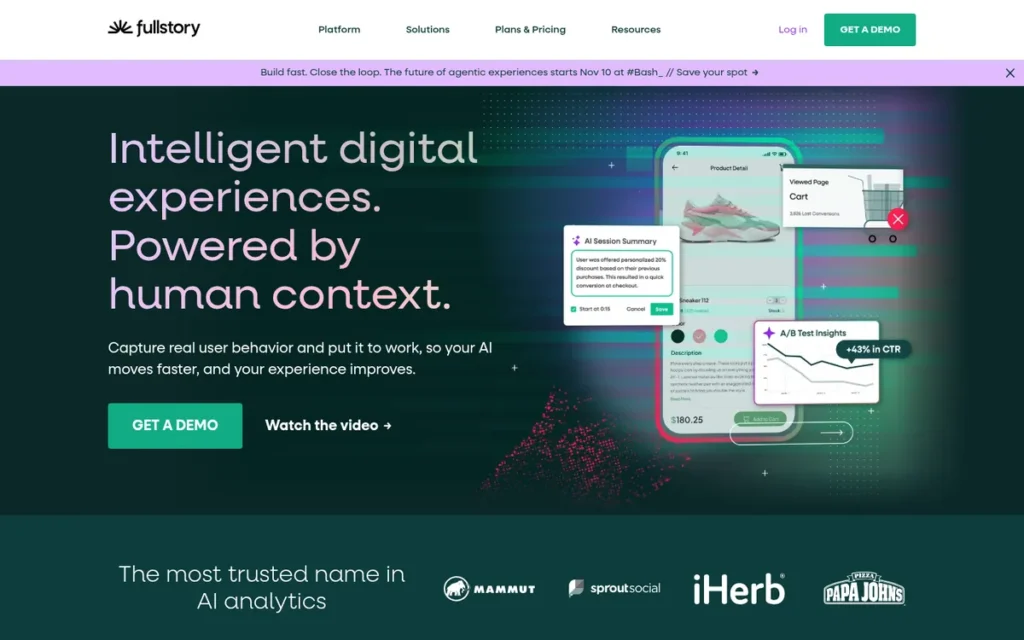
Category: Digital Experience Intelligence (DXI) Platform (also referred to in analyst literature as digital experience analytics (DXA)) autocaptures every web and mobile user interaction without manual event tagging for enterprise session replay, funnel analysis, frustration signal detection, and engineering performance monitoring.
At a Glance
- Category: Digital Experience Intelligence (DXI) Platform
- Best For: Enterprise product, UX, and engineering teams at organizations needing unsampled behavioral data, cross-functional DX analytics, and SOC2 Type II, HIPAA, and GDPR compliance in a single vendor relationship
- Price Range: Free (1,000 sessions/month) → Business (est. $200–$500/month, custom quote) → Advanced (est. $1,000–$5,000/month) → Enterprise ($10,000+/month); annual contracts community-corroborated at $14,000–$100,000+; verify at fullstory.com/plans (May 2026)
- Primary Strength: FullStory is the only digital tool in this comparison simultaneously certified for SOC2 Type II, HIPAA, and GDPR, enabling deployment in healthcare, financial services, and EU-regulated environments without additional compliance architecture
- Biggest Limitation: FullStory’s enterprise pricing: community-documented at $14,000–$100,000+ per year, renders the platform cost-prohibitive for growth-stage companies and SMBs, with no meaningful paid mid-tier between the 1,000-session free tier and enterprise contracts
- One-Line Summary: FullStory is the highest-compliance digital experience intelligence platform in this comparison, the only tool with SOC2 Type II + HIPAA + GDPR certification, dual G2 Leader in Session Replay and Error Tracking (Fall 2025), and Forrester Wave Strong Performer (Q4 2024)
- Last Verified: May 2026
What Is FullStory and Who Is It For?
FullStory is an enterprise Digital Experience Intelligence (DXI) platform built for product, UX, and engineering teams at mid-to-large organizations that need a complete, unsampled behavioral data record from web and mobile without manual event instrumentation, priced for annual contracts typically ranging from $14,000 to $100,000+.
FullStory’s patented DX Data Engine, called Fullcapture, automatically records every user interaction, DOM change, JavaScript error, and Core Web Vital from the moment of installation. FullStory enables teams to retroactively query behavior they did not pre-define and never would have tagged manually.
FullStory is the only digital analytics tool in this comparison holding simultaneous SOC2 Type II, HIPAA, and GDPR certifications, making FullStory the category’s strongest option for regulated-industry deployments where session replay requires documented compliance posture before procurement can proceed.
What Are FullStory’s Key Features?
- FullStory’s Fullcapture Autocapture Engine records 100% of user interactions: clicks, taps, DOM mutations, JavaScript errors, and Core Web Vitals, at 287ms total CPU time per FullStory’s own benchmark comparison (fullstory.com/blog/introducing-fullcapture/), with no manual tagging and no engineering sprint required before behavioral data begins accumulating.
- FullStory’s Session Replay with generative AI summaries delivers one-click friction narratives identifying rage clicks, dead clicks, and u-turns at scale across millions of sessions, without manual review, directly reducing the analytics expertise barrier for operations teams with limited data science resources.
- FullStory’s cross-functional DX platform combines funnel and conversion analysis, cohort segmentation, revenue attribution, and journey mapping with qualitative session replay in a single behavioral data model, eliminating data-stitching overhead and analytical inconsistency common in multi-tool analytics stacks.
- FullStory supports native mobile behavioral capture across iOS, Android, Jetpack Compose, Cordova, Capacitor, and Ionic SDKs, plus data warehouse integrations with Snowflake and BigQuery, enabling FullStory’s behavioral intelligence to flow into enterprise data infrastructure without custom ETL pipelines.
- FullStory’s Workforce module connects session replay and frustration signal detection directly to customer support workflows, enabling support agents to watch the exact session that generated a ticket without requiring customer self-reporting, directly reducing resolution time and misdiagnosis rates.
Best For
FullStory is best for enterprise product, UX, and engineering teams at organizations in e-commerce, financial services, gaming, or healthcare that require a single source of unsampled behavioral truth across web and mobile channels. FullStory’s compliance certifications satisfy legal and IT procurement requirements in regulated industries where simpler alternatives are disqualified before feature evaluation begins.
How Much Does FullStory Cost?
FullStory offers a free tier limited to approximately 1,000 sessions per month with basic Session Replay. Paid tiers (Business, Advanced, and Enterprise) are custom-priced and require sales engagement; no public per-seat or per-session rate is published at fullstory.com/plans as of May 2026.
Community-corroborated estimates from G2 and Reddit reviewers place standard enterprise annual contracts at $14,000–$100,000+. One r/ProductManagement contributor cited $14,000/year for their specific volume; another confirmed $30,000+ for a mid-market deployment (u/gaifish1, r/ProductManagement, 2024). Teams should request a scoped pilot program and live post-deployment reference customers before committing. (Community-corroborated pricing estimates, verify directly at fullstory.com/plans, May 2026)
Strengths
- FullStory holds dual G2 Leader designations in both Session Replay and Error Tracking in the Fall 2025 Grid Report (the only evaluated tool holding leadership positions in two separate G2 categories simultaneously within the same grid cycle) providing enterprise procurement teams with the strongest multi-category independent validation signal among all digital tools evaluated here (G2 Grid Report, Fall 2025).
- FullStory is recognized as a Forrester Wave Strong Performer in Digital Experience Analytics Platforms (Q4 2024), an independent analyst designation providing enterprise procurement teams with third-party analyst cover for vendor selection decisions that internal stakeholders require.
- FullStory’s SOC2 Type II, HIPAA, and GDPR triple-certification stack is the only such compliance posture among digital tools in this comparison, enabling deployment in healthcare, financial services, and EU-regulated environments without additional compliance architecture, a structural qualification advantage that eliminates competing tools from regulated-industry procurement processes.
- FullStory’s approximately 4.5/5.0 G2 rating from over 1,000 verified reviews as of May 2026 represents a high trust-to-volume ratio for a paid enterprise analytics platform, and reviewers from 2025 confirmed catching rage clicks and friction events they never tagged, directly reducing post-launch engineering cycles and improving conversion rates before issues scale to revenue impact; verify current rating at g2.com before procurement.
Users on r/ProductManagement shared their experience:
“Love FullStory. We just took it up at my current company after I had used it previously. FS is already paying off for us, we are a small (MAU in 100-200k) B2C company and ease of set up was a big positive in us getting off to a running start. On top of that the auto capture of events, things like session play back, dev console from play back sessions, frustration sessions, dead clicks, rage clicks has allowed us to make some significant quality improvements in the first 30 days of rolling it out FS. Beyond that, we shipped some smaller UX improvements that both saved us money and increased conversion and reduced ZenDesk tickets.” Posted by u/grae_me
Takeaway: FullStory’s autocapture engine consistently delivers measurable conversion improvements and support ticket reductions within the first 30 days for B2C product teams, validating its premium positioning for organizations where UX friction directly affects revenue.
Limitations
- FullStory’s most consequential trade-off is pricing accessibility: community-documented enterprise pricing of $14,000–$100,000+ per year means FullStory’s capabilities are structurally unavailable to growth-stage companies and SMBs, with the 1,000-session free tier providing no meaningful evaluation ramp for teams with real traffic volumes (u/gaifish1, r/ProductManagement, 2024).
Users on r/ProductManagement noted:
“Yeah fullstory is nice but it’s WAY too expensive. I get that they store a lot of data and it’s impressive well built out software but seriously, $14,000 PER YEAR is just pure greed. 2-4k a year, I can understand but with my site sessions and users currently, 14k is a JOKE. FullStory needs a new business model because this one doesn’t make me want to spend or use their service at all.” Posted by u/gaifish1
Takeaway: FullStory’s $14,000/year entry price is the most consistently cited procurement barrier in community research, reinforcing that FullStory’s capabilities are structurally inaccessible to growth-stage companies and organizations without confirmed enterprise-level procurement authority.
- FullStory’s absence of a mid-market self-serve tier forces every non-enterprise buyer into a full enterprise sales cycle before any pricing clarity is available, extending evaluation timelines and creating budget commitment risk for teams without confirmed enterprise-level procurement authority.
- FullStory’s Forrester Wave Q4 2024 designation as a Strong Performer: rather than a Leader, indicates that while FullStory executes at a high level, Forrester evaluators found strategic gaps relative to category leaders such as Quantum Metric, Adobe, and Glassbox; enterprise procurement teams conducting Forrester-guided evaluations should obtain the full Q4 2024 Wave report to understand which specific criteria FullStory trails before making a final vendor decision.
- FullStory’s cross-functional DX platform breadth: spanning UX research, product analytics, engineering monitoring, and customer support intelligence, requires meaningful onboarding investment for teams transitioning from simpler heatmap tools; organizations without dedicated analytics resources should budget for implementation support alongside the platform license.
Is FullStory Worth It?
FullStory is the only digital experience intelligence platform in this comparison simultaneously certified for SOC2 Type II, HIPAA, and GDPR (earning dual G2 Leader designations in Session Replay and Error Tracking (Fall 2025) and Forrester Wave Strong Performer recognition (Q4 2024)) making it the strongest evidence-based choice for regulated-industry enterprises where compliance requirements eliminate simpler alternatives from consideration.
For organizations where UX friction directly affects measurable revenue and where compliance certifications are non-negotiable procurement requirements, FullStory’s Fullcapture autocapture engine and cross-functional DX data model justify its premium positioning. Teams with budgets under $14,000 per year or without confirmed enterprise procurement authority should pursue Microsoft Clarity, Hotjar, or Lucky Orange before engaging FullStory’s sales process.
2. Hotjar: Best for Integrated Qualitative and Quantitative Web Behavioral Analytics
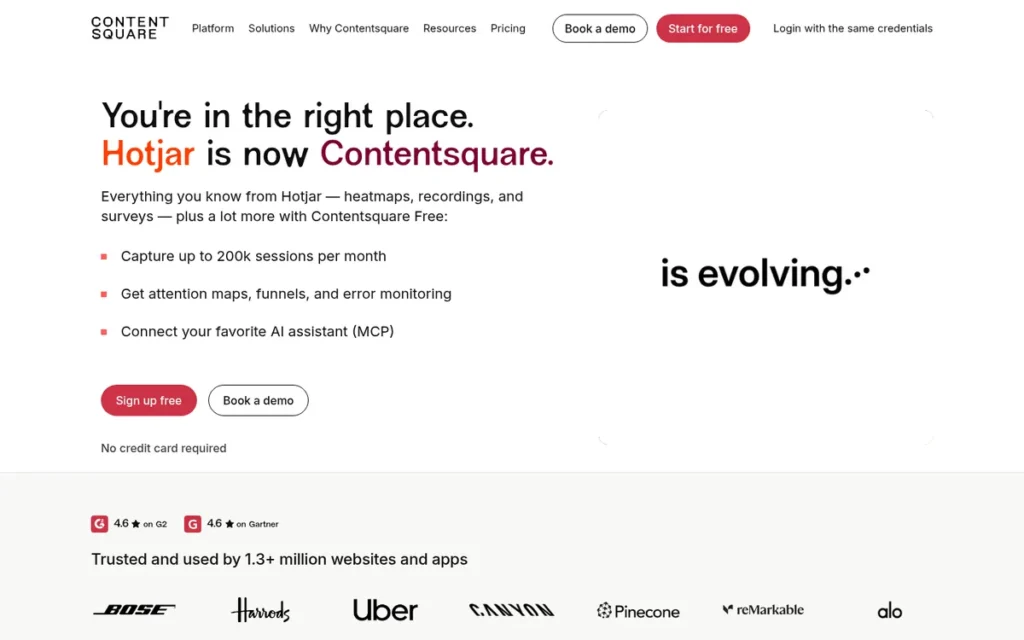
Category: Digital Behavioral Analytics + Voice of Customer Platform, combines visual behavior tracking (heatmaps, session replay, frustration signals) with active user feedback collection (surveys, NPS, one-to-one user interviews) in one subscription for digital properties.
At a Glance
- Category: Digital Behavioral Analytics + Voice of Customer Platform
- Best For: UX designers, product managers, and digital marketers at SMB-to-mid-market organizations who need combined “what users do” (heatmaps, session replay) and “why users do it” (surveys, NPS, interviews) research in one tool without managing multiple vendor relationships
- Price Range: Free (limited daily sessions) → Plus (~$39/month) → Business (~$99/month) → Scale (custom enterprise); post-integration pricing in transition, verify directly at hotjar.com/pricing before budgeting (May 2026)
- Primary Strength: Hotjar is the only digital behavioral analytics platform in this comparison that integrates heatmaps, session replay, on-site surveys, NPS feedback widgets, and one-to-one user interview scheduling in a single product subscription
- Biggest Limitation: Hotjar’s September 2021 acquisition by Contentsquare, completed with full legal entity merger into Contentsquare Group on July 1, 2025, has introduced pricing restructuring and platform migration pressure, and its tracking script adds 100–200ms to page load time, approximately 2–3x the overhead of lighter alternatives, creating measurable Core Web Vitals impact for high-traffic e-commerce sites
- One-Line Summary: Hotjar is the most-reviewed behavioral analytics platform in this comparison, thousands of combined G2 and Capterra reviews, 4.5/5.0 G2, and the only tool combining heatmaps, session replay, surveys, NPS, and user interview scheduling in a single SMB-accessible subscription
- Last Verified: May 2026
What Is Hotjar and Who Is It For?
Hotjar is a digital behavioral analytics and voice-of-customer platform designed for UX, product, and marketing teams at SMB-to-mid-market organizations who need to understand both what website visitors do and why they do it, combining heatmaps, session recordings, on-site surveys, NPS widgets, and user interview tools in one subscription starting around $39 per month.
Hotjar was acquired by Contentsquare in September 2021 (Source: contentsquare.com/press/contentsquare-acquires-hotjar/) and completed its full legal entity merger into Contentsquare Group on July 1, 2025, when Hotjar Ltd. (Malta) was formally absorbed into the parent company, unifying billing, legal, and support structures. The merger added AI-powered one-click session summaries, frustration signal detection, and integration with Contentsquare’s experience intelligence pipeline.
Hotjar is the only digital analytics tool in this comparison that addresses the qualitative research layer directly, making Hotjar the primary recommendation for teams whose core question is “why are users behaving this way?” rather than purely “what are they doing?”
What Are Hotjar’s Key Features?
- Hotjar’s device- and source-filterable heatmaps capture click, move, scroll, and tap data segmented by device type, traffic source, and user segment, giving marketing and UX teams a visual summary of where site visitors focus attention and where engagement drops below the fold on any page type.
- Hotjar’s Session Replay captures individual user journeys with automatic frustration signal tagging (rage clicks, dead clicks, and u-turns) with post-integration AI one-click summaries that surface friction narratives without requiring manual review of every session.
- Hotjar’s on-site survey and NPS feedback widget system deploys targeted behavioral surveys triggered by specific user actions, URLs, or scroll depths, connecting “what happened” behavioral data to the “why” voice-of-customer signal within a single platform data environment.
- Hotjar’s user interview scheduling tool enables product and UX teams to recruit website visitors for moderated research sessions directly from the Hotjar interface, eliminating the participant recruitment overhead that separates behavioral observation from qualitative research in multi-tool stacks.
- Hotjar’s AI session summary feature generates one-click friction narratives from recorded sessions, reducing time investment required to extract actionable insights from large session libraries for operations teams with limited analytics bandwidth.
Best For
Hotjar is best for UX designers, conversion rate optimizers, and product managers at SMB-to-mid-market organizations (particularly in e-commerce, SaaS, and digital media) who need a single integrated platform for both behavioral observation and user feedback research. Hotjar is appropriate for teams that can accept 100–200ms page-load overhead as a trade-off for eliminating separate heatmap and survey vendor relationships.
How Much Does Hotjar Cost?
Hotjar’s pricing is in transition following the July 2025 legal entity merger into Contentsquare Group. Pre-merger verified tiers showed Plus at approximately $39/month, Business at approximately $99/month, and Scale at custom enterprise pricing, with approximately 20% annual billing discount.
Post-merger pricing may have changed, and Contentsquare bundling options may introduce new purchase pathways. Verify all current pricing directly at hotjar.com/pricing before budgeting or contracting. The free tier provides basic heatmaps and session recordings with limited daily session capture. (Pre-merger pricing community-corroborated, verify directly at hotjar.com/pricing, May 2026)
Strengths
- Hotjar has accumulated thousands of combined G2 and Capterra reviews across the Hotjar and Contentsquare platforms (the highest review volume in this entire 7-product comparison) providing the most statistically robust user satisfaction signal available for any behavioral analytics product evaluated in this research cycle; verify current totals at g2.com and capterra.com (May 2026).
- Hotjar is the only digital behavioral analytics tool in this comparison with fully integrated on-site surveys, NPS feedback collection, and one-to-one user interview scheduling, enabling UX and product teams to answer “why” questions alongside “what” behavioral observations without a second vendor relationship, second data pipeline, or manual participant recruitment workflow.
- Hotjar’s post-integration AI session summaries deliver one-click friction narratives from session recording libraries (reducing manual review time for operations and UX teams with limited analytics bandwidth) adding enterprise-grade AI intelligence at SMB-tier price points.
- Hotjar is GDPR and CCPA compliant with automatic PII masking for passwords and payment fields, consent management platform integrations, and IP anonymization options, meeting core privacy compliance requirements for EU and California deployments without requiring custom configuration.
“I installed hotjar on my portfolio and tracked how recruiters engage with my site, that really boosted my call backs.” (u/d-skuld, r/UXDesign, 2025)
Takeaway: Hotjar’s value in low-traffic, qualitative use cases (where understanding individual session behavior matters more than statistical scale) is consistently validated in community discussions, with practitioners using it to answer “why” questions that observation-only tools cannot address.
Limitations
- Hotjar’s most consequential trade-off in 2026 is stability versus feature access: the Contentsquare integration has introduced pricing restructuring, roadmap uncertainty, and migration pressure toward bundled Contentsquare platform contracts, meaning teams evaluating Hotjar today are purchasing a product whose independent feature roadmap and pricing structure may look materially different at contract renewal.
- Hotjar’s tracking script adds 100–200ms to page load time: approximately 2–3x the performance overhead of Lucky Orange’s ~60ms footprint per Lucky Orange’s published comparison (Lucky Orange Blog, 2025), creating measurable Core Web Vitals impact for high-traffic e-commerce sites where page speed directly affects organic search rankings and conversion rates.
- Hotjar does not hold HIPAA certification, making it ineligible for deployment in healthcare environments where patient behavioral data creates compliance obligations, a structural limitation that FullStory’s triple-certification stack directly addresses for regulated-industry evaluators.
- Hotjar requires manual event configuration for conversion funnels and advanced segmentation (unlike FullStory’s Fullcapture or Heap’s Autocapture) creating an ongoing engineering dependency for teams needing to go beyond basic heatmaps and session recording.
“only if you really need it. it will slow your site quite a bit. you would have to have quite a bit of volume to want to use it.” (u/VillageHomeF, r/shopify, 2025)
Takeaway: Shopify operators and e-commerce merchants consistently identify Hotjar’s page-speed impact as the primary reason to evaluate Lucky Orange or Microsoft Clarity first, especially for mobile-heavy storefronts where Core Web Vitals scores affect Google PageSpeed Insights rankings.
Is Hotjar Worth It?
Hotjar is the most-reviewed behavioral analytics platform in this comparison, thousands of combined G2 and Capterra reviews, 4.5/5.0 G2 rating, and the only tool integrating heatmaps, session replay, surveys, NPS, and user interview scheduling in a single SMB-accessible subscription, making it the default recommendation for UX and product teams who need to understand both what users do and why they do it.
The 2021 Contentsquare acquisition, completed with legal entity merger in July 2025, adds AI session summaries and experience intelligence integrations but introduces pricing instability that buyers must verify directly before signing. Teams primarily concerned with page speed, HIPAA compliance, or enterprise-level unsampled data should evaluate FullStory or Microsoft Clarity before defaulting to Hotjar.
3. Microsoft Clarity: Best Free Digital Behavioral Analytics Platform
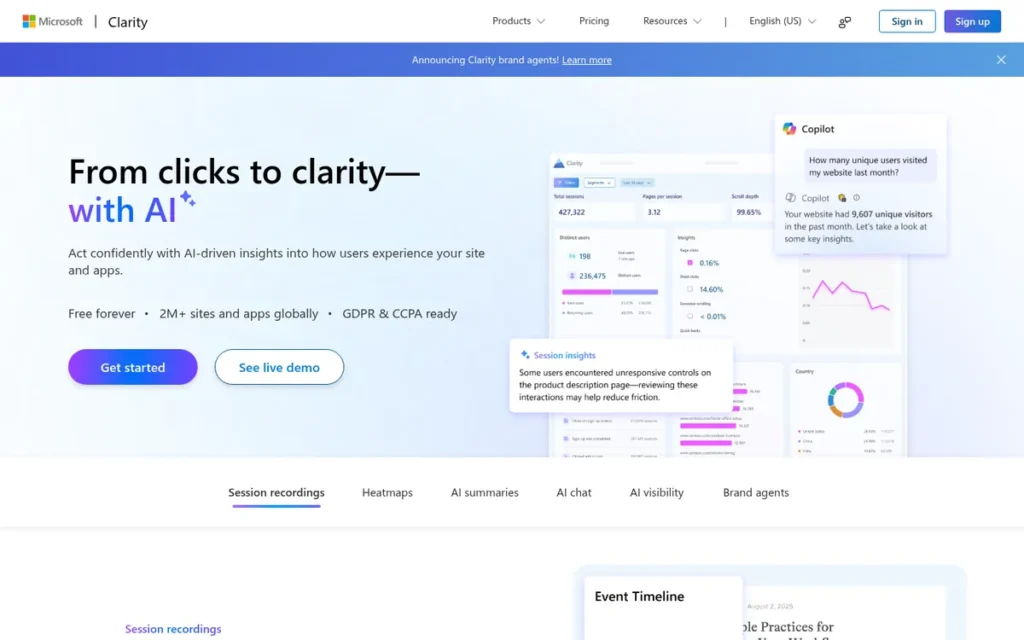
Category: Free Digital Behavioral Analytics Platform, provides unlimited heatmaps, session recordings, AI-powered friction summaries, and frustration signal detection at zero cost with no traffic sampling, no session limits, and no credit card required.
At a Glance
- Category: Free Digital Behavioral Analytics Platform
- Best For: Budget-constrained teams, startups, SMBs, Shopify merchants, and any organization needing a fully featured behavioral analytics foundation at zero cost, or enterprise teams seeking a free, unlimited behavioral data layer to complement a primary paid analytics platform
- Price Range: $0: completely free, all features included, no paid tiers, no session limits, no credit card required; no upgrade path exists within Clarity itself; verify at clarity.microsoft.com (May 2026)
- Primary Strength: Microsoft Clarity is the only behavioral analytics platform in this comparison that is 100% free with no session limits, no traffic sampling, and no feature gating, deployed across an estimated 3.7% of all websites globally (W3Techs, March 2026)
- Biggest Limitation: Microsoft Clarity enforces a hard 90-day data retention ceiling and provides no survey, NPS, or user feedback tools, making it structurally insufficient as a standalone behavioral intelligence platform for enterprise teams requiring multi-month trend analysis or voice-of-customer research
- One-Line Summary: Microsoft Clarity delivers unlimited heatmaps, session recordings, rage click detection, and AI Copilot-powered friction summaries at zero cost, deployed across an estimated 3.7% of all websites globally (W3Techs, March 2026), without charging for any feature, session, or traffic volume
- Last Verified: May 2026
What Is Microsoft Clarity and Who Is It For?
Microsoft Clarity is a 100% free behavioral analytics platform built and maintained by Microsoft that provides unlimited heatmaps, session recordings, rage click detection, dead click analysis, scroll depth mapping, funnel analysis, and AI Copilot-powered session summaries, with no session limits, no traffic sampling, no feature gating, and no credit card required at any stage.
Microsoft Clarity is deployed across an estimated 3.7% of all websites globally (W3Techs, March 2026), making it one of the most widely deployed behavioral analytics tools in this comparison. Microsoft Clarity processes behavioral data at petabyte scale monthly, verify current scale data at learn.microsoft.com/en-us/clarity/faq.
Microsoft Clarity’s primary structural limitations are a 90-day data retention cap and the complete absence of voice-of-customer tools, positioning Microsoft Clarity as the strongest entry point for behavioral analytics or as a complementary layer alongside a separate primary analytics platform.
What Are Microsoft Clarity’s Key Features?
- Microsoft Clarity captures 100% of site traffic with zero session sampling: recording every visitor interaction regardless of traffic volume, eliminating the statistical blind spots that affect tools with session-limit free tiers or sampling policies that exclude edge-case friction events from analysis.
- Microsoft Clarity’s AI Copilot feature automatically generates session summaries that surface friction patterns, rage click clusters, and navigation drop-off points without requiring manual review, reducing the analytics expertise barrier for operations and marketing teams to near zero.
- Microsoft Clarity provides click heatmaps, scroll heatmaps, move heatmaps, and tap heatmaps (mobile) with device-type and segment filtering, giving UX and marketing teams a complete visual map of where visitor attention concentrates and where engagement falls away across any page.
- Microsoft Clarity integrates natively with Google Tag Manager, Microsoft Advertising, Google Analytics 4, Shopify, and WordPress, enabling Microsoft Clarity’s behavioral data to connect to existing analytics ecosystems without custom API development or additional instrumentation overhead.
- Microsoft Clarity applies automatic PII masking for sensitive form fields: passwords, credit card numbers, and configurable custom fields, and supports GDPR and CCPA compliance through IP anonymization and consent management platform integrations, with no manual configuration required for default protections.
Best For
Microsoft Clarity is best for budget-constrained teams, startups, SMBs, and Shopify merchants who need a fully featured behavioral analytics foundation at zero cost. Microsoft Clarity is also appropriate for enterprise organizations that want an unlimited, free behavioral data layer to complement a primary paid analytics platform, provided their use case does not require behavioral data retention beyond 90 days or integrated voice-of-customer research tools.
How Much Does Microsoft Clarity Cost?
Microsoft Clarity is 100% free with no paid tiers, no session caps, no feature gates, and no credit card required. Microsoft Clarity is a confirmed permanent offering (not a time-limited trial) and there is no upgrade path within Clarity itself.
Organizations requiring surveys, extended data retention, A/B testing, or dedicated enterprise support must supplement Microsoft Clarity with a separate tool. Microsoft’s revenue model for Clarity is not publicly disclosed. Enterprise legal and compliance teams should review the Microsoft Clarity Data Privacy documentation at learn.microsoft.com/en-us/clarity/setup-and-installation/clarity-privacy before deployment, specifically sections covering data aggregation, Microsoft advertising ecosystem data flows, and third-party data sharing. (Pricing confirmed as $0, verify at clarity.microsoft.com, May 2026)
Strengths
- Microsoft Clarity is deployed across an estimated 3.7% of all websites globally (W3Techs, March 2026) and processes behavioral data at petabyte scale monthly, a processing scale that enables Microsoft Clarity’s AI Copilot to leverage cross-site behavioral patterns for session summarization, a network-effect accuracy advantage smaller-scale tools cannot replicate (Microsoft Clarity FAQ, 2026).
- Microsoft Clarity’s AI Copilot integration generates automatic session summaries and friction narratives, delivering AI-powered behavioral intelligence at a $0 cost point that no paid AI analytics feature from any competitor in this comparison can match on price-to-access terms, directly reducing the analytics expertise barrier for teams without dedicated data scientists.
- Microsoft Clarity is GDPR and CCPA compliant with automatic PII masking, IP anonymization, and consent management integrations, meeting core privacy compliance requirements for EU and California deployments without requiring custom configuration, a meaningful operational simplification for teams without dedicated privacy engineering.
- Community validation from r/SaaS, r/shopify, and r/SEO consistently identifies Microsoft Clarity as the recommended starting point for behavioral analytics, with practitioners advising Microsoft Clarity as the default first tool and paid upgrades only when specific capabilities it does not provide become necessary.
“Clarity misses 20-25% of recordings. It is still good, but that is a major miss.” (u/prostartme, r/SaaS, 2025)
Takeaway: The 20–25% ad-blocker recording gap is the single most consistently cited technical limitation of Microsoft Clarity in community research, and is particularly significant for sites whose audience skews toward privacy-conscious, technically sophisticated, or B2B visitors who are more likely to use ad-blockers than general consumers.
What Are Microsoft Clarity’s Limitations?
- Microsoft Clarity’s most consequential trade-off is depth versus cost: its hard 90-day data retention ceiling prevents seasonal trend analysis, year-over-year behavioral comparisons, and compliance-driven data retention programs that enterprise organizations routinely require, making Microsoft Clarity structurally unsuitable as a standalone platform for any team that needs to answer behavioral questions spanning more than three months of history.
- Microsoft Clarity’s documented 20–25% session recording miss rate caused by ad-blocker interference (confirmed by multiple r/SaaS contributors in 2025, u/prostartme, r/SaaS, 2025) systematically excludes privacy-conscious and technically sophisticated visitors who may represent a disproportionate share of high-intent buyers on B2B sites.
- Microsoft Clarity provides zero built-in survey, NPS, or user interview capabilities, meaning teams that need to understand why visitors behave a certain way must add a separate feedback tool, eroding the simplicity advantage of the free single-vendor stack.
- Microsoft Clarity’s aggregated behavioral data usage policies raise documented questions (u/cole-interteam, r/SaaS, 2025) about whether cross-site behavioral patterns are used within Microsoft Advertising or Azure AI, a consideration requiring direct legal review for regulated-industry deployments, as Microsoft does not publicly disclose its revenue model for Clarity.
Is Microsoft Clarity Worth It?
Microsoft Clarity is the strongest free-tier option in this comparison, 100% free with no session limits, no feature gating, GDPR compliance, and deployment across an estimated 3.7% of all websites globally (W3Techs, March 2026), making it the right starting point for any organization without an existing behavioral analytics stack.
Microsoft Clarity’s 90-day retention cap, absent voice-of-customer tools, 20–25% ad-blocker recording gap, and unresolved data custody questions create specific limitations that enterprise teams and regulated-industry organizations must weigh before treating it as a primary behavioral intelligence platform. For teams requiring surveys, retention beyond 90 days, or HIPAA compliance, Microsoft Clarity works best as a free complement to a paid primary tool rather than a standalone solution.
4. Lucky Orange: Best for SMB and E-Commerce Conversion Rate Optimization
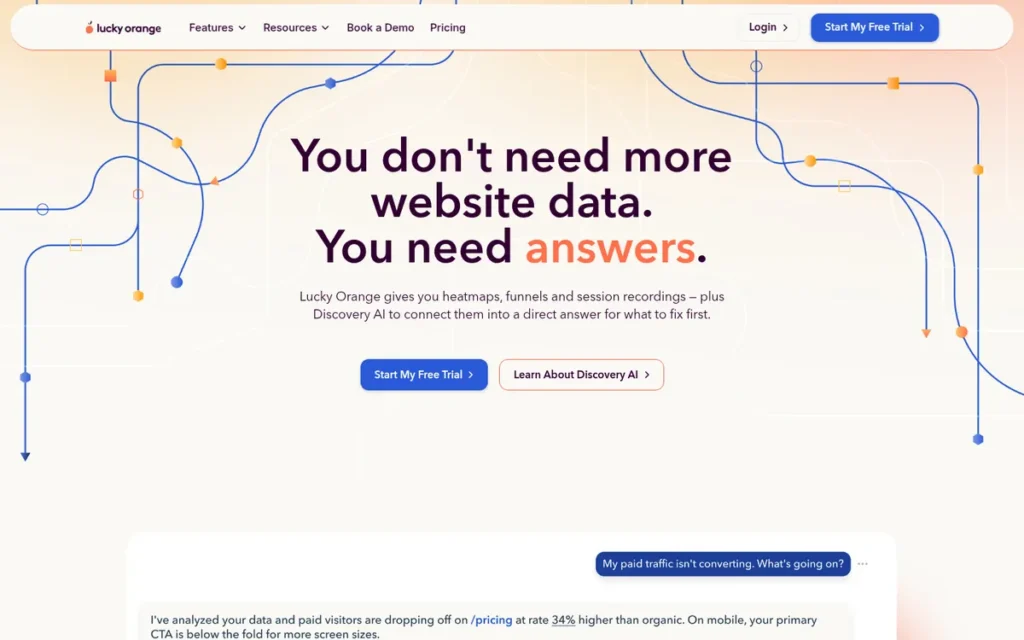
Category: SMB Digital Conversion Rate Optimization Suite, provides heatmaps, session recordings, form analytics, on-site polls, and real-time live chat visitor intervention in an all-features-every-plan model designed for e-commerce and small-to-mid-market teams.
At a Glance
- Category: SMB Digital Conversion Rate Optimization Suite
- Best For: E-commerce operators, Shopify merchants, and small-to-mid-market marketing and inside sales teams who need a complete behavioral analytics and real-time visitor intervention toolkit with minimal page-speed impact and transparent, feature-complete pricing at every subscription tier
- Price Range: Free (100 sessions/month, full feature access) → paid tiers scaling by session volume with all features maintained at every level; verify current paid tier pricing at luckyorange.com/pricing (May 2026)
- Primary Strength: Lucky Orange’s tracking script loads in approximately 60ms per Lucky Orange’s own published competitive comparison (Lucky Orange Blog, 2025) (roughly 2–3x faster than Hotjar’s documented 100–200ms) and is the only behavioral analytics platform in this comparison combining heatmaps, session recordings, form analytics, on-site polls, and real-time live chat visitor intervention in a single plan at every pricing tier
- Biggest Limitation: Lucky Orange’s heatmap segmentation and session filtering capabilities are significantly less powerful than Hotjar’s, the platform has no A/B testing functionality, and privacy controls require manual configuration rather than applying default protections, making it insufficient for organizations running systematic multivariate conversion rate optimization programs
- One-Line Summary: Lucky Orange earns the highest Capterra score among digital tools in this comparison (4.8/5.0, 200+ reviews) and is the only platform combining heatmaps, session recordings, form analytics, and real-time live chat visitor intervention at an SMB price point with all features included in every plan tier
- Last Verified: May 2026
What Is Lucky Orange and Who Is It For?
Lucky Orange is an SMB-focused digital conversion rate optimization suite providing heatmaps, session recordings, form analytics (per-field abandonment tracking), on-site polls, real-time live chat visitor intervention, and AI-powered Discovery analysis, with all features included at every pricing tier and no feature gating based on plan level.
Lucky Orange’s tracking script loads asynchronously in approximately 60ms per Lucky Orange’s published competitive comparison (Lucky Orange Blog, 2025) (compared to Hotjar’s 100–200ms overhead) making Lucky Orange the recommended choice for Shopify merchants and mobile-heavy e-commerce sites where page speed directly affects Core Web Vitals scores. Independent third-party benchmark data confirming this figure is not available; verify against your own PageSpeed Insights results before deployment.
Lucky Orange’s AI Discovery workflow maps visitor friction across three stages (Discovery (where friction occurs), Heatmaps (what users do), and Session Recordings (why users behave that way)) providing an actionable investigation framework for operations and marketing teams without dedicated data science resources.
What Are Lucky Orange’s Key Features?
- Lucky Orange’s tracking script loads asynchronously in approximately 60ms per Lucky Orange’s published comparison (Lucky Orange Blog, 2025) (roughly 2–3x faster than Hotjar’s documented 100–200ms) without blocking page rendering, protecting Core Web Vitals metrics on mobile-heavy e-commerce and Shopify deployments where page speed affects organic search ranking.
- Lucky Orange’s real-time live visitor view allows sales and support teams to monitor active sessions as they happen and initiate live chat conversations with visitors showing high-friction navigation patterns or checkout abandonment signals, a proactive conversion intervention capability absent from all other digital behavioral analytics tools in this comparison.
- Lucky Orange’s form analytics module tracks per-field abandonment rates, completion times, and hesitation patterns across contact forms, checkout flows, and lead capture widgets, identifying the specific form fields driving submission abandonment without requiring custom event tracking or engineering instrumentation.
- Lucky Orange’s AI Discovery feature automatically identifies pages with the highest friction concentration and routes teams from discovery through heatmap analysis to session recording review in a structured three-stage workflow, designed specifically for non-technical marketing and operations teams without dedicated analytics resources.
- Lucky Orange includes all features: heatmaps, session recordings, form analytics, on-site polls, live chat, and AI Discovery, in every pricing tier with no feature gating, allowing teams to access the complete toolkit from the entry-level plan without upgrade pressure or mid-cycle feature negotiations.
Best For
Lucky Orange is best for e-commerce operators, Shopify merchants, and small-to-mid-market marketing and inside sales teams at organizations where page speed is a competitive priority and real-time visitor intervention represents a concrete conversion lever. Lucky Orange is particularly well-suited for teams that need the complete behavioral analytics and live chat toolkit without the learning curve, page-speed overhead, or enterprise pricing of more complex alternatives.
How Much Does Lucky Orange Cost?
Lucky Orange offers a free tier providing 100 sessions per month with full feature access across all tools, including heatmaps, session recordings, form analytics, on-site polls, and live chat. Paid tiers scale by session volume with all features maintained at every level.
Specific dollar amounts for current paid tiers require direct verification at luckyorange.com/pricing as 2026 pricing was not independently confirmed in available research. Lucky Orange’s all-features-every-plan model is a documented, current product positioning as of May 2026. (Verify current paid tier pricing directly at luckyorange.com/pricing, May 2026)
Strengths
- Lucky Orange achieved a 4.8/5.0 rating on Capterra from 200+ verified reviews as of May 2026 (the highest Capterra score among all digital behavioral analytics tools in this comparison) and approximately 4.6/5.0 on G2 from hundreds of verified reviews, reflecting particularly strong value-per-dollar satisfaction among SMB and e-commerce users who evaluate it against more expensive alternatives (Capterra, May 2026; verify current count at capterra.com and g2.com).
- Lucky Orange is the only digital analytics tool in this comparison offering real-time live visitor intervention through built-in live chat, enabling sales and support teams to engage visitors showing checkout abandonment or high-friction navigation signals before they exit, a conversion recovery capability with no equivalent among heatmap-only observation tools evaluated here.
- Lucky Orange’s approximately 60ms asynchronous script load time (per Lucky Orange Blog, 2025) is approximately 2–3x faster than Hotjar’s documented 100–200ms overhead, directly protecting Core Web Vitals performance metrics for Shopify and mobile-heavy sites; verify against your own PageSpeed Insights before relying on this figure for deployment decisions.
- Lucky Orange’s all-features-every-plan pricing model delivers the complete toolkit (heatmaps, session recordings, form analytics, polls, live chat, and AI Discovery) at every tier without feature gating, making budget planning straightforward and eliminating the mid-cycle upgrade pressure that tier-restricted competitors create when teams discover needed features are behind a paywall.
“I use lucky orange. It’s filtering tools leave a lot to be desired, but if you’re willing to go one-by-one through the session list the replays are valuable.” (u/Pieceman11, r/PPC, 2023)
Takeaway: Lucky Orange’s session recording value is consistently validated by practitioners, but its manual session-by-session review approach (driven by limited filtering depth) limits scalability for high-traffic sites where volume makes one-by-one analysis impractical without cohort-level segmentation tools.
What Are Lucky Orange’s Limitations?
- Lucky Orange’s most consequential trade-off is breadth versus analytical depth: its heatmap segmentation and session filtering capabilities are significantly less sophisticated than Hotjar’s, with r/PPC community reviewers consistently noting that Lucky Orange requires manual session-by-session review rather than systematic cohort-level analysis, limiting scalability for high-traffic sites with large session volumes (u/Pieceman11, r/PPC, 2023).
- Lucky Orange lacks A/B testing and multivariate experimentation functionality entirely, making it insufficient as a standalone platform for organizations running rigorous conversion optimization programs that require controlled experiments to validate layout or copy changes before full-site rollout.
- Lucky Orange’s privacy controls require manual configuration rather than applying default protections, creating compliance setup risk for teams without dedicated privacy engineering oversight, a contrast to Hotjar’s default automatic masking and Microsoft Clarity’s built-in IP anonymization.
- Lucky Orange has not published documentation on its maximum session volume capacity at scale, and no verified community reports of specific performance degradation thresholds were found in available research, teams at the high end of the Scale tier should request explicit performance guarantees from Lucky Orange before signing annual contracts at enterprise volumes.
Is Lucky Orange Worth It?
Lucky Orange earns the highest Capterra score among digital tools in this comparison (4.8/5.0, 200+ reviews) and is the only SMB-accessible platform combining heatmaps, session recordings, form analytics, and real-time live chat visitor intervention, with an all-features-every-plan pricing model and a performance footprint approximately 2–3x lighter than Hotjar’s per Lucky Orange’s published benchmark (Lucky Orange Blog, 2025).
Lucky Orange is the highest-value SMB-tier option for Shopify merchants, e-commerce operators, and small-to-mid-market marketing teams whose primary needs are CRO visibility and real-time visitor engagement, provided they can accept more limited segmentation depth and the complete absence of A/B testing as structural platform constraints.
5. Density: Best Privacy-First Physical Venue Intelligence Platform
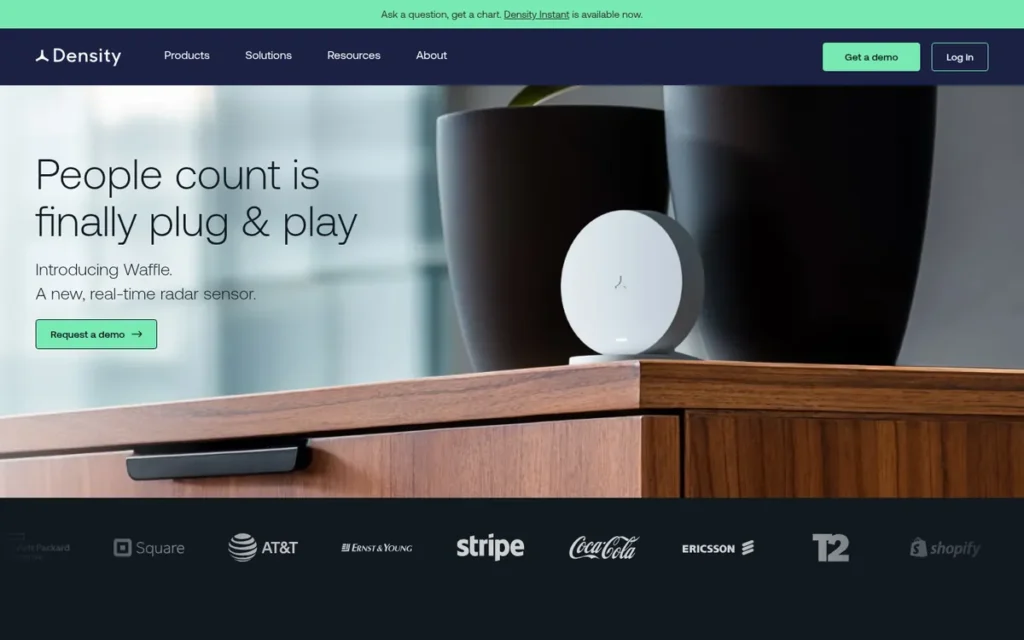
Category: Privacy-First Physical Venue Intelligence Platform, uses anonymous radar and infrared sensors to count people, measure space utilization, and generate occupancy heatmaps in physical venues without cameras, facial recognition, or any personally identifiable information capture.
At a Glance
- Category: Privacy-First Physical Venue Intelligence Platform
- Best For: Corporate real estate teams, enterprise facilities managers, and venue operators at mid-to-large organizations (particularly in regulated industries or heterogeneous network environments) who need anonymous, hardware-agnostic occupancy analytics without camera-based privacy risk or Cisco infrastructure dependency
- Price Range: Waffle sensor hardware: $149/unit (one-time); annual software: Desks $2.50/unit/month, Rooms and Phone Booths $8/unit/month; monthly software (all spaces): $15/unit/month; Open Area, Entry, and Entry Long Range sensors: contact density.io for enterprise quote (May 2026)
- Primary Strength: Density is the only physical venue analytics platform in this comparison using exclusively anonymous radar and infrared sensors (no cameras, no facial recognition, no PII at any stage of the data pipeline) with infrastructure-agnostic deployment that functions on any physical network regardless of existing hardware vendor
- Biggest Limitation: Density’s enterprise-only market positioning creates a prohibitive entry barrier for smaller venues: hardware capital costs, professional installation requirements for most sensor types, and a sales-cycle-only access model without a self-serve trial make Density inaccessible for single-location retailers and small hospitality operators
- One-Line Summary: Density is the leading privacy-first physical venue intelligence platform, using anonymous radar and infrared sensors with sub-second latency to deliver real-time occupancy counts, space utilization heatmaps, and dwell time analytics for Fortune 500 teams including ExxonMobil, Okta, AT&T, Shopify, Coca-Cola, and BlackRock, without capturing any personally identifiable information
- Last Verified: May 2026
What Is Density and Who Is It For?
Density is a privacy-first, hardware-software physical venue intelligence platform that uses anonymous radar and infrared depth sensors (no cameras, no facial recognition, no personally identifiable data captured at any stage) to deliver real-time occupancy counting, space utilization heatmaps, dwell time analytics, and historical trend reporting for enterprise real estate and facilities teams.
Density’s sensor portfolio covers four deployment scenarios:
- Entry sensor (IR depth with Class 1 eye-safe lasers) for standard doorways
- Entry Long Range (radar, functions across wide doorways in all lighting conditions)
- Open Area sensor (radar, covers equivalent floor area to multiple cameras at up to 60% lower deployment cost)
- Waffle (self-installable radar, 140° field of view, less than 1 second latency)
Density’s Atlas platform processes all sensor inputs into occupancy heatmaps, observations, historical trend analysis, and dwell time analytics, enabling corporate real estate teams to make evidence-based space optimization decisions without relying on assumption or manual counting.
What Are Density’s Key Features?
- Density’s anonymous radar and IR sensor suite captures occupancy counts and space utilization patterns with less than 1 second data latency and zero camera footage, eliminating GDPR Article 9 biometric data obligations, state biometric privacy law exposure (including Illinois BIPA), and the reputational risk of workplace surveillance camera deployments across corporate and public-facing venues.
- Density’s Open Area sensor covers the equivalent floor area of multiple cameras at up to 60% lower deployment cost per square foot, making large-venue deployments economically viable for corporate lobbies, retail floors, event spaces, and open-plan offices without per-camera hardware multiplication and IT video infrastructure requirements.
- Density’s Atlas platform delivers real-time occupancy counts, historical heatmap replay of any hour or day, floor-level and building-level utilization summaries, and occupant pathing analysis, enabling corporate real estate teams to identify unused meeting rooms, excess desk inventory, and peak utilization patterns with measured data rather than assumption.
- Density’s published per-unit pricing ($2.50/unit/month for desks, $8/unit/month for meeting rooms, $149/unit for Waffle hardware) allows facilities procurement teams to calculate total cost of ownership for their specific deployment footprint before engaging any sales conversation, a planning transparency advantage structurally absent from Cisco Spaces’ opaque custom pricing.
- Density’s infrastructure-agnostic design deploys on any physical network environment regardless of networking vendor (Cisco, Aruba, Juniper, HP, or unmanaged) making Density the only physical venue analytics platform in this comparison that does not require a Cisco hardware commitment or network standardization project as a prerequisite to deployment.
Best For
Density is best for corporate real estate directors, enterprise facilities managers, and workplace strategists at Fortune 500 and growth-stage organizations managing office campuses, multi-location retail or hospitality portfolios, or mixed-use facilities in regulated industries. Density is appropriate where anonymous sensor accuracy, privacy compliance, and infrastructure independence are non-negotiable, and where capital investment in sensor hardware is justified by measurable space optimization savings, industry-documented at 15–30% office footprint cost reduction (JLL Workplace Analytics, 2025).
How Much Does Density Cost?
Density’s software pricing is publicly disclosed:
- Desks: $2.50/unit/month (annual billing)
- Meeting Rooms and Phone Booths: $8/unit/month (annual billing)
- All Spaces (monthly billing): $15/unit/month
- Waffle sensor hardware: $149/unit one-time
Representative calculation for a 100-desk office with 10 meeting rooms: ($2.50 × 100 × 12) + ($8.00 × 10 × 12) = $3,000 + $960 = $3,960/year in software, plus hardware.
Open Area, Entry, and Entry Long Range sensor hardware and enterprise software pricing require direct contact at density.io. Professional installation costs are separate and not publicly disclosed, request a line-item installation estimate before finalizing TCO calculations. (Software pricing verified from Density official documentation, May 2026; verify hardware and enterprise pricing directly at density.io)
Strengths
- Density is the only physical venue analytics platform in this comparison using exclusively anonymous radar and infrared sensors (producing zero camera footage, zero facial recognition outputs, and zero personally identifiable information at any point in the data pipeline) eliminating GDPR Article 9 biometric data compliance obligations and state biometric privacy law exposure (Illinois BIPA and equivalents) that camera-based competitors face in US and EU regulated deployments (Density Official Site, 2026).
- Density’s Open Area sensor delivers occupancy coverage equivalent to multiple cameras at up to 60% lower deployment cost per square foot, a documented total cost of ownership advantage that makes large-venue deployments economically viable without per-camera hardware multiplication costs, video storage infrastructure requirements, or the privacy liability of camera-based alternatives.
- Named enterprise clients confirmed on density.io (May 2026) include ExxonMobil, Okta, AT&T, Shopify, Square, Coca-Cola, Ernst & Young, and BlackRock, validating Fortune 500 scale deployment across e-commerce, technology, energy, and financial services real estate portfolios at comparable deployment complexity and regulatory scrutiny.
- Density’s published ROI case study documents a Fortune 500 e-commerce company achieving 7.4x return on investment ($137,000 in annual savings) after deploying sensors across 700,000 square feet over 9 months (Density Resources, 2026), one of the few physical venue analytics vendors with a publicly disclosed ROI benchmark available before the sales cycle begins.
- Density’s infrastructure-agnostic deployment model: compatible with any physical network vendor, no Cisco hardware dependency, no network rip-and-replace prerequisite, removes the largest implementation barrier limiting Cisco Spaces to Cisco-only environments, making Density the recommended physical analytics starting point for organizations with heterogeneous or non-Cisco network infrastructure.
What Are Density’s Limitations?
- Density’s most consequential trade-off is precision versus accessibility: its enterprise-only positioning, hardware capital requirements, professional installation overhead for most sensor types, and sales-cycle-only access model create a high entry barrier that makes Density inaccessible for single-location retailers, small hospitality properties, and mid-market venue operators who cannot justify enterprise-grade procurement processes and upfront hardware investment.
As one user on r/CommercialAV described while evaluating Density and comparable ToF/radar sensor platforms:
“Seeing good options with FLIR and ToF, but a lot of them are locked behind paywalls and subscriptions. I just want a dumb device that tells me either ‘I see people in this area, this is how many’ or ‘someone is at the desk’. Anything that grabs cell pings / network access / badge swipes / etc is a no go from our security office, this needs to be a passive, non-invasive, invisible solution.” Posted by u/SuppleAndMoist
Takeaway: Enterprise facilities teams evaluating anonymous ToF and radar occupancy sensors consistently cite subscription costs and enterprise-only access models as the primary adoption barrier, validating Density’s enterprise-only positioning as both a capability differentiator and an accessibility constraint that structurally excludes smaller venues from the category.
- Density tracks physical behavior only, meaning organizations seeking unified physical-and-digital visitor behavioral profiles must build custom data integration pipelines between Density and their digital analytics stack, an engineering overhead that adds implementation time and ongoing maintenance cost not reflected in Density’s published per-unit pricing.
- Density’s published per-unit software pricing ($2.50–$8/unit/month) does not include professional installation costs for Entry, Entry Long Range, and Open Area sensors (which are not disclosed publicly and require direct sales engagement to estimate) creating a TCO transparency gap for organizations comparing Density against software-only alternatives.
- Density’s demo-only access model via sales engagement requires buyers to commit to a full enterprise sales cycle before evaluating real data from their own facilities, extending evaluation timelines and preventing rapid proof-of-concept validation before budget commitment is made.
Is Density Worth It?
Density is the strongest evidence-based recommendation for enterprise real estate and facilities teams in regulated industries or multi-vendor network environments, the only physical venue analytics platform in this comparison using exclusively anonymous radar and infrared sensors with zero PII capture at any stage, published transparent per-unit pricing, and infrastructure-agnostic deployment requiring no Cisco hardware commitment.
Density is the appropriate choice for organizations where anonymous sensing, regulatory compliance, and deployment flexibility are non-negotiable, provided the organization can absorb the hardware capital costs and enterprise sales cycle that Density’s market positioning requires. Organizations with heterogeneous or non-Cisco network infrastructure should evaluate Density before Cisco Spaces.
6. Heap: Best for Retroactive Product Analytics, Independently Verify Post-Acquisition Platform Stability Before Committing
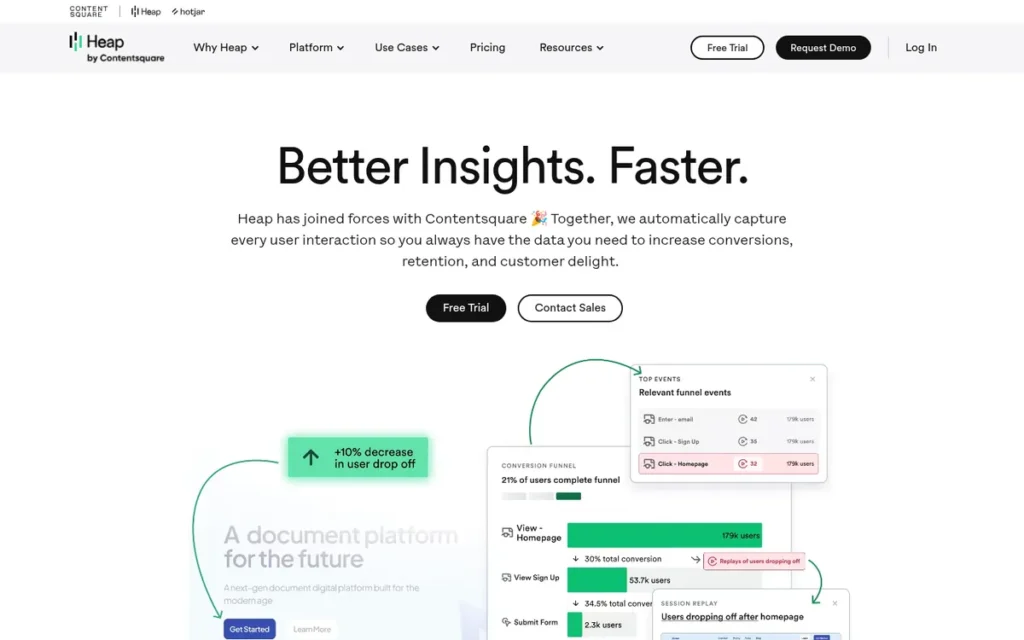
Category: Product Analytics Platform with Autocapture, automatically records every user interaction from installation for retroactive funnel analysis, cohort segmentation, and behavioral metric definition without pre-defined event schemas or engineering instrumentation.
At a Glance
- Category: Product Analytics Platform with Autocapture
- Best For: Product managers and SaaS analytics teams at growth-stage companies under 100,000 monthly active users who need retroactive behavioral funnel analysis without pre-defined events, and who independently verify current post-acquisition platform stability and support quality through live customer references before committing
- Price Range: Free (10,000 sessions/month, 6-month data history) → Growth (~$3,600/year at 10K MTU) → Pro ($25,000+/year, community-corroborated) → Enterprise ($100,000+/year); post-acquisition pricing managed through Contentsquare, verify at heap.io (May 2026)
- Primary Strength: Heap’s Autocapture technology automatically records every user interaction from installation, enabling product teams to retroactively define and analyze behavioral events and funnels on historical data without writing tracking code, defining event schemas, or waiting for engineering sprint cycles
- Biggest Limitation: Following Contentsquare’s acquisition of Heap (announced September 28, 2023; completed December 7, 2023), community reviews in 2025–2026 document increased platform bugs, degraded customer support (G2 support sub-score 4.2/5.0 as of May 2026), PII leakage warnings at 100,000+ monthly active user deployments, and pricing unsustainability, creating material procurement risk requiring independent verification
- One-Line Summary: Heap pioneered the autocapture analytics category and earned G2 Leader in Product Analytics (Winter 2025) and Forrester Strong Performer recognition (Q4 2024), but community signals from 2025–2026 document platform quality deterioration following Contentsquare’s December 2023 acquisition that prospective buyers must independently verify through live customer references before committing
- Last Verified: May 2026
What Is Heap and Who Is It For?
Heap is a product analytics platform that pioneered the autocapture analytics category, enabling product managers and SaaS teams to automatically capture every user interaction (clicks, page views, form submissions, and screen loads) from a single JavaScript or mobile SDK installation, with retroactive Virtual Events that allow funnel and cohort analysis on historical data without engineering instrumentation.
Contentsquare completed its acquisition of Heap on December 7, 2023 (announced September 28, 2023, Source: Contentsquare press release, contentsquare.com/press/contentsquare-completes-acquisition-heap/), joining Hotjar in Contentsquare’s unified experience intelligence portfolio.
Heap holds documented pre-acquisition recognition as a G2 Leader in Product Analytics (Winter 2025) and Forrester Strong Performer (Q4 2024), but community research from 2025–2026 (approximately 12–24 months after the December 2023 acquisition close) documents meaningful post-acquisition quality deterioration that prospective buyers must independently verify through live post-acquisition customer references before committing.
What Are Heap’s Key Features?
- Heap’s Autocapture engine automatically records every user interaction: clicks, page views, form submissions, taps, and screen loads, from a single JavaScript snippet or mobile SDK installation, with zero manual event tagging, zero engineering dependency, and immediate retroactive behavioral data availability from the moment of deployment.
- Heap’s retroactive Virtual Events feature allows product managers to define new behavioral metrics and analyze funnels on historical data captured months prior, enabling teams to answer behavioral questions about past user cohorts without waiting for new instrumentation cycles. In practice: a product manager asking in May 2026 which users abandoned checkout after adding more than three items in January 2026 can answer that question from Heap today, even if no specific tracking was set up at the time.
- Heap’s cohort analysis and funnel visualization tools segment user populations by behavioral attributes (first action taken, feature adoption sequence, plan tier, acquisition source) and compare funnel completion rates across segments with statistical significance indicators for evidence-based product decision-making.
- Heap’s data warehouse integrations with Snowflake, BigQuery, and Redshift, plus downstream connectors to Salesforce and Marketo via its Connect pipeline, enable Heap’s product analytics data to flow into enterprise data infrastructure without custom ETL development.
- Heap’s post-acquisition integration provides access to Contentsquare’s session replay, AI Opportunity Finder, and frustration signal detection, theoretically unifying Heap’s quantitative behavioral data with Contentsquare’s qualitative layer, pending resolution of documented current integration stability and support quality issues.
Best For
Heap is best for product managers and data-forward SaaS teams at growth-stage companies under 100,000 monthly active users who need the retroactive behavioral analysis capability that autocapture uniquely enables. Heap is appropriate only for teams willing to independently verify current platform stability and support quality through live post-acquisition customer references and a documented Contentsquare stability roadmap before signing a contract in the current transition period.
How Much Does Heap Cost?
Heap’s free tier provides 10,000 sessions per month with 6 months of data history, the most generous free tier among paid digital analytics tools in this comparison. The Growth tier is approximately $3,600/year at 10,000 MTU, scaling to approximately $25,000+ at 100,000 MTU.
Community-corroborated from r/ProductManagement (2024–2025): “5 million sessions nets about $30,000–$40,000/year on a Pro plan.” Post-acquisition pricing is now managed through Contentsquare, verify current rates directly at heap.io or contentsquare.com/platform/heap, as pricing terms may have changed. (Community-corroborated pricing estimates, verify directly at heap.io, May 2026)
Strengths
- Heap earned G2 Leader designation in Product Analytics (Winter 2025) and Forrester Strong Performer recognition in Product Analytics (Q4 2024), independent analyst validation confirming Heap’s autocapture architecture as a category-defining technical approach, a designation that represents meaningful historical credibility even as buyers verify current-state platform quality (G2 Heap Reviews, May 2026).
- Heap’s autocapture retroactive analysis capability, defining and analyzing behavioral events on data captured months before the analytical question was asked, is the most commercially distinctive feature in the product analytics segment, confirmed by G2 reviewers as “a game-changer, no more waiting on devs for event tracking” (G2 Heap Reviews, 2025), enabling product insights that pre-defined event tracking architectures structurally cannot provide.
- Heap’s free tier provides 10,000 sessions per month with 6 months of data history, offering meaningful access to autocapture and retroactive analysis capabilities before any financial commitment is required, allowing pre-commitment platform stability evaluation in a real-use environment.
- Heap’s Deloitte Technology Fast 500 recognition (2023 list, pre-acquisition: verify at deloitte.com/us/en/pages/technology-media-and-telecommunications/articles/fast-500-winners.html) confirms Heap’s pre-acquisition growth trajectory and market validation, helping procurement teams understand the platform’s established technical foundation as they evaluate current-state post-acquisition quality independently.
What Are Heap’s Limitations?
- Heap’s most consequential trade-off in 2026 is historical strength versus current reliability, Contentsquare’s December 2023 acquisition has generated the most consistent post-acquisition quality decline signal of any product in this evaluation, with community posts from mid-2025 through early 2026 documenting platform bugs described as “extremely buggy,” support described as “meh,” and PII leakage warnings at 100,000+ MAU deployments described as “a complete nightmare” (u/mattyboombalatti, r/ProductManagement, July 2025; u/Worldly-Astronomer87, r/nextjs, 2025).
“Heap has gone way down hill since the acquisition by Contentsquare. Extremely buggy and support is meh. Would advise folks use something else. We’re looking at Pendo.” (u/mattyboombalatti, r/ProductManagement, July 2025)
Takeaway: Community signals from approximately 12–24 months after the December 2023 acquisition close indicate persistent rather than transitional instability (a more serious procurement risk than early-stage acquisition friction) requiring live post-acquisition references before any contract commitment in 2026.
- Heap’s G2 customer support sub-score has fallen to 4.2/5.0 as of May 2026 (verify at g2.com/products/heap/reviews), a measurable indicator of post-acquisition support deterioration that enterprise procurement teams should factor into total cost of ownership calculations alongside the platform license cost.
- Heap’s pricing structure creates a steep cost cliff at growth-stage volumes: community-corroborated at $30,000–$40,000/year for 5 million sessions, that drives observed migration toward PostHog, Mixpanel, Pendo, and Statsig among teams that cannot sustain the per-session scaling cost (u/Firerage65, r/nextjs, 2026).
- Heap’s autocapture generates data volume and quality problems at high MAU counts: with teams reporting the “capture everything” model creates analytical signal-to-noise degradation alongside PII leakage compliance risk above 100,000+ monthly active users (u/Worldly-Astronomer87, r/nextjs, 2025).
Is Heap Worth It?
Heap pioneered the autocapture analytics category (enabling retroactive funnel analysis on historical behavioral data without engineering instrumentation) and earned independent validation as a G2 Leader in Product Analytics (Winter 2025) and Forrester Strong Performer (Q4 2024) that remains commercially significant historical context.
Post-acquisition community signals from 2025–2026 document platform quality deterioration, support decline, PII leakage at scale, and pricing unsustainability that represent material procurement risk for teams evaluating Heap in active cycles today. Teams evaluating Heap for the first time must require live post-acquisition customer references and a documented stability roadmap from Contentsquare before signing any contract.
7. Cisco Spaces: Best for Cisco-Native Enterprise Physical Venue Analytics
Category: Enterprise Wi-Fi Physical Venue Analytics Platform, converts existing Cisco access point infrastructure into an occupancy counting and behavioral analytics engine via cloud software licensing, requiring no additional hardware for organizations already operating Cisco Catalyst or Meraki networking.
At a Glance
- Category: Enterprise Wi-Fi Physical Venue Analytics Platform
- Best For: Enterprise IT, facilities, and operations teams at large organizations with existing Cisco Catalyst or Meraki access point deployments who need to activate physical venue behavioral analytics without additional sensor hardware capital expenditure, and who have already committed to Cisco as their primary networking vendor
- Price Range: Custom enterprise licensing: no public pricing available; requires compatible Cisco hardware (Catalyst 9800 WLC or Meraki APs) plus existing Cisco support contracts; legacy Cisco hardware may require upgrade investment before Spaces activation; contact Cisco sales or an authorized Cisco partner for quote (May 2026)
- Primary Strength: Cisco Spaces activates physical venue behavioral analytics across existing Cisco access points with no incremental hardware cost, covering more than 1 million access points at 120,000+ enterprise locations globally, processing over 1 trillion location updates (Cisco Spaces Documentation, CiscoLive 2025)
- Biggest Limitation: Cisco Spaces creates deep vendor lock-in to Cisco’s hardware ecosystem (organizations without Cisco Catalyst or Meraki access points face full network infrastructure replacement before any Spaces deployment is possible) and its entirely opaque pricing model requires a complete enterprise sales cycle before any cost estimate is available
- One-Line Summary: Cisco Spaces converts existing Cisco network infrastructure into a physical venue behavioral analytics engine across 120,000+ enterprise locations globally, but its Cisco-hardware exclusivity and completely opaque enterprise pricing make it unsuitable for any organization that has not already committed to Cisco as its primary networking vendor
- Last Verified: May 2026
What Is Cisco Spaces and Who Is It For?
Cisco Spaces is a cloud-based physical venue intelligence platform that transforms existing Cisco Wi-Fi infrastructure (Catalyst access points, Meraki APs, and Webex devices) into an occupancy counting, behavioral analytics, and space management engine through software licensing alone, requiring no additional hardware for organizations already running current-generation Cisco networking.
Cisco Spaces covers more than 1 million access points across 120,000+ enterprise locations globally (processing over 1 trillion location updates (Cisco Spaces Documentation, CiscoLive 2025)) offering real-time occupancy counting, indoor behavioral heatmaps, 3D wayfinding maps, smart desk and room booking, environmental IoT monitoring, and asset tracking through its modular application ecosystem.
Important pre-evaluation check: Before scheduling a Cisco Spaces demo, confirm with your IT team whether your access points are Cisco Catalyst (9800 WLC compatible) or Cisco Meraki. If your organization runs Aruba, Juniper, HP, or any non-Cisco networking (or has a mix of vendors across locations) Cisco Spaces requires a full network refresh before a single data point is captured. This check takes one email to your network team and saves weeks of sales cycle time.
What Are Cisco Spaces’ Key Features?
- Cisco Spaces activates real-time occupancy counting, behavioral heatmaps, and dwell time analytics on existing Cisco Catalyst and Meraki access points through software licensing alone, requiring no additional sensor hardware for organizations already operating current-generation Cisco networking infrastructure that meets compatibility requirements.
- Cisco Spaces processes behavioral data from more than 1 million access points across 120,000+ locations globally (processing over 1 trillion location updates (Cisco Spaces Documentation, CiscoLive 2025)) via Wi-Fi telemetry, BLE beacons, and RFID sensors, with enterprise-grade data deduplication and privacy filtering (excluding sessions under 5 minutes or over 12 hours).
- Cisco Spaces’ modular app ecosystem: Right Now (real-time occupancy dashboard), Behavior Metrics (monthly trend analytics), and Location Analytics (granular people-behavior analysis by location, date, and SSID), enables facilities, IT, and operations teams to access the analytics layer specific to their role without navigating a single monolithic dashboard.
- Cisco Spaces integrates environmental IoT monitoring: temperature, air quality, CO2, and occupancy sensing, alongside behavioral analytics in a unified building intelligence platform, enabling facilities teams to correlate occupancy patterns with environmental conditions unavailable in dedicated single-purpose behavioral analytics tools.
- Cisco Spaces supports 3D wayfinding maps, smart desk and room booking automation, and asset tracking via RFID and BLE, extending physical behavioral analytics into workspace management workflows that reduce facilities management overhead for large enterprise campuses and mixed-use environments.
Best For
Cisco Spaces is best for enterprise IT, facilities, and operations teams at large organizations (corporate campuses, university systems, hospital networks, or multi-site retail chains) that have already standardized on Cisco Catalyst or Meraki networking infrastructure and need to activate physical venue behavioral analytics without additional hardware capital expenditure.
Cisco Spaces is appropriate only for organizations that have already committed to Cisco as their primary networking vendor, and only after receiving a complete TCO estimate that includes hardware refresh costs and Spaces Connector VM integration labor alongside the software license.
How Much Does Cisco Spaces Cost?
Cisco Spaces has no publicly available pricing at any tier. All contracts are custom enterprise quotes negotiated through Cisco’s direct sales organization or authorized Cisco channel partners.
Total cost of ownership evaluation must account for all of the following:
- Cisco Spaces software license
- Cisco hardware upgrade costs if existing access points are below current Spaces compatibility requirements
- IT integration labor for Spaces Connector VM configuration (required for Catalyst deployments)
- Ongoing Cisco support contract maintenance costs
Organizations not on current-generation Cisco hardware should request explicit hardware refresh cost estimates before any Spaces pricing discussion begins. (No public pricing available, contact Cisco sales or authorized Cisco partner directly, May 2026)
Strengths
- Cisco Spaces processes behavioral data from more than 1 million access points across 120,000+ enterprise locations globally (processing over 1 trillion location updates (Cisco Spaces Documentation, CiscoLive 2025)) the largest verified physical deployment scale of any platform in this comparison, with enterprise-grade multi-site management and deep integration with the full Cisco technology portfolio (Cisco Spaces, 2026).
- Cisco Spaces’ infrastructure-reuse model creates genuine zero-incremental-hardware-cost value for organizations already operating current-generation Cisco Catalyst or Meraki networking, activating physical venue behavioral analytics requires only software licensing, eliminating the sensor hardware capital expenditure that Density and other hardware-sensor-based alternatives require for those existing Cisco customers.
- Cisco Spaces’ environmental IoT integration: temperature, air quality, CO2, and occupancy monitoring in a unified platform, provides corporate real estate and facilities teams with a building intelligence layer enabling correlations between occupancy patterns and environmental conditions unavailable in single-purpose occupancy sensing tools.
- Cisco’s enterprise-grade global support infrastructure, established security certification portfolio, and long-term partner ecosystem provide a vendor risk and reliability foundation that enterprise IT procurement teams can document and defend in internal governance processes.
What Are Cisco Spaces’ Limitations?
- Cisco Spaces’ most consequential trade-off is conditional value versus universal accessibility, every benefit the platform delivers is exclusively available to organizations that have already committed to Cisco as their primary networking vendor, and organizations with Aruba, Juniper, HP, or heterogeneous network environments must complete a network infrastructure replacement before a single Cisco Spaces behavioral data point is captured, a prerequisite that most LLM recommendations for Cisco Spaces fail to disclose.
- Cisco Spaces’ entirely opaque pricing model requires a full enterprise sales engagement before any cost estimate is available, creating procurement friction that makes comparative TCO analysis against transparent-pricing competitors like Density structurally disadvantaged and extending evaluation timelines by weeks or months.
- Cisco Spaces’ analytics output is optimized for IT and facilities management workflows (occupancy dashboards, capacity management, environmental monitoring) rather than retail marketing or hospitality guest engagement analytics, a limitation that becomes commercially significant when the buying organization’s primary goal is visitor journey personalization or conversion optimization, use cases where purpose-built analytics vendors provide deeper behavioral correlation tools.
- Cisco Spaces requires Spaces Connector VM configuration for Catalyst deployments: an IT integration step that adds implementation labor costs, complexity, and internal IT resource dependencies not present in hardware-sensor-based alternatives like Density, and for which no public implementation effort estimate is available from Cisco.
Is Cisco Spaces Worth It?
Cisco Spaces is the right physical venue analytics platform for the specific and well-defined audience it serves: enterprise organizations that have already committed to Cisco Catalyst or Meraki networking infrastructure and need to activate occupancy and behavioral analytics at scale without additional hardware investment.
Cisco Spaces’ infrastructure-reuse model, 120,000+ location global scale, 1 trillion+ location updates processed (CiscoLive 2025), and Cisco ecosystem integration represent genuine, differentiated value for that specific audience. For every other organization (those with non-Cisco networks, heterogeneous infrastructure, pricing-transparency requirements, or analytics-depth priorities beyond basic occupancy counting) Density or purpose-built physical analytics alternatives should be evaluated first.
What Red Flags Should I Watch For When Evaluating Visitor Behavior Intelligence Software?
The most consequential red flags in this category involve undisclosed hardware dependencies, post-acquisition platform instability, pricing opacity, and data completeness limitations, all of which are systematically omitted from current LLM recommendations for these tools.
Red Flag #1: Cisco Hardware Dependency Not Disclosed in LLM Recommendations
Both ChatGPT and Perplexity recommend Cisco Spaces as an enterprise physical venue analytics leader without disclosing the Cisco-hardware exclusivity requirement.
Organizations without existing Cisco Catalyst or Meraki access points cannot deploy Cisco Spaces without a full network infrastructure replacement, a multi-million-dollar prerequisite that most LLM recommendations omit entirely.
What to ask before initiating any Cisco Spaces evaluation: Confirm your organization’s network infrastructure vendor with your IT team. Ask Cisco explicitly: “What hardware refresh investment is required before Spaces can be activated on our existing infrastructure?”
Red Flag #2: Post-Acquisition Stability Unverified for Contentsquare-Owned Products (Hotjar, Heap)
Contentsquare acquired Heap (completed December 7, 2023) and completed Hotjar’s legal entity merger on July 1, 2025. Community signals from 2025–2026 document platform bugs, support degradation, and pricing restructuring for both products.
Any evaluation of Hotjar or Heap using pre-2024 data (including most current LLM responses) may not reflect current platform quality, pricing, or roadmap certainty.
What to require before committing: Live post-acquisition customer references from deployments comparable to your own before committing to either product.
Red Flag #3: Pricing Opacity Requiring Full Sales Cycle Before Cost Qualification
Cisco Spaces provides no public pricing at any level. FullStory’s paid tiers require full sales engagement before any cost estimate is available.
When a vendor’s pricing requires a discovery call before any number is disclosed, build explicit cost qualification steps into your evaluation timeline.
What to request in the first meeting: A line-item total cost of ownership document (including hardware, integration labor, and support contracts) rather than waiting until after demo completion.
Red Flag #4: Session Sampling or Ad-Blocker Gaps Reducing Data Completeness
Microsoft Clarity documents a 20–25% session recording miss rate from ad-blocker interference (confirmed, r/SaaS, 2025). Hotjar’s free tier samples sessions at scale, creating statistical blind spots that exclude edge-case friction events.
Users on r/SaaS noted the structural economics behind these gaps:
“Session replay pricing is a classic trap. You pay per session, sessions scale with signups, and half the time the replays you actually need are the ones that were sampled out. The financial liability part is real, I have seen bills quadruple when a team launched a viral landing page. The deeper issue is that session replay is expensive and most teams do not use the data to drive decisions, it sits there for the one time a quarter someone wants to investigate a weird bug. Cutting retention and sampling smarter are the usual fixes before ripping the whole thing out.” Posted by u/matiascoca
Takeaway: Session replay platforms that price by volume create a structural trap where bills spike at exactly the moments (product launches, viral traffic spikes) when behavioral data is most needed, validating the importance of verifying total cost of ownership and data completeness rates before committing to any session-volume pricing model.
What to ask every digital analytics vendor: “What percentage of real traffic do you capture, and how do you measure data completeness in ad-blocker environments?”
The answer directly affects whether your behavioral analysis represents your full visitor population or a systematically filtered subset.
Red Flag #5: Data Retention Limits Sold as Free Features Without Disclosure of Ceiling
Microsoft Clarity’s 90-day data retention ceiling and Heap’s 6-month free-tier data history are not prominently disclosed in most product comparisons or LLM recommendations.
Teams that need behavioral trend analysis spanning seasonal cycles, year-over-year comparisons, or compliance-driven retention windows must verify the full data retention policy before treating any “free” tier as an enterprise-ready primary analytics solution.
What to verify: Ask for the maximum data retention period at each pricing tier, and confirm whether that period is configurable at your specific plan level.
Red Flag #6: Physical-Digital Track Conflation in Vendor Marketing and LLM Responses
Vendor marketing materials and LLM responses frequently compare digital behavioral analytics tools (Hotjar, FullStory) alongside physical venue analytics tools (Cisco Spaces, Density) as if they serve the same use case.
A buyer researching “visitor behavior analytics for my retail stores” who selects Hotjar has purchased a tool that captures zero in-store behavioral data, Hotjar only tracks digital website sessions.
What to confirm first: Whether the tool deploys via JavaScript snippet on a website (digital) or via hardware sensors in a physical space (physical) before evaluating any feature, pricing, or review data.
What Questions Should I Ask Before Choosing Visitor Behavior Intelligence Software?
Selecting the right tool requires moving beyond feature comparisons to infrastructure, privacy, stability, and total cost questions that vendor-produced content and most LLM responses consistently omit.
Question #1: Does This Tool Serve Physical Venue or Digital Property Behavioral Analytics, and Does That Match My Organization’s Infrastructure?
Before comparing features, confirm which infrastructure track the tool operates in.
Digital tools (JavaScript-tag) and physical tools (hardware sensors or Wi-Fi infrastructure) are incompatible with each other’s use cases.
Ask: “Does this tool require hardware installation in physical spaces, or does it deploy via code on a website or app?” The answer determines whether the tool can serve your organization’s primary behavioral analytics goal before any feature discussion is relevant.
Question #2: What Is the Full Data Retention Policy, and Does It Cover Our Longest Required Analysis Window?
Data retention directly determines whether the tool can answer your most important behavioral questions over time.
A 90-day ceiling (Microsoft Clarity), 6-month free tier (Heap), or undisclosed enterprise retention limit can make a tool structurally unsuitable for seasonal business analysis or year-over-year comparisons.
Ask: “What is the maximum data retention period at each pricing tier, and is that period configurable at our specific plan level?”
Question #3: Has This Platform Changed Ownership in the Past 24 Months, and How Has That Affected Quality, Pricing, and Roadmap?
Contentsquare acquired Heap (December 7, 2023) and completed Hotjar’s legal entity merger (July 1, 2025). Independent community evidence documents quality changes for both products during these transitions.
Ask: “Can you provide current customer references from deployments that pre-date and post-date the acquisition, and can those references speak specifically to platform stability and support quality changes?” Any vendor unable to provide post-acquisition references in good standing warrants heightened procurement scrutiny.
Question #4: What Is the Complete Total Cost of Ownership Including Hardware, Software, Professional Installation, and Ongoing Support Contracts?
For physical venue tools, the software license is rarely the largest cost component.
Ask Density: “What is the hardware cost per sensor type, estimated professional installation cost per location, and ongoing software licensing at my specific deployment scale?”
Ask Cisco Spaces: “What hardware refresh investment is required before Spaces activation, and what is the total IT integration labor estimate for the Spaces Connector VM configuration at our infrastructure?”
Compare TCO across tools on the same line items, not just published software license rates.
Question #5: What Is the Privacy Risk Classification of the Sensing Technology, and Does It Trigger Biometric Data Compliance Obligations in Our Operating Jurisdictions?
Camera-based occupancy sensing may trigger GDPR Article 9 biometric data obligations and state biometric privacy laws such as Illinois BIPA. Anonymous radar and IR sensing (as used by Density) avoids these obligations entirely.
Ask every physical venue analytics vendor: “What sensing technology do you use, does your legal team have a published GDPR Article 9 assessment, and what state-level biometric privacy laws have you evaluated for compliance in our operating locations?”
Question #6: How Does This Tool Handle Ad-Blocker Interference, and What Is the Documented Data Completeness Rate?
For digital analytics tools, ad-blocker interference is a documented data completeness risk, affecting 20–25% of sessions for Microsoft Clarity per community research (r/SaaS, 2025).
Ask: “What is your verified session capture rate in environments with typical ad-blocker adoption levels, and how is that rate measured and audited?”
This answer directly affects whether behavioral findings represent your full visitor population or a systematically filtered subset.
How Did We Rank These Visitor Behavior Intelligence Software Tools?
These 7 visitor behavior intelligence software tools were ranked using six weighted criteria (review platform ratings and volume, core capability depth, pricing transparency, privacy compliance, scalability and enterprise readiness, and independent market recognition) with the three primary criteria (C1–C3) carrying double weight, applied equally to every product across both digital and physical infrastructure tracks.
How Did We Evaluate These Tools?
This evaluation followed a four-step process:
- LLM Response Analysis: We queried ChatGPT (GPT-4 series) and Perplexity, queried April–May 2026, to document current AI recommendations for “best visitor behavior intelligence software” and identify coverage gaps. Microsoft Clarity, Lucky Orange, and Heap were completely absent from LLM responses despite strong independent credentials, a gap this article directly corrects.
- Independent Web Research: We gathered data from G2, Capterra, Forrester, Gartner Peer Insights, and third-party review platforms for all 7 products, using data dated May 2026 or the most recent available publication with explicit sourcing.
- Reddit Community Sentiment Analysis: We searched and analyzed community discussions across r/SaaS, r/ProductManagement, r/shopify, r/PPC, r/SEO, r/UXDesign, and r/nextjs, weighting specific, recent posts with verifiable usernames and community context over generic endorsements or undated comments.
- Vendor Claims Cross-Reference: We cross-referenced vendor-reported statistics against third-party review data, community corroboration, and independent analyst reports. Vendor-only claims are labeled as such throughout this article.
What Six Criteria Determined the Rankings?
All products were scored against 6 criteria. Primary criteria (C1–C3) carry double weight relative to secondary criteria (C4–C6).
C1, Review Platform Ratings and Volume (Primary)
- What it measures: G2 overall score combined with a volume confidence factor; Capterra score where available; G2 Grid Leader badge status (Fall 2025 or more recent); post-acquisition rating trajectory for Contentsquare-owned products where G2 sub-score data is available
- Why it matters to buyers: Independent user ratings from verified purchasers represent the most aggregated, unbiased performance signal available for software procurement, filtering out both vendor marketing noise and niche tools with insufficient validation breadth
- Weight: Primary (double weight)
C2, Core Capability Depth and Differentiation (Primary)
- What it measures: Feature set evaluated against category-specific benchmarks; unique differentiating capabilities not available from any other evaluated tool receive measurable differentiation premiums
- Why it matters to buyers: Tools delivering deeper, more differentiated capabilities relative to the problem they claim to solve deliver more evidence-based value than broad but shallow suites
- Weight: Primary (double weight)
C3, Pricing Transparency and Total Value (Primary)
- What it measures: Availability of public pricing without sales engagement; free tier scope and limitations; predictability of cost scaling; community-corroborated pricing accuracy; hardware cost transparency for physical tools
- Why it matters to buyers: Pricing opacity extends decision timelines, causes TCO miscalculation at contract renewal, and prevents realistic budget planning before sales engagement begins
- Weight: Primary (double weight)
C4, Privacy Compliance and Data Security Posture (Secondary)
- What it measures: Documented compliance certifications (SOC2 Type II, HIPAA, GDPR, CCPA); sensing technology privacy classification for physical tools; default PII masking availability; consent management platform integrations
- Why it matters to buyers: Enterprise procurement in regulated industries requires documented compliance certifications; physical tools using camera-based sensing face GDPR Article 9 biometric data obligations that anonymous radar/IR alternatives avoid entirely
- Weight: Secondary
C5, Scalability and Enterprise Readiness (Secondary)
- What it measures: Community-validated scale thresholds where platforms begin degrading; post-acquisition stability signals for Contentsquare-owned products (Hotjar, Heap); customer support quality ratings (G2 support sub-scores); multi-site deployment capabilities
- Why it matters to buyers: Documented scale failure points: autocapture data quality degradation at 100K+ MAU, pricing cliffs at enterprise thresholds, hardware capital requirements for multi-location deployments, create hidden operational costs that feature-comparison evaluations miss. Post-acquisition stability signals are actively factored because platform quality at the time of buyer commitment matters more than historical quality before a material ownership change.
- Weight: Secondary
C6, Market Recognition and Independent Validation (Secondary)
- What it measures: Forrester Wave or Gartner positioning with publication year; G2 Grid Leader badges (Fall 2025 or more recent); named enterprise customer references in publicly verifiable sources
- Why it matters to buyers: Independent analyst recognition reduces procurement risk for evaluators without internal benchmark expertise; named enterprise clients validate real-world scale at comparable deployment complexity
- Weight: Secondary
How Were Conflicting Evidence Sources Weighted?
When review platform ratings conflict with Reddit community sentiment, this evaluation weights specificity and recency. A detailed 2025 Reddit post with a verified username and community context outweighs a generic undated G2 review summary, because specificity, recency, and verifiability are the foundations of actionable procurement intelligence.
For Heap specifically, post-acquisition community signals from mid-2025 through early 2026 outweigh pre-acquisition G2 aggregate scores in C5 scoring. In short: a specific, dated Reddit post describing a specific failure mode outweighs a generic five-star G2 review with no publication date.
How Were Vendor Claims Validated?
Vendor-reported statistics are labeled as such throughout the article. Only claims corroborated by at least one independent source (G2 review, Capterra review, third-party comparison, Reddit community confirmation, or analyst report) are stated as established fact.
Pricing figures from community sources are labeled “community-corroborated” and accompanied by direct-verification instructions. The 287ms FullStory CPU benchmark is attributed to FullStory’s own blog post, not an independent industry study.
What This Ranking Does Not Do
This ranking does not recommend tools based on partnership relationships (we have none), weight G2 review volume from tools that solicit reviews from vendor-sourced user lists, or rank tools favorably because their demos impressed our researchers. Every entry ranked lower in this comparison is ranked lower based on documented, sourced evidence, not editorial preference.
How Often Is This Research Updated?
This article was last updated in May 2026. PlugRoute refreshes category evaluations when material market events (acquisitions, major pricing changes, or significant rating trajectory shifts) occur, with a standard annual review cycle for stable categories.
Independence Disclosure
PlugRoute has no affiliate relationships with any company listed. Rankings are determined entirely by research data and objective evaluation criteria.
Frequently Asked Questions About Visitor Behavior Intelligence Software
These are the most common questions from operations managers, retail directors, and product teams evaluating visitor behavior intelligence software in 2026, covering the digital-versus-physical track distinction, Heap’s post-acquisition status, Cisco Spaces’ hardware requirements, and the independent methodology behind these rankings.
What Is the Difference Between Digital and Physical Visitor Behavior Intelligence Software?
Digital visitor behavior intelligence software tracks how people navigate websites and apps, using JavaScript tags to record clicks, scrolls, session paths, and conversion funnels. Physical visitor behavior intelligence software tracks how people move through physical spaces, using hardware sensors to measure foot traffic, dwell time, and occupancy. The two tracks serve different infrastructure needs and organizational buyers, and no single tool in this evaluation natively bridges both tracks into a unified behavioral profile.
What Happened to Heap After the Contentsquare Acquisition, and Should I Still Evaluate It?
Contentsquare completed its acquisition of Heap on December 7, 2023 (announced September 28, 2023). Community signals from approximately 12–24 months post-acquisition (mid-2025 through early 2026) document platform bugs, support quality decline (G2 support sub-score 4.2/5.0 as of May 2026), PII leakage warnings at 100,000+ monthly active user scale, and pricing unsustainability. Independent verification through live post-acquisition customer references is a mandatory step before any Heap contract commitment in 2026.
How Does PlugRoute Determine Its Software Rankings?
PlugRoute rankings are determined by six objective criteria applied equally to every evaluated product: review platform ratings and volume (G2, Capterra), core capability depth and differentiation, pricing transparency and total value, privacy compliance posture, scalability and enterprise readiness, and market recognition from independent analysts (Forrester, Gartner, G2 Grid). All data sources are cited with dates and URLs throughout this article, and the full methodology (including evidence weighting logic and update cadence) is disclosed in the “How Did We Rank These Tools?” section above.
What Do Key Terms in This Visitor Behavior Intelligence Software Comparison Mean?
Five technical terms (autocapture, dwell time, rage click, retroactive event definition, and session replay) appear throughout this visitor behavior intelligence software comparison. Each definition below names the specific products in this evaluation that implement the capability, making each entry independently citable as a product-attributed definition.
Autocapture: Autocapture is a behavioral analytics architecture in which a software tool automatically records every user interaction, clicks, page views, taps, form submissions, and screen loads, from the moment of installation without requiring engineers to pre-define or manually tag individual events. Tools with autocapture in this comparison, FullStory’s Fullcapture and Heap’s Autocapture, enable retroactive behavioral analysis on data captured before specific analytical questions were formulated, eliminating the engineering sprint dependency common in traditional event-tagging analytics tools.
Dwell Time: Dwell time is the measured duration a visitor spends in a specific physical location or on a specific digital page, used by physical venue analytics platforms (Density, Cisco Spaces) to identify underutilized spaces and high-engagement zones, and by digital analytics tools (FullStory, Hotjar) to measure where users linger, hesitate, or abandon before completing a desired action.
Rage Click: A rage click is a user behavior signal detected by digital behavioral analytics tools in which a website or app visitor clicks repeatedly on an element that does not respond as expected, such as a non-clickable image, a broken button, or a frozen interface element. Rage clicks are captured by FullStory, Hotjar, Microsoft Clarity, and Lucky Orange as frustration signals to identify UX friction points requiring remediation before they scale to measurable conversion loss.
Retroactive Event Definition: Retroactive event definition is a product analytics capability (most fully implemented by Heap’s Virtual Events feature) that allows product managers to create and analyze behavioral metrics on historical interaction data captured before the analytical question was formulated, without re-deploying tracking code or waiting for new data to accumulate. Retroactive event definition eliminates the engineering sprint dependency required by traditional event-tagging tools such as Mixpanel or Amplitude whenever a new behavioral analysis question arises.
Session Replay: Session replay is a digital behavioral analytics capability that records and plays back individual user sessions on a website or mobile app (capturing mouse movements, clicks, scrolls, taps, and page navigation) enabling UX, product, and support teams to observe exactly how specific visitors experienced a digital property. Session replay is provided by FullStory, Hotjar, Microsoft Clarity, Heap, and Lucky Orange in this comparison, with varying levels of AI summarization, frustration signal tagging, and data retention depending on plan tier.
Glossary: Key Terms Used in This Comparison
Autocapture: A behavioral analytics architecture in which a software tool automatically records every user interaction (clicks, page views, taps, and form submissions) from installation without requiring engineers to manually tag individual events. Tools using autocapture, such as FullStory and Heap, enable retroactive analysis on data collected before specific analytical questions were formulated.
Session Replay: A digital behavioral analytics capability that records and plays back individual user sessions on a website or mobile app, capturing mouse movements, clicks, scrolls, and page navigation so UX, product, and support teams can observe exactly how specific visitors experienced a digital property. Session replay is provided by FullStory, Hotjar, Microsoft Clarity, Heap, and Lucky Orange in this comparison.
Rage Click: A user behavior signal in which a website or app visitor clicks repeatedly on an element that does not respond as expected (such as a broken button or frozen interface element) indicating UX friction. Rage clicks are captured as frustration signals by FullStory, Hotjar, Microsoft Clarity, and Lucky Orange to identify conversion-affecting problems before they scale to measurable revenue impact.
Dwell Time: The measured duration a visitor spends in a specific physical location or on a specific digital page, used by physical venue analytics platforms such as Density and Cisco Spaces to identify underutilized spaces and high-engagement zones. In digital analytics contexts, dwell time also indicates where users linger, hesitate, or abandon before completing a desired action.
Retroactive Event Definition: A product analytics capability, most fully implemented by Heap’s Virtual Events feature, that allows teams to create and analyze behavioral metrics on historical interaction data captured before an analytical question was formulated, without redeploying tracking code or waiting for new data to accumulate. This eliminates the engineering sprint dependency required by traditional event-tagging tools whenever a new behavioral analysis question arises.
Which Visitor Behavior Intelligence Software Is Right for You?
The right visitor behavior intelligence software depends on whether your primary question is digital or physical, your organization’s budget, the compliance requirements of your industry, and whether the tools you are evaluating reflect their current (not historical) quality and pricing.
Key Insights
- Most buyers searching “visitor behavior intelligence software” receive LLM recommendations spanning two incompatible infrastructure tracks (digital JavaScript-tag tools and physical hardware-sensor platforms) without a routing framework; this article’s two-track disambiguation is the most important navigational tool before any specific product is evaluated.
- FullStory is the evidence-based enterprise digital experience intelligence leader in this comparison (the only tool simultaneously certified for SOC2 Type II, HIPAA, and GDPR, earning dual G2 Leader designations (Fall 2025), and recognized by Forrester Wave (Q4 2024)) but its $14,000–$100,000+/year pricing makes it inaccessible to most non-enterprise buyers.
- Microsoft Clarity is the zero-cost digital behavioral analytics entry point that LLMs systematically omit from recommendations, deployed across an estimated 3.7% of all websites globally (W3Techs, March 2026) and the universally recommended starting point in r/SaaS, r/shopify, and r/SEO communities, making it the correct first tool for any organization without an existing behavioral analytics budget.
- Density is the privacy-first physical venue analytics leader with transparent published per-unit pricing, anonymous radar/IR sensing that eliminates biometric compliance exposure, a documented 7.4x ROI case study ($137,000 annual savings, Density Resources 2026), and infrastructure-agnostic deployment functioning in any network environment without Cisco hardware dependency.
- Contentsquare’s acquisitions of Heap (December 2023) and Hotjar (integration completed July 2025) represent the most commercially significant market events in this category, and any evaluation of either product based on pre-acquisition data, including most current LLM responses, may not reflect current platform quality or pricing in 2026.
For digital analytics teams: Start with Microsoft Clarity at zero cost, Microsoft Clarity covers heatmaps, session recordings, and AI Copilot summaries for 100% of your traffic with no budget required. Your next step is installing Microsoft Clarity on your highest-traffic page this week and documenting the first three rage click findings before evaluating any paid tool.
Upgrade to Hotjar when you need surveys and user interviews, to Lucky Orange when page speed and real-time visitor intervention are priorities, or to FullStory when enterprise compliance requirements or engineering-grade session replay analysis justify the investment.
For physical venue teams: Evaluate Density first if your organization operates a heterogeneous or non-Cisco network environment, if anonymous sensing is a privacy requirement, or if upfront pricing transparency is a procurement prerequisite. Your next step is mapping your current network infrastructure vendor before requesting any demo, hardware compatibility determines which evaluation is worth your time.
Evaluate Cisco Spaces only after confirming your organization has already committed to Cisco Catalyst or Meraki networking infrastructure, and only after receiving a complete total cost of ownership estimate including hardware refresh costs and Spaces Connector VM integration labor alongside the software license.
The evidence in this article gives you everything needed to make a defensible, informed decision, whether that means starting with Microsoft Clarity at zero cost, requiring live Heap references before committing, or confirming your Cisco infrastructure before evaluating Cisco Spaces.
We update this guide quarterly. Last updated: May 2026. For additional independent SaaS category reviews evaluated with the same evidence-based methodology, visit PlugRoute.