Dynatrace leads for enterprise Kubernetes teams that need zero-configuration full-stack observability with causation-based AI root-cause analysis; Grafana Labs delivers the strongest cost-transparent full-stack value at approximately 60–70% lower cost than Datadog at mid-scale; Datadog covers the widest integration footprint (700+) for enterprises managing modular pricing. No single tool is simultaneously the most capable, most affordable, and least operationally demanding.
DevOps engineers and SREs evaluating container monitoring face three documented pain points:
- Enterprise vendors deliver billing surprises reaching $7,000/month for 70–80 hosts when APM, logs, and security modules are fully enabled, a real-world cost documented in r/devops.
- Self-hosted stacks hit vertical memory scaling walls that require adding Thanos or migrating to Grafana Mimir, introducing significant new operational complexity not anticipated at adoption time.
- Most platforms claiming “full-stack observability” still leave teams context-switching between separate tools for metrics, logs, traces, and security, extending mean time to resolution (MTTR) and eroding SLO compliance.
PlugRoute has no affiliate relationships with any company listed. Rankings are determined entirely by research data and objective evaluation criteria.
“The DataDog pricing model is actually pretty easy. For 500 hosts or less, you just sign over your company and all its assets to them. If >500 hosts, you need to additionally raise VC money.” (u/wingerd33, r/devops, 2023)
Takeaway: This widely-upvoted r/devops characterization of Datadog pricing reflects a genuine community sentiment that drove Datadog’s #3 ranking despite its market-leading features, cost unpredictability at scale is a documented practitioner experience, not a perception problem.
TL;DR: Top Picks at a Glance
- Dynatrace delivers zero-configuration enterprise AI-ops with causation-based root-cause analysis, the top-ranked platform in this comparison for enterprise Kubernetes environments.
- Grafana Labs provides transparent pay-as-you-go full-stack observability for any team size, at approximately 60–70% lower cost than comparable Datadog deployments (verified June 2026).
- Datadog offers the widest integration ecosystem in this comparison (700+ technologies) for enterprises that can manage its modular per-product pricing structure.
- Sematext is the most affordable full-stack commercial SaaS in this comparison, with self-service Pro pricing designed for teams of 1–25 engineers without enterprise procurement bandwidth.
What Are the Main Categories of Container Monitoring Tools?
Container monitoring tools fall into three categories based on deployment model and primary purpose. Your team’s operational capacity, budget, and security requirements determine which category, and which specific tool, belongs in your shortlist. All three categories have increasingly adopted OpenTelemetry (OTel) as an emerging collection standard, though tools differ significantly in how they price OTel-derived data, a distinction with major cost implications documented in the Datadog entry below.
Category 1: AI-Ops Full-Stack Platforms: Dynatrace, Datadog, New Relic. These commercial SaaS platforms handle full observability signal collection, AI-assisted correlation, and managed alerting. They minimize operational overhead but carry the highest per-host costs in this comparison (approximately $15–$69+/host/month at list pricing).
Category 2: Open-Source + Managed Hybrid Stacks: Prometheus, Grafana Labs. These combine CNCF-governed open-source components with optional managed SaaS backends, offering maximum flexibility and zero licensing cost, but requiring platform engineering capacity for full-stack assembly and ongoing scaling.
Category 3: Specialized Platforms: Sysdig, Sematext. Sysdig combines container monitoring with CNAPP runtime security for compliance-mandated regulated environments (approximately $20–$120+/host/month negotiated). Sematext provides lightweight unified observability for small-to-mid DevOps teams at self-service pricing that requires no enterprise sales engagement.
How Do the Top Container Monitoring Tools Compare at a Glance?
These seven container monitoring tools span three pricing tiers, free to $120+/host/month, two deployment models (self-hosted and fully managed SaaS), and four observability coverage levels from metrics-only (Prometheus) to full-stack plus runtime security (Sysdig). The table below compares each tool on the six criteria used to determine this ranking. Note: One-Line Summary values are extracted verbatim from each tool’s At a Glance block, see each tool entry for full detail.
| Rank | Company | Category | Best For | One-Line Summary | Key Capabilities | Primary Strength | Key Limitation |
|---|---|---|---|---|---|---|---|
| 1 | Dynatrace | AI-Ops Full-Stack Platform | Enterprise K8s teams with alert fatigue and MTTR bottlenecks | Highest-rated enterprise platform (G2 4.5/5, 1,363 reviews, June 2026) with zero-config OneAgent and Davis AI causation-based RCA | (1) OneAgent zero-config full-stack; (2) Davis AI causation RCA; (3) Smartscape live topology | Zero-config OneAgent; highest G2 rating (4.5/5, 1,363 reviews) in comparison | RAM-based DPS pricing requires sales engagement; inaccessible to small teams |
| 2 | Grafana Labs | Open-Source + Managed Stack | All team sizes needing cost-transparent full-stack observability | Full-stack observability at ~60–70% lower cost than Datadog (verified June 2026) via transparent LGTM + Beyla eBPF architecture | (1) LGTM stack (Loki/Tempo/Mimir); (2) Beyla eBPF zero-code; (3) Prometheus API compatible | 60–70% cheaper than Datadog at mid-scale; usable free tier (10k series, 50GB logs) | Self-hosted LGTM stack is operationally equivalent to managing a small PaaS |
| 3 | Datadog | Enterprise SaaS Platform | Enterprises needing 700+ integrations from a single SaaS | Market-leading SaaS by revenue ($2B+ ARR, 2026) with 700+ integrations, but highest billing unpredictability for OTel + APM + logs | (1) Auto-Discovery for K8s; (2) Bits AI Remediation; (3) 700+ integrations | Largest integration ecosystem (700+); NASDAQ-listed financial scale | OTel data billed as custom metrics; fully-loaded bills regularly 5–10x headline rate |
| 4 | Sematext | Lightweight Full-Stack Platform | Small-to-mid teams (1–25 engineers) at accessible price | Most affordable full-stack commercial SaaS in this comparison (Pro tier, verified June 2026), with unified metrics+logs+traces+RUM | (1) Single DaemonSet agent; (2) Unified metrics+logs+traces+RUM; (3) Docker/K8s/Swarm/Nomad | Lowest published per-host commercial pricing in this comparison; 14-day free trial, no CC required | 50+ integrations vs. 700+ for Datadog; small team limits enterprise SLAs |
| 5 | Prometheus | Open-Source Metrics Engine | K8s-native teams with platform engineering and zero-lock-in priority | CNCF-graduated metrics standard with 86% cloud-native adoption (CNCF Observability Microsurvey, 2022) and zero vendor lock-in | (1) Pull-based K8s auto-discovery; (2) PromQL; (3) 1,900+ community exporters | 86% cloud-native adoption; CNCF graduated 2018; zero licensing cost | Metrics-only natively; vertical memory scaling wall requires Thanos or Mimir |
| 6 | New Relic | Unified SaaS Platform | APM-centric teams extending into K8s; free-tier evaluators | Unique Pixie eBPF zero-code K8s visibility and 100GB/month free tier, but elevated stability risk post-November 2023 PE acquisition | (1) Pixie eBPF zero-code K8s; (2) 100GB/month free tier; (3) K8s Cluster Explorer | Pixie eBPF unique in commercial tier; most accessible commercial free tier | PE acquisition (November 2023) reduces long-term roadmap confidence |
| 7 | Sysdig | Security-Integrated Platform | Security-first orgs with SOC 2, PCI-DSS, or HIPAA requirements | Only platform combining monitoring with CNCF-graduated Falco runtime detection (February 2024) from a single eBPF agent | (1) Single eBPF agent; (2) Falco CNCF-graduated RTE; (3) CNAPP (CSPM+vuln+forensics) | Only combined monitoring + CNCF-graduated runtime security (Falco, February 2024) | Pricing requires sales engagement; list-to-negotiated range is $20–$120/host/month |
Which Container Monitoring Tool Should I Choose for My Use Case?
The right container monitoring tool depends on three factors: your team’s budget ceiling at production Kubernetes scale, your operational capacity to maintain self-hosted components, and whether compliance mandates require runtime security alongside observability. The decision matrix below maps six common team profiles to the strongest evaluated option from this comparison, with a validated alternative for each. If you are new to container monitoring evaluation, read the full tool entries below before using this framework. If you already know your team profile and constraints, use this table to jump directly to the recommended entry.
| Your #1 Priority | Recommended Tool | Why | Acceptable Alternative |
|---|---|---|---|
| Lowest cost, <20 hosts, simple stack | Sematext Pro | Lowest published per-host price among commercial platforms in this comparison; 14-day free trial, no credit card required; unified metrics+logs+traces without per-signal add-ons | Grafana Cloud Free (10,000 series + 50GB logs at $0/month) |
| Replace Datadog, 20–100 hosts | Grafana Labs | ~60–70% cheaper at mid-scale; transparent pricing; no PromQL rewrites needed for Prometheus migrations | Sematext Pro if team has limited Grafana expertise |
| Enterprise K8s, auto-everything | Dynatrace | OneAgent zero-config + Davis AI eliminates manual RCA; Gartner MQ Leader validated; 1,363 G2 reviews | Datadog if 700+ integrations or existing contracts outweigh AI-automation priority |
| Security-first, compliance-mandated | Sysdig | Only platform combining monitoring with CNCF-graduated Falco (February 2024) in one eBPF agent | Open-source Falco + Prometheus/Grafana if budget constraints prohibit Sysdig pricing |
| Existing Prometheus, need to scale | Grafana Labs (Cloud + Mimir) | Prometheus API compatible; migrates dashboards and PromQL queries without rewriting | Amazon Managed Service for Prometheus if already AWS-committed |
| Evaluate commercial options risk-free | New Relic | 100GB/month free tier, full platform access, no credit card or sales call required | Grafana Cloud Free tier |
| Maximum flexibility, zero lock-in | Prometheus (self-hosted) | CNCF-graduated, Apache 2.0, $0 licensing; PromQL is the cloud-native metrics standard | Grafana Cloud Mimir when self-hosted scaling becomes limiting |
1. Dynatrace: Best for Enterprise Full-Stack Auto-Observability with AI-Driven Root-Cause Analysis
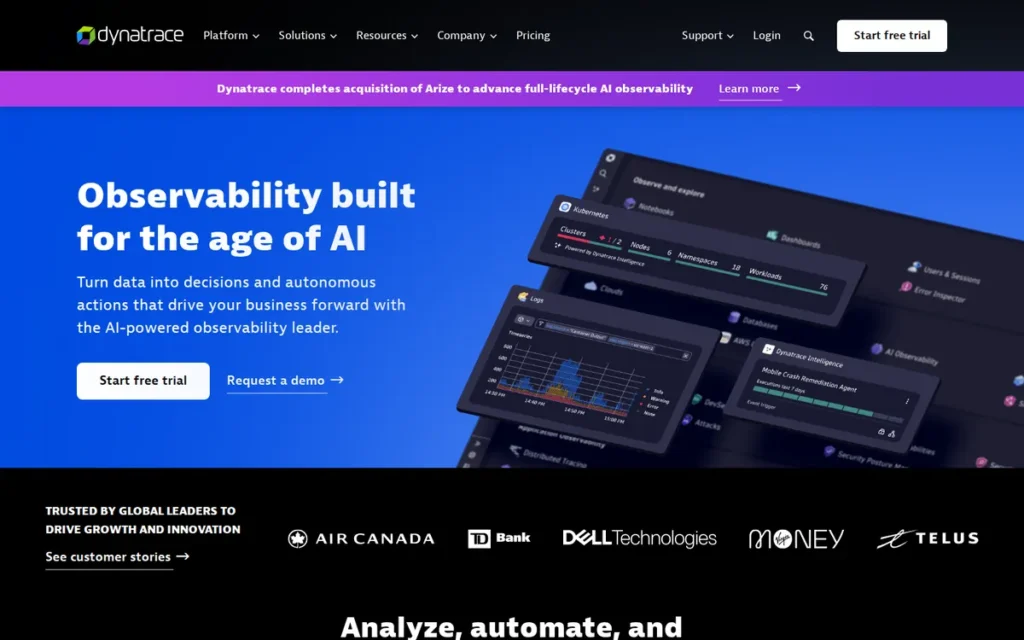
Category: AI-Ops Full-Stack Platform, automatically discovers, instruments, and correlates all observability signals across Kubernetes and container environments using causation-based AI root-cause analysis from a single OneAgent deployment.
At a Glance
- Category: AI-Ops Full-Stack Platform
- Best For: Enterprise and mid-market teams managing complex Kubernetes microservices architectures where alert fatigue and manual root-cause investigation have become measurable operational bottlenecks
- Price Range: ~$21/host/month (Infrastructure Monitoring, 8GB RAM unit); ~$69/host/month (Full-Stack Monitoring, 8GB RAM unit); enterprise contracts custom-priced via sales
- Primary Strength: Dynatrace’s OneAgent auto-instruments the entire application and infrastructure stack from a single Kubernetes DaemonSet deployment, requiring zero manual configuration for full-stack visibility
- Biggest Limitation: Dynatrace’s enterprise sales model and RAM-based DPS pricing make meaningful cost estimation impossible without a sales engagement, effectively excluding small teams and those without procurement bandwidth
- One-Line Summary: Dynatrace is the highest-rated enterprise container monitoring platform on G2 (4.5/5 from 1,363 reviews, June 2026), uniquely combining zero-configuration OneAgent full-stack instrumentation with Davis AI causation-based root-cause analysis for Kubernetes environments
- Last Verified: June 2026
Overview
Dynatrace is a full-stack AI-Ops observability platform purpose-built for enterprise organizations running complex Kubernetes workloads who need automatic discovery, instrumentation, and causation-based root-cause analysis across applications, services, and infrastructure without manual configuration or ongoing tuning. Dynatrace deploys via a single OneAgent that automatically discovers every process, service, and container in a Kubernetes cluster and instruments each without code changes, configuration files, or sidecars, then feeds all signals into Davis AI for deterministic root-cause identification.
Dynatrace holds the highest G2 rating in this comparison at 4.5/5.0 from 1,363 verified reviews (G2, June 2026) and maintains Gartner Magic Quadrant Leader status in APM and Observability for consecutive evaluation cycles. Dynatrace is NYSE-listed (ticker: DT) with approximately $1.97B in annual recurring revenue (FY2025, Dynatrace investor relations) and approximately 4,400 employees.
Key Features
- OneAgent Zero-Config Deployment: Dynatrace deploys as a single Kubernetes DaemonSet and automatically instruments every process, application runtime, and container across the cluster without code changes, sidecar containers, or manual configuration files, covering both Kubernetes Platform Monitoring for cluster-level visibility and Full-Stack Monitoring for application instrumentation.
- Davis AI Causation-Based Root-Cause Analysis: Dynatrace’s Davis AI continuously learns normal performance baselines across the full cluster topology and produces deterministic root-cause answers (naming the specific pod, node, or service responsible for degradation with a timestamp) rather than generating correlated alert streams that humans must triage (Diginomica, 2024). This causation-based model distinguishes Dynatrace architecturally from all other platforms in this comparison.
- Smartscape Live Dependency Mapping: Dynatrace Smartscape maps live component dependencies across all Kubernetes namespaces, nodes, services, and processes in real time, automatically maintaining an always-current topology that enables instant blast-radius identification when any component fails (Statsig Perspectives, 2024).
- Full-Stack Signal Coverage: Dynatrace provides unified coverage spanning infrastructure metrics, APM traces, log ingestion, digital experience monitoring, and runtime security capabilities from a single console, with no per-signal tool switching required.
- DPS Tiered Instrumentation: Dynatrace’s Kubernetes Platform Monitoring tier provides cluster-level visibility into namespaces, workloads, pods, and containers, while Full-Stack Monitoring adds deep application instrumentation under the DPS consumption model, enabling teams to pay only for the depth they instrument (Dynatrace docs).
Best For
Dynatrace is best for enterprise and mid-market organizations running mission-critical Kubernetes workloads where the engineering cost of alert triage, manual root-cause investigation, and monitoring configuration has become a measurable operational burden. Teams that have spent weeks configuring Datadog Auto-Discovery rules for 15 microservices will understand the operational significance of Dynatrace’s OneAgent: equivalent full-stack visibility deploys in the time it takes the DaemonSet to roll out, the most consistently cited reason in Dynatrace user reviews for switching from Datadog despite the higher unit cost.
Pricing
Dynatrace pricing (verified June 2026) uses the DPS consumption model. Infrastructure Monitoring costs approximately $21/month per 8GB RAM host unit; Full-Stack Monitoring costs approximately $69/month per 8GB RAM host unit. A 10-node Kubernetes cluster with 16GB RAM per node on Full-Stack costs approximately $1,380/month before logs, security, or digital experience modules.
Enterprise contracts require sales engagement; list prices represent starting points and negotiated rates at committed consumption are typically lower at volume. Direct pricing: dynatrace.com/pricing.
Strengths
- Dynatrace holds the highest G2 rating among all seven tools in this comparison at 4.5/5.0 from 1,363 verified reviews (G2, June 2026) (the largest commercial sample in this evaluation) with consistent user praise for automatic discovery, the zero-configuration OneAgent experience, and Davis AI’s measurable reduction of alert fatigue in production microservices environments.
This aligns with independent practitioner assessments on r/Observability:
“Dynatrace is probably the best ‘day-1 value’ platform if your stack is supported. OneAgent gives you: fast service discovery, dependency mapping, baselines, topology-driven RCA. Their causal model (Davis) works well when coverage is strong and the dependency graph is accurate. Where teams underestimate effort: fixing service naming / boundaries, tagging ownership + management zones, controlling log ingestion + cost, Kubernetes edge cases (webhook injection, redeploy requirements, etc.). You can be ‘seeing things’ in hours, but being ‘incident-fast’ takes some real design work.” Posted by u/Zeavan23
Takeaway: Practitioners independently confirm Dynatrace’s OneAgent delivers genuine day-one topology visibility and causation-based RCA, while simultaneously validating the article’s “Underestimated Onboarding Depth” limitation, production incident-response speed requires configuration investment well beyond the initial DaemonSet rollout.
- Dynatrace maintains Gartner Magic Quadrant Leader positioning in APM and Observability for consecutive evaluation cycles, confirming enterprise procurement fitness for Fortune 500 RFP processes independently of vendor marketing.
- Dynatrace is deployed in production at BMW, Delta Air Lines, Bank of America, and SAP, organizations with strict regulatory and reliability requirements that independently validate Dynatrace’s fitness for mission-critical Kubernetes workloads at maximum scale (Dynatrace enterprise positioning materials and third-party industry coverage, 2024).
- Dynatrace is a NYSE-listed public company (ticker: DT) with approximately $1.97B in annual recurring revenue (FY2025, Dynatrace investor relations) and approximately 4,400 employees, providing the financial stability and R&D investment that enterprise procurement committees require for long-term multi-year platform commitments.
Limitations
- Cost Accessibility: Dynatrace’s RAM-based DPS pricing model requires sales engagement for any meaningful cost estimate, a 10-node Full-Stack cluster can exceed $1,300/month before logs and security are enabled, pricing out teams with fewer than 20–30 hosts or without dedicated procurement bandwidth.
- Enterprise Contract Scale: Dynatrace’s enterprise contracts routinely reach six figures annually, limiting practical access to organizations with dedicated platform engineering and finance functions capable of navigating multi-year committed consumption agreements.
- Underestimated Onboarding Depth: Dynatrace’s “zero-configuration” narrative understates the learning curve, while OneAgent deploys without code changes, optimizing Davis AI anomaly models, managing Smartscape topology accuracy, and configuring Full-Stack feature flags across large clusters requires experienced Dynatrace administrators.
“Dynatrace was described by users as the choice for ‘full-stack observability with automatic root-cause analysis’ but consistently noted it was priced out of reach for small teams and startups.” (r/devops community discussion)
Takeaway: Community feedback consistently frames Dynatrace as the platform teams “graduate to” after outgrowing Datadog or Prometheus, validating its enterprise positioning but confirming it is rarely a first purchase and almost never the right fit for teams with fewer than 20 hosts.
- SMB Inaccessibility: Dynatrace’s limited self-serve evaluation path makes it effectively inaccessible for teams that need to validate cost-to-value before entering a sales conversation, a stark contrast with Sematext’s no-credit-card free trial and Grafana Cloud’s genuinely usable free tier.
Verdict
Dynatrace is the highest-rated container monitoring platform in independent review data (4.5/5.0 G2 from 1,363 reviews, June 2026) and the only tool in this comparison that combines zero-configuration full-stack instrumentation with causation-based AI root-cause analysis, providing the strongest aggregate evidence profile of any platform in this evaluation for enterprise Kubernetes environments where MTTR reduction and alert fatigue elimination justify the premium. Dynatrace earns the top ranking because its combination of verified review quality, zero-config operational advantage, and consecutive Gartner Magic Quadrant Leader positioning is unmatched by any other tool in this comparison. Teams with fewer than 20 hosts, without dedicated platform engineering capacity, or with budget constraints should evaluate Grafana Labs or Sematext before engaging Dynatrace’s enterprise sales process.
2. Grafana Labs: Best for Cost-Transparent Full-Stack Observability Across All Team Sizes

Category: Open-Source + Managed Observability Stack, a composable LGTM platform (Loki, Grafana, Tempo, Mimir) available as self-hosted open source or fully managed SaaS with the most transparent pay-as-you-go pricing model in this comparison.
At a Glance
- Category: Open-Source + Managed Observability Stack
- Best For: Teams at any size seeking unified metrics, logs, and traces with maximum pricing transparency and open-source flexibility, from solo engineers on the free tier to mid-market teams on pay-as-you-go to enterprises wanting Prometheus-compatible managed scale
- Price Range: Free ($0, 10k active series, 50GB logs/month); Pro ~$8/1,000 active series/month + $0.50/GB logs + $0.50/GB traces; Enterprise from ~$25,000/year
- Primary Strength: Grafana Labs provides the broadest observability coverage in the open-source ecosystem (Loki + Grafana + Tempo + Mimir + Beyla) with the most predictable and transparent commercial pricing in this comparison
- Biggest Limitation: Grafana’s self-hosted LGTM stack is operationally equivalent to managing a small PaaS, with each component requiring its own scaling strategy and maintenance; teams without dedicated platform engineering capacity should use Grafana Cloud rather than self-hosting
- One-Line Summary: Grafana Labs delivers full-stack container observability at approximately 60–70% lower cost than comparable Datadog deployments (verified June 2026), uniquely combining a transparent pay-as-you-go pricing model with native coverage of metrics, logs, traces, and eBPF instrumentation via Beyla across a single LGTM architecture
- Last Verified: June 2026
Overview
Grafana Labs is an open-source-first observability company offering both self-hosted and managed SaaS versions of its LGTM stack (comprising Loki for log aggregation, Grafana for visualization, Tempo for distributed tracing, and Mimir for horizontally scalable metrics storage) for DevOps and SRE teams that need unified observability across Kubernetes workloads at transparent, predictable cost without enterprise sales engagement. Grafana Labs holds a 4.4/5.0 G2 rating from 400+ reviews (Capterra, June 2026).
Grafana Labs raised $240 million in a Series D round in April 2022 (valuing the company at $3 billion at that time) and subsequently raised an additional $270 million in August 2024, boosting its valuation to over $6 billion [Datanami, August 2024]. Grafana Labs also maintains Beyla, an open-source eBPF-based auto-instrumentation project providing zero-code application observability, closing the zero-instrumentation gap that previously required purchasing a commercial platform.
Key Features
- Grafana Cloud LGTM Stack: Grafana Cloud provides a unified managed SaaS platform built on Loki for logs, Grafana for visualization, Tempo for traces, and Mimir for scalable metrics, with a free tier providing 10,000 active series and 50GB each of logs and traces per month at no cost (grafana.com/pricing).
- Grafana Mimir Horizontal Scalability: Grafana Mimir, the metrics backend for Grafana Cloud, horizontally scales to 1 billion active series, announced and documented in the Grafana Mimir launch post (Grafana Labs blog, March 2022), with full Prometheus API compatibility, enabling migration from self-hosted Prometheus without rewriting a single PromQL query or rebuilding existing dashboards.
- Grafana Beyla eBPF Auto-Instrumentation: Grafana Beyla is an open-source eBPF-based auto-instrumentation project that automatically discovers service endpoints, measures RED metrics (Rate, Errors, Duration), and generates traces for Kubernetes workloads without modifying application code or deploying language-specific agents.
- Seamless Prometheus Migration Path: Grafana Labs supports migration from self-hosted Prometheus to Grafana Cloud while retaining existing PromQL queries, Prometheus exporters, and Grafana dashboard configurations, the only platform in this comparison offering a no-rewrite upgrade path for Prometheus users hitting self-hosted scale limits.
- 50+ Native Data Source Integrations: Grafana’s visualization layer natively integrates 50+ data sources and hundreds of community plugins, making it usable as a unified dashboard layer even in heterogeneous stacks that include Datadog, Elasticsearch, or InfluxDB alongside Prometheus-compatible metrics.
Best For
Grafana Labs is best for teams that want maximum observability coverage at minimum predictable cost and maximum flexibility, including small DevOps teams starting on the free tier, mid-market organizations that have outgrown self-hosted Prometheus but refuse Datadog pricing, and enterprise platform teams wanting open-source control with managed scalability and a clear no-rewrite migration path.
Pricing
Grafana Cloud pricing (verified June 2026): Free tier at $0/month covers 10,000 active metrics series, 50GB logs, 50GB traces, and 50GB profiles. Pro pay-as-you-go costs approximately $8 per 1,000 active metrics series/month, $0.50/GB for logs, and $0.50/GB for traces.
A mid-size Kubernetes cluster generating 100,000 active series, 200GB logs, and 100GB traces costs approximately $900/month, approximately 60–70% less than a comparable Datadog deployment at the same scale (comparison basis: Datadog Infrastructure Pro $15/host × 10 hosts + Log Management $0.10/GB × 200GB + APM Pro $31/host × 10 hosts, verified June 2026 at datadoghq.com/pricing and grafana.com/pricing). Enterprise pricing starts around $25,000/year. Direct pricing: grafana.com/pricing.
Strengths
- Grafana Cloud deployments at mid-scale, 100,000 active series, 200GB logs, 100GB traces, cost approximately $900/month (verified June 2026), representing 60–70% savings versus a comparable Datadog configuration, making Grafana Labs the strongest verified price-to-coverage ratio among commercial SaaS platforms in this comparison.
- Grafana Labs reached a $6 billion+ valuation following a $270 million funding round in August 2024 [Datanami, August 2024] (backed by a prior $240 million Series D in April 2022) confirming institutional confidence in the LGTM stack as a long-term commercial platform with active CNCF project maintenance for Grafana, Loki, Tempo, Mimir, and Beyla.
- Grafana Beyla provides open-source eBPF-based zero-code instrumentation generating RED metrics and distributed traces without modifying application code, a capability that previously required purchasing New Relic, Sysdig, or another commercial eBPF platform, now available at no licensing cost.
- Grafana Mimir’s Prometheus API compatibility means the 40.8% of organizations already running Prometheus in production (CNCF Annual Survey 2024) can migrate to Grafana Cloud’s billion-series scalable backend without rewriting a single PromQL query or rebuilding existing dashboards.
Users on r/sre shared their experience:
“I have not found anything that does multiple sources as well as Grafana. We consolidate multiple sources across private and public cloud with a self hosted enterprise solution. At GrafanaCon, Grafana said they are investing heavily in their Grafana cloud solution and some features won’t be cascaded down to their self hosted offerings which adds operational and financial risk of relying on a third party for critical operations.” Posted by u/-jlo3-
Takeaway: Enterprise SREs managing multi-cloud heterogeneous stacks independently identify Grafana’s multi-source flexibility as category-leading, though the same practitioner flags a meaningful roadmap risk: self-hosted Grafana deployments may progressively lose feature parity as Grafana Labs concentrates investment in the managed cloud offering.
Limitations
- Self-Hosted Operational Complexity: Grafana’s full LGTM stack: Grafana plus Mimir plus Loki plus Tempo, is operationally equivalent to managing a small PaaS, with each component requiring its own scaling strategy, storage backend configuration, and upgrade maintenance cycle.
“Metrics in Prometheus, APM in [one tool], errors in Sentry, context switching nightmare.” (r/devops practitioner, r/devops, 2025)
Takeaway: Community feedback confirms that teams self-hosting the LGTM stack without dedicated platform engineering capacity frequently end up with a fragmented, partially functional observability setup, Grafana Cloud is the recommended path for teams without that engineering bandwidth.
- Cloud Cost vs. Self-Hosted Free: Grafana Cloud’s cost premium versus fully self-hosted is real for teams with strong Kubernetes expertise, the approximately $900/month Grafana Cloud cost versus near-zero self-hosted cost is meaningful for budget-constrained teams, even though the Cloud option is substantially cheaper than Datadog.
- Alert Configuration Learning Curve: Grafana’s alert configuration is consistently cited in reviews as less intuitive than the visualization layer (Capterra, June 2026), with less experienced teams reporting difficulty building effective Grafana alert rules compared to more opinionated commercial platforms like Dynatrace or Sematext.
- Dashboard Creation Complexity: Grafana’s dashboard creation rewards deep expertise, and less experienced DevOps teams consistently report the initial setup as overwhelming compared to platforms with prescriptive out-of-the-box experiences, a friction point for teams without dedicated Grafana experience on staff.
Users on r/sre noted:
“Depends who creates the dashboards. In a 1000 person company we used Grafana originally but very few of the wider teams created dashboards themselves as they found it too hard. Eventually, the 2 guys looking after the LGTM stack left and the company moved to DataDog. With zero training, the uptake of the tool by all teams has been night and day difference, dashboards (quality ones) for every teams and self service. I love how powerful Grafana is but for end user ease of use, DataDog no question.” Posted by u/andyr8939
Takeaway: Real-world enterprise deployments confirm that Grafana’s dashboard creation complexity creates a practical adoption ceiling tied directly to individual personnel, when LGTM specialists leave, organizations without Grafana-fluent replacements face involuntary platform migration rather than a viable upskilling path.
Verdict
Grafana Labs is the strongest all-around value in container monitoring for teams that prioritize cost transparency and open-source flexibility, combining the most predictable commercial pricing in this comparison (approximately 60–70% cheaper than Datadog at mid-scale, verified June 2026) with genuine full-stack observability coverage across metrics, logs, traces, and eBPF instrumentation via Beyla. Grafana Labs ranks #2 overall because it serves the widest audience spectrum in this comparison (from solo engineers on the free tier to enterprise platform teams on Grafana Cloud Enterprise) with a clear upgrade path that never requires rewriting Prometheus queries or rebuilding dashboards. Teams choosing between Grafana Labs and Dynatrace are choosing between cost-transparent observability engineering and premium AI-automated operations: the decision should hinge on whether Davis AI’s automated root-cause analysis is worth Dynatrace’s pricing premium for their specific MTTR and alert-fatigue situation.
3. Datadog: Best for Feature Breadth and Integration Depth in Enterprise Teams That Can Manage Cost at Scale
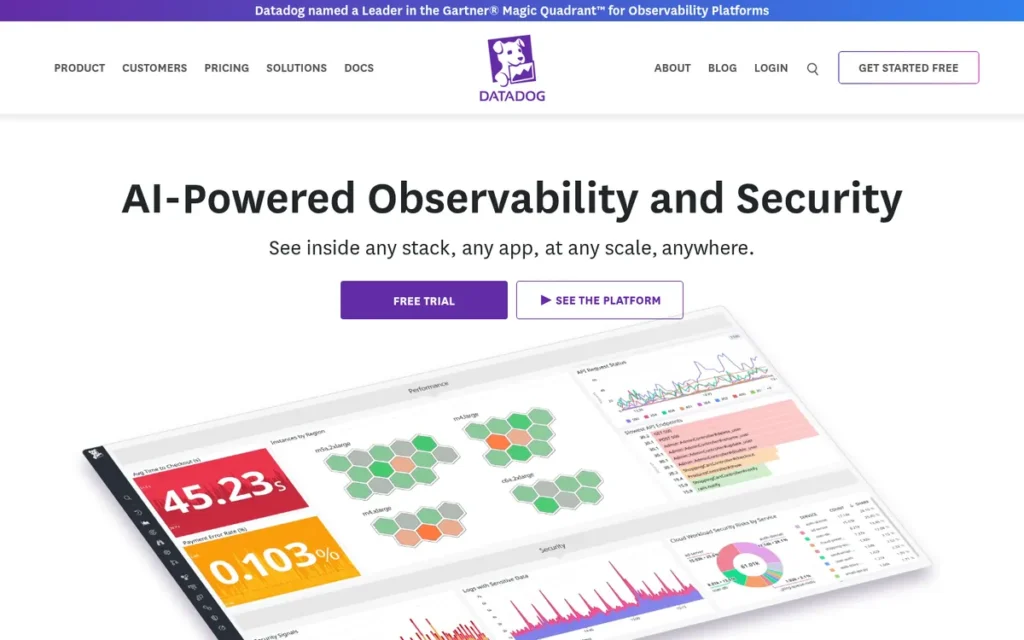
Category: Enterprise SaaS Observability Platform, a unified commercial SaaS covering infrastructure monitoring, APM, log management, distributed tracing, container monitoring, and security in a modular per-product subscription structure with automatic Kubernetes container discovery.
At a Glance
- Category: Enterprise SaaS Observability Platform
- Best For: Enterprise and mid-market teams needing the widest integration footprint and full-stack observability from a single SaaS vendor, with the procurement bandwidth to negotiate annual contracts that control per-module cost at scale
- Price Range: Infrastructure Free ($0, up to 5 hosts); Infrastructure Pro $15/host/month annual; APM Pro $31/host/month; Log Management $0.10/GB ingested + $1.70/million indexed; container add-on $0.002/container/hour beyond included allotments
- Primary Strength: Datadog provides the most comprehensive integration ecosystem in this comparison (700+ integrations) with automatic Kubernetes container discovery and full-stack observability (metrics, logs, traces, and security) from a single SaaS deployment
- Biggest Limitation: Datadog’s modular per-product pricing creates unpredictable bills at scale, with real-world production deployments running 5–10x the headline per-host price; OpenTelemetry-derived metrics are billed as custom metrics at additional cost
- One-Line Summary: Datadog is the market-leading enterprise container monitoring SaaS by revenue ($2B+ ARR as of 2026) with the broadest integration ecosystem (700+) in the category, but carries the highest billing unpredictability risk in this comparison for teams enabling APM, logs, and OpenTelemetry simultaneously
- Last Verified: June 2026
Overview
Datadog is a unified enterprise SaaS observability platform founded in 2010 and publicly traded on NASDAQ (DDOG), providing full-stack container and Kubernetes monitoring (including infrastructure metrics, APM, log management, distributed tracing, and runtime security) from a single pane of glass for DevOps and SRE teams at mid-market to enterprise scale. Datadog holds a 4.3/5.0 G2 rating from 1,000+ verified reviews (G2, June 2026), maintains Gartner Magic Quadrant Leader status in APM and Observability alongside Dynatrace, and offers the most comprehensive integration ecosystem in this comparison at 700+ supported technologies.
Datadog’s most consistently documented community concern is billing unpredictability. Real-world r/devops examples show $7,000/month for 70–80 fully loaded hosts. OpenTelemetry-derived metrics are billed as custom metrics at $5 per 100 custom metrics per month above plan allotments (Signoz analysis, 2024), structurally increasing costs for teams adopting OTel as a vendor-neutral collection layer.
Key Features
- Auto-Discovery for Dynamic Kubernetes Environments: Datadog’s Auto-Discovery automatically applies monitoring configuration templates to containers when they are created or destroyed in Kubernetes, eliminating manual reconfiguration for every new service deployment in environments where pods are continuously scheduled and terminated (Datadog blog).
- Unified DaemonSet Agent with Cross-Signal Correlation: Datadog’s Agent deploys as a Kubernetes DaemonSet and automatically correlates infrastructure metrics from the Kubernetes API server and kubelet, APM traces, and log streams into a unified dashboard without per-signal context switching.
- Bits AI Kubernetes Remediation: Datadog’s Bits AI Kubernetes Remediation provides AI-assisted automation of end-to-end Kubernetes incident response workflows, extending Datadog into AIOps territory alongside Dynatrace’s Davis AI (Datadog Container Monitoring).
- 700+ Integration Ecosystem: Datadog’s integration ecosystem covers 700+ technologies (the most broadly compatible coverage in this comparison) including all major cloud providers, databases, message queues, CI/CD pipelines, and third-party SaaS platforms, enabling monitoring of heterogeneous enterprise technology stacks from a single deployment.
- Partial eBPF Capability: Datadog provides eBPF-based visibility for network performance monitoring and container runtime inspection, reducing the need for additional instrumentation in targeted Kubernetes networking observability scenarios.
Best For
Datadog is best for enterprise and mid-market organizations that need the widest possible integration footprint, the fastest path to full-stack observability without assembling open-source components, and have the procurement bandwidth to negotiate annual contracts that control the per-module pricing structure at 50+ host scale.
Pricing
Datadog pricing (verified June 2026, list prices): Infrastructure Free $0/month up to 5 hosts; Infrastructure Pro $15/host/month billed annually; Infrastructure Enterprise $23/host/month. APM Pro $31/host/month; Enterprise $40/host/month. Log Management: $0.10/GB ingested, $1.70/million log events indexed. Container add-on: $0.002/container/hour beyond included allotments (5 containers/host on Pro, 10 on Enterprise).
A critical non-obvious cost multiplier: OpenTelemetry-derived metrics are billed as custom metrics at $5 per 100 custom metrics per month above plan allotments (Signoz analysis, 2024). Teams can calculate exposure at datadoghq.com/pricing before commitment. A documented r/devops example shows $7,000/month for 70–80 fully loaded hosts, representing over $90/host/month. Direct pricing: datadoghq.com/pricing.
Strengths
- Datadog is the most financially scaled pure-play observability vendor in this category with $2B+ annual recurring revenue, NASDAQ listing (DDOG, IPO September 2019), and 6,000+ employees, providing the largest enterprise support organization and fastest integration development velocity of any platform in this comparison.
- Datadog’s 700+ integrations represent the most broadly compatible technology coverage in this comparison, validated independently by Gartner Magic Quadrant Leader recognition in APM and Observability alongside Dynatrace for consecutive evaluation cycles.
- Datadog’s Auto-Discovery capability automatically applies monitoring configurations when Kubernetes pods are created or destroyed, eliminating the manual reconfiguration burden cited as a top operational pain point for dynamic container environments running hundreds of short-lived workloads.
- Datadog holds a 4.3/5.0 G2 rating from 1,000+ verified reviews (G2, June 2026), with consistent praise for developer self-service dashboarding, cross-signal correlation across metrics, logs, and traces, and the platform’s ability to empower non-technical stakeholders to build their own monitoring views.
This aligns with community sentiment on r/devops:
“Over all the log and APM products are really really good. If you integrate AWS, the platform let’s you see what’s happening in you system (host metrics vs traces vs application logs vs aws service metrics) in a really easy to use interface. IMO that’s the most powerful part of the Datadog. The Datadog docs are good too, never worked with agents before and it was quick and easy to get it up and running. Worst parts of Datadog; Costs, I frequently see ingest delays” Posted by u/Dotnet_Aws_guy
Takeaway: Datadog’s cross-signal correlation (viewing host metrics alongside APM traces and logs in a single interface) is consistently cited by practitioners as its most differentiating real-world capability, validating the 700+ integration ecosystem strength even among users who list cost and ingest delays as the platform’s primary drawbacks.
Limitations
- Billing Unpredictability at Scale: Datadog’s modular per-product pricing creates a cost multiplication effect where APM, Log Management, Application Security, and Network Performance Monitoring each carry separate per-host charges, real-world fully-loaded deployments regularly land 5–10x the headline per-host rate, with the headline $15/host rate representing only the infrastructure monitoring base.
“Paying around $7,000 USD per month for around 70–80 hosts with APM, logging, a shit-ton of integrations, sensitive data scanner that saved our bacon twice, and application security management.”, a since-deleted account, r/devops, 2023
Takeaway: This real-world billing example shows a fully-loaded per-host cost exceeding $90/month versus Datadog’s $15/host headline, a 6x multiplier that confirms the 5–10x billing unpredictability documented above and validates that custom metric charges and container add-ons are common production outcomes, not edge cases.
- OTel Custom Metric Penalty: Datadog bills OpenTelemetry-derived metrics as “custom metrics” at $5 per 100 custom metrics per month above plan allotments (Signoz, 2024), meaning teams adopting OTel as a vendor-neutral collection layer to reduce vendor lock-in actually see Datadog bills increase, the direct opposite of OTel’s intended cost-reduction purpose. Every OTel tag combination creates a new billable custom metric line, multiplying costs rapidly in label-rich Kubernetes environments.
- Container Add-On Complexity: Datadog’s container add-on charges $0.002/container/hour beyond the included per-host allotment, adding non-obvious per-hour billing that surprises teams running high-density Kubernetes workloads with many short-lived pods per node.
- Scale Dependency on Negotiation: Datadog’s effective pricing at enterprise scale requires negotiated annual contracts, teams without procurement capacity to negotiate committed spend face list prices that make Grafana Cloud approximately 60–70% cheaper for equivalent mid-scale Kubernetes coverage.
Verdict
Datadog is the market-leading enterprise container monitoring platform by revenue and integration breadth, and the correct choice for organizations needing 700+ technology integrations, automatic Kubernetes discovery, and full-stack observability from a single SaaS vendor with the procurement capacity to manage its modular pricing structure. Datadog ranks #3 in this independent evaluation (below Dynatrace on review quality and zero-config operational efficiency, and below Grafana Labs on pricing transparency) because its billing unpredictability directly contradicts the target audience’s most frequently cited pain point. Teams adopting OpenTelemetry must specifically account for Datadog’s custom metric classification of OTel-derived data before projecting costs, as this creates a structural cost increase that contradicts OTel’s vendor-neutral promise.
4. Sematext: Best for Small-to-Mid DevOps Teams Needing Full-Stack Observability at a Predictable, Self-Service Price
Category: Lightweight Full-Stack Monitoring Platform, a unified metrics, logs, distributed traces, synthetic monitoring, and real user monitoring SaaS targeting small-to-mid DevOps teams with transparent per-host pricing and the lowest operational overhead among commercial platforms in this comparison.
At a Glance
- Category: Lightweight Full-Stack Monitoring Platform
- Best For: Small-to-mid DevOps teams of 1–25 engineers running containerized workloads on Docker, Kubernetes, Docker Swarm, or Nomad who need unified metrics, logs, and traces at a predictable self-service price without enterprise sales engagement
- Price Range: Free (limited capabilities); Standard tier; Pro tier: see sematext.com/pricing for current rates (verified June 2026); 14-day free trial, no credit card required
- Primary Strength: Sematext delivers unified metrics, logs, traces, and real user monitoring from a single lightweight Kubernetes DaemonSet agent at the lowest published per-host commercial pricing in this comparison (verified June 2026)
- Biggest Limitation: Sematext’s integration ecosystem at 50+ technologies is substantially smaller than enterprise alternatives, making it a poor fit for organizations with complex or proprietary third-party technology stacks requiring broad coverage
- One-Line Summary: Sematext is the most affordable full-stack container monitoring SaaS in this comparison, with self-service Pro pricing significantly cheaper than comparable Datadog tiers (verified June 2026 at sematext.com/pricing), providing unified metrics, logs, and traces from a single lightweight Kubernetes DaemonSet agent with a no-credit-card 14-day free trial
- Last Verified: June 2026
Overview
Sematext is a full-stack observability SaaS for containerized environments founded in 2010 in Brooklyn, New York, offering unified metrics, logs, distributed traces, synthetic monitoring, and real user monitoring from a single lightweight agent for small-to-mid DevOps teams that need production-grade observability without enterprise pricing or sales engagement. Sematext offers one of the lowest published per-host prices among commercial platforms in this comparison, see current rates at sematext.com/pricing, and the platform provides a 14-day free trial with no credit card required (verified June 2026).
Sematext was featured on kubernetes.io, the official Kubernetes project blog (kubernetes.io, 2016), for its container logging and monitoring approach. Sematext was founded by Otis Gospodnetić, co-author of “Lucene in Action” and recognized Apache Lucene expert, a technical background that directly explains the platform’s log search and indexing depth relative to competitors whose log management was added as a secondary feature.
Key Features
- Single DaemonSet Agent with Auto-Discovery: Sematext Agent deploys as a Kubernetes DaemonSet or Docker container and automatically discovers containers across Kubernetes, Docker Swarm, Amazon ECS, Nomad, and Rancher, providing unified metrics, logs, and events with automatic log parsing, PII masking, Geo-IP enrichment, and pattern detection built in (Sematext docs).
- Unified Observability Without Module Pricing: Sematext Cloud unifies infrastructure metrics, log aggregation, distributed tracing, synthetic monitoring, and real user monitoring in a single platform with no per-signal add-on pricing, a deliberate product design that directly contrasts with Datadog’s modular per-capability billing structure.
- Built-In Log Anomaly Detection: Sematext provides automatic log pattern detection and anomaly detection across all container log streams, reducing the manual alert rule authoring burden that practitioners consistently identify as a significant operational time cost in dense microservices environments.
- 14-Day Free Trial, No Credit Card Required: Sematext’s no-credit-card free trial provides full hands-on platform evaluation without sales engagement or procurement overhead, making Sematext the most friction-free commercial evaluation experience for self-service buyers in this comparison.
- Non-Standard Runtime Support: Sematext supports Docker Swarm, Nomad, and Amazon ECS in addition to all major Kubernetes distributions including EKS, AKS, GKE, OpenShift, and self-managed clusters, covering non-standard container environments that enterprise-focused platforms frequently deprioritize (Sematext capabilities).
Best For
Sematext is best for small-to-mid DevOps teams of 1–25 engineers running Docker or Kubernetes workloads who need a complete metrics plus logs plus traces solution at a predictable self-service price point, particularly teams currently paying for Datadog who are seeking a significant cost reduction without abandoning unified observability.
Pricing
Sematext Infrastructure Monitoring pricing (verified June 2026 at sematext.com/pricing): Sematext offers multiple tiers including a free tier with limited capabilities, a Standard tier, and a Pro tier, with Log Management priced separately per GB per day. Bundled pricing combining infrastructure monitoring and logs is available with discounts. Sematext’s Pro tier is significantly cheaper than Datadog’s comparable Pro tier before APM, log, and container add-ons, see current rates at sematext.com/pricing and datadoghq.com/pricing for a direct comparison. The 14-day free trial requires no credit card. Direct pricing: sematext.com/pricing.
Strengths
- Sematext was featured on kubernetes.io, the official Kubernetes project blog (kubernetes.io, 2016), for its container monitoring and logging approach, an independent third-party endorsement from the Kubernetes project community that validates platform fitness for cloud-native production environments independently of vendor marketing.
“A great hosted ELK Stack with additional functionalities like RBAC, anomaly detection, alerts on logs is Sematext. I use it for most of my projects as IT consultant.” (u/seti321, r/devops)
Takeaway: Independent IT consultants cite Sematext as a practical managed alternative to self-hosted Elasticsearch, validating the platform’s log management depth beyond the SMB pricing narrative, a use case that extends to professional production deployments across multiple client environments.
- Sematext holds a 4.5/5.0 average G2 rating (GetApp, June 2026), with consistent praise across GetApp and Software Advice reviewers focused on affordability, centralized visibility, and the unified logs-metrics-traces experience, though the 50+ review sample is the smallest in this comparison and should be interpreted with appropriate statistical caution.
- Sematext is the only bootstrapped, self-funded company in this comparison, having operated profitably since 2010 without venture capital or PE ownership, a financial independence that eliminates the acquisition, pivot, and forced-exit risks that contributed to New Relic’s 2023 business disruption.
- Sematext offers a 14-day free trial with no credit card required: a deliberate product decision that removes evaluation friction for self-service buyers and signals Sematext’s confidence in the product experience; no other commercial platform in this comparison matches this combination of no-CC trial and accessible pricing.
Limitations
- Ecosystem Scope: Sematext’s integration ecosystem covers 50+ technologies versus Datadog’s 700+, meaning organizations with complex heterogeneous stacks (particularly those relying on proprietary internal tools, niche databases, or specialized cloud services) will encounter integration gaps that enterprise alternatives cover natively.
- Team and SLA Scale: Sematext operates with approximately 50–100 employees as the smallest commercial vendor in this comparison, which limits enterprise SLA guarantees, 24/7 support coverage depth, and the feature development velocity that larger teams can sustain, a meaningful consideration for organizations with strict uptime SLAs.
“I’ve worked with consultants from Sematext; incredibly skilled and helpful, and quite expensive. In my experience, some shops find the bang-for-buck to be worth the cost, but most smaller shops do not.” (u/StephanXX, r/devops, 2019)
Takeaway: While Sematext’s SaaS platform pricing is among the most affordable in this comparison, professional implementation services are priced at expert market rates, teams should calculate total cost of ownership including any planned consulting engagement separately from the platform subscription before projecting cost savings over Datadog.
- Historical Founder-Marketing Disclosure: A Reddit exchange documented a historical instance of Sematext’s founder promoting the platform in community discussions without clearly disclosing founder status (r/devops, 2019), an editorial transparency event relevant to PlugRoute’s standards, though independent G2, GetApp, and Capterra reviews are separate from this incident and reflect verified user sentiment.
Verdict
Sematext is the most affordable full-stack container monitoring SaaS in this comparison and the optimal choice for small-to-mid DevOps teams seeking unified metrics, logs, and traces at a predictable self-service price, with Pro tier pricing significantly cheaper than Datadog’s comparable tier before APM and log add-ons (see current rates at sematext.com/pricing, verified June 2026). Sematext ranks #4 in this independent evaluation because its integration ecosystem (50+ versus 700+) and team scale limit its fit for large enterprises with complex heterogeneous stacks, but for teams of 1–25 engineers running standard cloud-native workloads on Kubernetes or Docker, Sematext delivers complete observability at a cost that makes enterprise alternatives difficult to justify without specific integration or scale requirements.
5. Prometheus: Best Open-Source Metrics Foundation for Kubernetes-Native Teams with Platform Engineering Capacity
Category: Open-Source Metrics Engine, a pull-based, CNCF-graduated time-series monitoring and alerting toolkit that is the de facto Kubernetes metrics standard, requiring separate components such as Loki for logs and Tempo for traces to form a complete observability stack.
At a Glance
- Category: Open-Source Metrics Engine
- Best For: Kubernetes-native teams with dedicated platform engineering capacity who need maximum flexibility, zero vendor lock-in, and the most widely adopted metrics foundation, and who are prepared to assemble and maintain a complete stack or migrate to a managed Prometheus backend when self-hosted scale limits are reached
- Price Range: Free (self-hosted, Apache 2.0 license); Amazon Managed Prometheus ~$0.90/billion samples ingested; Grafana Cloud Pro managed Prometheus ~$8/1,000 active series/month
- Primary Strength: Prometheus is the CNCF-graduated de facto Kubernetes metrics standard with 86% cloud-native adoption (CNCF Observability Microsurvey, 2022) and zero vendor lock-in, backed by the largest contributor community of any project in this comparison at 1,900+ contributors
- Biggest Limitation: Prometheus is metrics-only natively: logs require Loki, traces require Tempo or Jaeger, and scaling beyond a single node requires adding Thanos or migrating to Grafana Mimir, introducing significant operational complexity
- One-Line Summary: Prometheus is the CNCF-graduated open-source metrics standard with 86% adoption among cloud-native teams (CNCF Observability Microsurvey, 2022) and zero vendor lock-in, but requires separate components for logs and traces and hits vertical memory scaling walls at large cluster sizes that demand Thanos or Mimir as architectural additions
- Last Verified: June 2026
Overview
Prometheus is the CNCF-graduated de facto Kubernetes metrics standard, originally developed at SoundCloud in 2012 and reaching the highest CNCF maturity level in 2018 as the second graduated project after Kubernetes, with 86% adoption among cloud-native teams (CNCF Observability Microsurvey, 2022) and 40.8% production use across organizations (CNCF Annual Survey 2024). Prometheus operates as a pull-based metrics engine, not a full-stack observability platform, requiring separate components for logs, distributed traces, and notification routing to form a complete stack.
Prometheus does not natively collect logs or distributed traces, and large-scale Kubernetes deployments encounter vertical memory scaling limits requiring Thanos or Grafana Mimir as architectural solutions. Prometheus has no commercial owner, no licensing cost, and is governed entirely by the CNCF with 1,900+ community contributors and the Prometheus Operator for Kubernetes-native lifecycle management.
Key Features
- Pull-Based Kubernetes Auto-Discovery: Prometheus uses a pull-based model with built-in Kubernetes service discovery to automatically find and scrape metrics endpoints across all nodes, pods, and services in a cluster, using the Prometheus Operator for Kubernetes-native lifecycle management of scrape targets and alert rules.
- PromQL Multidimensional Queries: Prometheus stores data as multidimensional time-series identified by metric names and key-value label pairs, enabling PromQL queries that filter, aggregate, and compute metrics across any combination of Kubernetes pod labels, namespaces, and deployment selectors.
- 1,900+ Community Exporters: Prometheus integrates with cAdvisor for container resource metrics, node_exporter for host-level metrics, and hundreds of community-maintained exporters covering every major database, message queue, cloud service, and application runtime, the largest exporter ecosystem of any tool in this comparison (Palark analysis, 2022; GitHub repository stats, verified June 2026).
- Alertmanager Notification Routing: Prometheus Alertmanager handles alert deduplication, grouping, inhibition, and notification routing to PagerDuty, Slack, email, and OpsGenie with configurable routing trees and silence management, operating as a separate component from the Prometheus server.
- Managed Backend Compatibility: Amazon Managed Service for Prometheus and Grafana Cloud provide fully managed Prometheus backends with complete Prometheus API compatibility, enabling teams to migrate from self-hosted to managed scale without rewriting PromQL queries, rebuilding Grafana dashboards, or reconfiguring Alertmanager rules.
Best For
Prometheus is best for Kubernetes-native teams with dedicated platform engineering capacity who need the most flexible, community-supported, zero-cost metrics foundation, particularly teams that want to avoid vendor lock-in entirely and are prepared to invest engineering time to assemble a complete observability stack or migrate to a managed Prometheus service when self-hosted scaling becomes limiting.
Pricing
Prometheus software is free under the Apache 2.0 license, $0/month for any number of hosts. Managed service options (verified June 2026): Amazon Managed Service for Prometheus charges $0.90/billion metric samples ingested, $0.003/billion samples stored per month, and $0.01/billion samples queried. Grafana Cloud Pro provides managed Prometheus at approximately $8/1,000 active series/month with a free tier of 10,000 series/month.
A useful rule of thumb from the DevOps community: Prometheus costs approximately $0/month in licensing and approximately one engineer-day per month in operational maintenance for small clusters, scaling to 0.5+ FTE for production multi-cluster deployments with Thanos or Mimir. Teams should compare this time cost against commercial alternatives before concluding that Prometheus is free.
Strengths
- Prometheus has 86% adoption among cloud-native teams per CNCF Observability Microsurvey (2022) and 40.8% production use per CNCF Annual Survey 2024, the highest verified community adoption figure of any tool in this comparison by a substantial and documented margin, supported by 1,900+ contributors and 50,000+ GitHub stars (Palark analysis, 2022; GitHub repository stats, verified June 2026).
- Prometheus graduated from the CNCF in 2018 as the second project after Kubernetes itself, a maturity designation confirming production-readiness, security governance practices, and institutional ecosystem stability independent of any single commercial vendor.
- Prometheus has zero vendor lock-in: Apache 2.0 licensed with no commercial controller, compatible with every major managed backend including Amazon AMP, Grafana Cloud Mimir, and Thanos, with PromQL and the Prometheus data model now treated as industry standards that all major commercial platforms support.
- Prometheus eliminates software licensing cost entirely for self-hosted deployments, a 100-node Kubernetes cluster running Prometheus pays $0 in tool licensing, with real costs arising only from infrastructure provisioning or optional managed service adoption.
Limitations
- Scope Limitation: Metrics Only: Prometheus is a metrics engine, not a full-stack observability platform. Teams deploying Prometheus alone for container monitoring still need:
- Loki or an equivalent log aggregation component for log management.
- Tempo, Jaeger, or an equivalent tracing backend for distributed tracing.
- Alertmanager for notification routing and silence management.
“Starting with a cluster is easy, as long as it isn’t very big… Vertical scale can easily reach the limit within a node in a K8s cluster.”, original author, r/kubernetes
Takeaway: The scaling wall is not a theoretical concern, practitioners at companies with 10+ node clusters and high-cardinality Kubernetes workloads encounter it as a production failure mode, making the Thanos or Mimir architectural addition a near-certainty for growing deployments rather than an optional enhancement.
- Vertical Memory Scaling Wall: Standalone Prometheus hits vertical memory limits on large clusters (a commonly encountered production failure mode documented in community discussions) with high-cardinality Kubernetes label sets from dynamic pod workloads creating storage and query performance degradation that requires architectural intervention.
- Thanos/Mimir Operational Overhead: The community-accepted solution to Prometheus’s scale limitations is adding Thanos for multi-cluster high availability and long-term storage (r/kubernetes), or migrating to Grafana Mimir, both introducing additional components with their own operational overhead and maintenance cycles.
- No Commercial Support SLA: Prometheus has no commercial entity behind it, meaning enterprise teams running Prometheus at scale have no vendor-accountable support SLA and must rely on CNCF community forums, cloud provider managed services, or Grafana Labs for production-level support escalation.
Verdict
Prometheus is the CNCF-graduated open-source metrics standard that underpins most Kubernetes observability deployments, with 86% cloud-native adoption (CNCF Observability Microsurvey, 2022) and zero vendor lock-in, and the correct foundation choice for Kubernetes teams with platform engineering capacity who prioritize flexibility and cost control over operational simplicity. Teams choosing Prometheus are choosing maximum flexibility and community trust at the cost of operational assembly time, the correct trade-off for platform engineers, and the wrong trade-off for teams without them. Prometheus ranks #5 in this independent evaluation not as a quality limitation but as a scope reflection: assembling the full-stack observability that the target audience needs requires Prometheus alongside Loki, Tempo, Grafana, and potentially Thanos or Mimir, a complete solution that Grafana Labs and Sematext deliver with substantially lower operational overhead for teams without dedicated platform engineering bandwidth.
6. New Relic: Best for APM-Centric Teams Already Invested in the Ecosystem, With Caution on Long-Term Vendor Stability
Category: Unified SaaS Observability Platform, a full-stack commercial SaaS covering APM, infrastructure monitoring, Kubernetes observability, distributed tracing, and log management with an ingest-based pricing model and unique eBPF Kubernetes visibility via Pixie.
At a Glance
- Category: Unified SaaS Observability Platform
- Best For: APM-centric teams already using New Relic who want to extend into Kubernetes monitoring, and small teams wanting to evaluate full-featured commercial observability via the 100GB/month free tier before committing to paid ingest
- Price Range: Free (100GB/month data ingest, 1 full platform user); Standard/Pro ~$0.40/GB beyond free + ~$49/month per Core user; Enterprise custom-priced
- Primary Strength: New Relic’s Pixie eBPF integration provides zero-code Kubernetes observability (capturing live HTTP requests, database queries, and service latency) without modifying application code, a native capability unique among commercial platforms in this comparison
- Biggest Limitation: New Relic’s November 2023 acquisition by private equity firms Francisco Partners and TPG, combined with subsequent workforce restructuring (post-restructuring headcount estimated at approximately 2,000 employees by industry observers [Signoz, 2024]) represents a material procurement risk for teams evaluating a long-term observability platform commitment
- One-Line Summary: New Relic is a unified SaaS observability platform uniquely providing eBPF-based zero-code Kubernetes visibility via its Pixie integration and a 100GB/month free tier, but carries elevated vendor stability risk following its November 2023 private equity acquisition and workforce restructuring
- Last Verified: June 2026
Overview
New Relic is a unified SaaS observability platform founded in 2008 by Lew Cirne in San Francisco, offering full-stack Kubernetes monitoring, including APM, infrastructure metrics, distributed tracing, log management, and eBPF-based zero-code Kubernetes observability via Pixie, for DevOps and SRE teams seeking a single-platform alternative to fragmented tool stacks. New Relic holds a 4.3/5.0 G2 rating from 900+ reviews (G2, June 2026) and offers a 100GB/month free tier with full platform access, the most accessible commercial evaluation path in this comparison.
New Relic was publicly traded on NYSE until November 2023, when it was acquired by private equity firms Francisco Partners and TPG at approximately $6.5 billion. Post-restructuring headcount has not been independently verified and is estimated at approximately 2,000 employees by industry observers (Signoz, 2024). This business transition is a material vendor stability consideration that enterprise procurement teams must factor into long-term platform commitment decisions.
Key Features
- Kubernetes Cluster Explorer: New Relic’s Kubernetes Cluster Explorer provides drill-down visibility from control plane to nodes, pods, and containers with filtering across namespaces, deployments, labels, and container restart counts, deployable via Guided Install or Helm chart for teams with existing Kubernetes tooling (New Relic Kubernetes tutorial).
- Pixie eBPF Zero-Code Instrumentation: New Relic’s Pixie integration uses eBPF technology to provide zero-code, zero-instrumentation observability for Kubernetes workloads, capturing live HTTP requests, database queries, service latency, and network connections without modifying application code, deploying sidecars, or requiring language-specific agents.
- APM-Infrastructure Correlation: New Relic correlates APM application performance directly with Kubernetes infrastructure data, enabling SREs to view pod-level behavior and distributed traces in the same session without context-switching between application and infrastructure monitoring tools (TechTarget, 2024).
- Prometheus and OTel Compatibility: New Relic supports Prometheus Agent ingestion and OpenTelemetry data collection, enabling teams with existing Prometheus investments to add New Relic APM and Kubernetes Explorer capabilities without replacing their metrics collection layer.
- 100GB/Month Free Tier with Full Access: New Relic’s free tier with 1 full platform user provides complete access to Kubernetes monitoring, APM, distributed tracing, and log management at no cost, requiring no credit card or sales conversation for full-feature evaluation (New Relic pricing).
Best For
New Relic is best for APM-first teams already invested in the New Relic platform who want to extend their existing deployment into Kubernetes monitoring without platform migration, and for small teams who want to evaluate a full-featured commercial observability platform via the 100GB/month free tier before committing to paid ingest volumes.
Pricing
New Relic pricing (verified June 2026): Free tier at $0/month covers 100GB/month data ingest and 1 full platform user. Paid ingest beyond the free tier: approximately $0.40/GB standard, $0.50/GB on Data Plus. Core users approximately $49/month per user; Pro and Enterprise are tiered with Enterprise pricing custom (New Relic pricing).
Kubernetes environments can generate substantial ingest volumes as pod count and monitoring granularity increase. Teams should instrument a representative test cluster and measure actual ingest volume before projecting production costs, ingest-based pricing is less predictable than per-host models for dynamic workloads.
Strengths
- New Relic’s Pixie eBPF integration provides zero-code zero-instrumentation Kubernetes observability (capturing HTTP requests, database queries, and service latency without code changes or sidecar deployment) a capability acquired via the 2021 Pixie acquisition, subsequently open-sourced, and bundled natively in no other commercial platform in this comparison.
- New Relic’s 100GB/month free tier with 1 full platform user provides complete access to Kubernetes Cluster Explorer, APM, distributed tracing, and log management at no cost, the most accessible commercial platform evaluation experience in this comparison, requiring no sales engagement or credit card for full-feature testing (New Relic pricing).
- New Relic’s APM-infrastructure correlation enables direct visibility into hosts, containers, and Kubernetes pods within application performance views, closing the operational context-switching gap between infrastructure and application telemetry that practitioners consistently identify as a productivity drain (TechTarget, 2024).
- New Relic holds a 4.3/5.0 G2 rating from 900+ verified reviews (G2, June 2026), with consistent praise for unified observability depth, root-cause analysis speed, and contextual integration between distributed tracing and Kubernetes infrastructure data.
Limitations
- Vendor Stability Risk: New Relic’s November 2023 acquisition by private equity firms Francisco Partners and TPG, combined with workforce restructuring, post-restructuring headcount estimated at approximately 2,000 employees by industry observers (Signoz, 2024), represents a material risk factor for multi-year platform commitments. Private equity ownership structures commonly prioritize cost efficiency over R&D investment.
“Metrics in Prometheus, APM in New Relic (or whatever), errors in Sentry, context switching nightmare.” (r/devops practitioner, r/devops, 2025)
Takeaway: Community evidence positions New Relic as an APM-complement tool deployed alongside Prometheus, Sentry, and Grafana rather than as a replacement for them, directly contradicting the unified single-pane-of-glass positioning in New Relic’s marketing and suggesting the platform’s vision does not consistently translate to single-tool deployments in real-world mid-market environments.
- Not a True Single Pane of Glass in Practice: Community observations from r/devops (2025) indicate New Relic is frequently used alongside Sentry, Prometheus, or Grafana rather than as a true single pane of glass, suggesting the unified observability vision does not consistently translate to single-tool deployments in real-world mid-market environments.
- Ingest-Based Pricing Unpredictability: New Relic’s ingest-based pricing model creates less predictable bills in Kubernetes environments with variable telemetry volume than the per-host models used by Datadog and Dynatrace, modeling expected ingest before committing to paid tiers is strongly recommended for production Kubernetes deployments (middleware.io analysis, 2024).
- Reduced Feature Velocity Post-Restructuring: New Relic’s workforce restructuring has narrowed engineering capacity for feature development relative to Dynatrace, Datadog, and Grafana Labs, a long-term product competitiveness consideration for platform selection decisions extending beyond 2026.
Verdict
New Relic is a full-featured unified observability platform with a uniquely differentiated Pixie eBPF capability and the most accessible commercial free tier in this comparison, making it an appropriate first evaluation step for teams considering commercial observability without upfront cost commitment. New Relic ranks #6 in this independent evaluation primarily due to the material procurement risk created by its November 2023 private equity acquisition and workforce restructuring, a business transition that reduces confidence in long-term roadmap stability relative to NYSE-listed Dynatrace, NASDAQ-listed Datadog, and well-funded Grafana Labs. Teams already invested in the New Relic ecosystem should leverage their existing deployment and evaluate Pixie’s eBPF capabilities; teams making a fresh platform selection in 2026 should weigh the vendor stability risk against New Relic’s genuine technical strengths before committing to multi-year contracts.
7. Sysdig: Best for Security-First Container Environments Requiring Runtime Threat Detection and Monitoring from a Single Platform
Category: Security-Integrated Container Monitoring Platform, an eBPF-based CNAPP platform combining Kubernetes container monitoring with runtime threat detection, vulnerability scanning, and compliance management from a single agent built on the CNCF-graduated Falco engine.
At a Glance
- Category: Security-Integrated Container Monitoring Platform
- Best For: Security-conscious organizations in regulated industries: financial services, healthcare, government, that need runtime threat detection and compliance management alongside container monitoring from a single eBPF agent, with the budget to justify the combined monitoring and security premium
- Price Range: Sysdig Monitor ~$20/host/month (list price); Sysdig Secure ~$60/host/month (list price); combined CNAPP $40–$120/host/month (negotiated, wide range reflects enterprise deal structure)
- Primary Strength: Sysdig is the only platform in this comparison providing container monitoring and CNAPP runtime security from a single eBPF agent built on the CNCF-graduated Falco engine (February 2024), eliminating the need for separate monitoring and security tools in regulated Kubernetes environments
- Biggest Limitation: Sysdig’s pricing is the most opaque in this comparison: pricing requires sales engagement; list-to-negotiated range is $20–$120/host/month depending on features and volume, making self-service evaluation effectively inaccessible for small teams
- One-Line Summary: Sysdig is the only container monitoring platform in this comparison combining production monitoring with CNCF-graduated runtime threat detection (Falco, graduated February 2024) from a single eBPF agent, making it the strongest evaluated option for security-first Kubernetes environments with SOC 2, PCI-DSS, or HIPAA compliance requirements
- Last Verified: June 2026
Overview
Sysdig is a security-integrated container monitoring platform founded in 2013 by Loris Degioanni, co-creator of Wireshark, offering the only combination of Kubernetes container monitoring (Sysdig Monitor) and CNAPP capabilities including runtime threat detection, vulnerability scanning, drift detection, compliance management, and forensics (Sysdig Secure) from a single eBPF-based agent operating at the Linux kernel syscall level. Sysdig created and maintains Falco, the CNCF’s only graduated runtime threat detection engine, achieving CNCF graduation on February 29, 2024, the highest CNCF maturity designation, which forms the detection foundation of Sysdig Secure and can also be deployed independently as a free open-source tool.
Sysdig holds a 4.4/5.0 G2 rating from 200+ reviews (GetApp, June 2026) and has raised $741 million in total funding at an approximate $2.5 billion valuation, with approximately 800 employees (Platform Engineering Tools, 2024).
Key Features
- Single eBPF Agent for Monitoring and Security: Sysdig’s eBPF-based agent operates at the Linux kernel syscall level to simultaneously collect container performance metrics for Sysdig Monitor and capture file access patterns, network connections, and process execution events for Sysdig Secure, delivering both observability and security intelligence from one deployment with no sidecars required (Sysdig Secure docs).
- CNAPP Full Security Suite: Sysdig Secure provides CNAPP capabilities including Cloud Security Posture Management for configuration compliance, container image vulnerability scanning across registries, runtime drift detection for behavioral changes after deployment, and post-incident forensics, all from the same eBPF agent powering Sysdig Monitor (AppSecSanta, 2024).
- Falco CNCF-Graduated Runtime Detection: Sysdig is built on Falco, the CNCF’s only graduated runtime threat detection engine (CNCF graduation: February 29, 2024), which detects container escapes, privilege escalation, anomalous syscall patterns, and cryptomining using a rule-based engine with curated Sysdig-maintained threat feeds beyond the open-source Falco rule set.
- Multi-Orchestrator Support: Sysdig supports Kubernetes, Docker, OpenShift, and Amazon ECS monitoring and security across all major cloud providers, covering heterogeneous container environments without requiring separate agent deployments per orchestration platform.
- Compliance Reporting: Sysdig generates compliance reporting for SOC 2, PCI-DSS, HIPAA, and CIS Kubernetes Benchmarks as part of Sysdig Secure, producing audit-ready evidence artifacts from live runtime monitoring data without requiring separate compliance tooling alongside monitoring.
Best For
Sysdig is best for security-conscious organizations in regulated industries (financial services, healthcare, government, and any environment with SOC 2, PCI-DSS, or HIPAA compliance mandates) where runtime threat detection and compliance reporting are co-equal requirements alongside container performance monitoring, and where consolidating monitoring and security into a single agent simplifies both DevOps and security team operational relationships.
Pricing
Sysdig pricing (verified June 2026): Sysdig Monitor list price approximately $20/host/month; Sysdig Secure list price approximately $60/host/month (Capterra IE, 2024); combined CNAPP platform negotiated range approximately $40–$120/host/month depending on volume, enabled features, and contract terms. A 50-host Kubernetes deployment on the combined Monitor plus Secure platform could range from $2,000 to $6,000/month at list prices, with negotiated rates potentially lower at volume. Pricing requires sales engagement for any meaningful estimate. Direct pricing: sysdig.com/pricing.
Strengths
- Sysdig’s Falco project achieved CNCF graduation on February 29, 2024 (CNCF announcement, February 29, 2024) (the highest CNCF maturity designation) making Falco the only CNCF-graduated runtime threat detection engine and officially the cloud-native runtime security standard; this institutional credential independently validates Sysdig’s security approach in a way that no other tool in this comparison holds in the security domain.
- Sysdig’s eBPF architecture provides kernel-level visibility into file access patterns, network connections, process execution, and privilege escalation, a depth of security intelligence unavailable to application-layer monitoring tools, enabling detection of container escapes, cryptomining, and runtime attacks that observability-only platforms structurally cannot surface.
- Sysdig was founded by Loris Degioanni, co-creator of Wireshark with hundreds of millions of downloads as the world’s most widely used network protocol analyzer, a technical provenance that independently validates the deep kernel-level inspection capabilities underlying Sysdig’s eBPF-based container security approach (Platform Engineering Tools, 2024).
- Sysdig’s combined CNAPP architecture enables a single eBPF agent to simultaneously satisfy DevOps monitoring requirements and security team requirements, replacing two to three separate tool deployments with one agent that delivers container performance metrics, Kubernetes health, runtime threats, vulnerability management, and compliance reporting.
Limitations
- Purpose Specificity: Sysdig is a security-integrated container monitoring platform, not a monitoring-first platform, teams whose primary requirement is observability depth, log analytics, distributed tracing fidelity, or advanced dashboarding will find that Sysdig’s monitoring capabilities are secondary to its security architecture in feature investment and development priority.
- Pricing Opacity: Sysdig’s pricing is the most opaque in this comparison: pricing requires sales engagement; list-to-negotiated range is $20–$120/host/month (SaaSworthy, 2024), making pre-engagement cost estimation impossible for teams without a procurement budget large enough to initiate a sales conversation.
- Smaller Review Sample: Sysdig’s G2 review sample of 200+ is the smallest commercial platform base in this comparison, limiting statistical confidence in the 4.4/5.0 rating relative to Dynatrace’s 1,363 or Datadog’s 1,000+ verified reviews, a consideration when evaluating peer feedback quality.
“Sysdig is the right choice if you care about runtime security, but overkill if monitoring is your only goal.” (r/devops and r/kubernetes community consensus across multiple 2024–2025 threads)
Takeaway: Community consensus on Sysdig is more consistent than for any other platform in this comparison, the security-first use case is universally acknowledged as Sysdig’s strength, and monitoring-only teams are consistently directed to lower-cost alternatives. This use-case clarity informs Sysdig’s #7 ranking: definitively right for its intended audience, definitively wrong for teams without a compliance mandate.
- Open-Source Falco Alternative Exists: Teams with security requirements should evaluate deploying open-source Falco directly (CNCF-graduated, free, and actively maintained) before committing to Sysdig’s enterprise CNAPP pricing. Teams can use open-source Falco alone when they have security engineering capacity to author and maintain custom detection rules, do not require centralized multi-cluster policy management, and can operate without automated compliance reporting. Sysdig’s premium is justified when any of these three conditions is absent.
Verdict
Sysdig is the only platform in this comparison that combines container monitoring with CNCF-graduated runtime threat detection via Falco (CNCF graduation: February 29, 2024) from a single eBPF agent, making it the strongest evaluated option for security-first Kubernetes environments with SOC 2, PCI-DSS, or HIPAA compliance requirements. Sysdig ranks #7 in this independent evaluation not as a quality judgment but as a specialization reflection: Sysdig is purpose-built for the security-plus-monitoring combined use case, and teams whose primary requirement is observability without a compliance mandate will find better options at lower cost earlier in this list. For organizations with genuine SOC 2, PCI-DSS, or HIPAA compliance requirements in containerized environments, Sysdig’s unique CNAPP-plus-monitoring architecture justifies its pricing premium over every monitoring-only alternative reviewed here.
What Red Flags Should I Watch For When Evaluating Container Monitoring Tools?
The five highest-risk red flags when evaluating container monitoring tools are: pricing that requires a sales conversation before cost estimation is possible, OpenTelemetry adoption that increases rather than reduces vendor costs, vendor business instability from PE acquisitions or workforce reduction, self-hosted OSS stacks deployed without platform engineering capacity, and monitoring-only coverage in environments with runtime security compliance requirements.
Red Flag #1: Pricing Opacity Without Procurement Resources
Any vendor that cannot provide a realistic cost estimate for your specific host count, signal types, and retention requirements without a multi-week sales engagement introduces unacceptable budget risk for teams with limited procurement bandwidth.
Dynatrace and Sysdig both require sales engagement for meaningful pricing estimates. By contrast, Grafana Cloud and Sematext provide transparent self-service pricing calculators that answer the “how much at 50 hosts?” question in minutes, without a sales conversation.
Red Flag #2: OTel Adoption Creating Higher Rather Than Lower Bills
Datadog bills OpenTelemetry-derived metrics as “custom metrics” at $5 per 100 custom metrics per month above plan allotments (Signoz, 2024), meaning OTel adoption (intended to reduce vendor lock-in and cost) structurally increases Datadog spend.
Most teams adopt OpenTelemetry specifically to reduce vendor dependency. Datadog’s custom metric classification reverses this logic: OTel adoption in a Datadog environment doesn’t reduce lock-in, it monetizes it. Every OTel tag combination creates a new billable custom metric line, rapidly multiplying costs in label-rich Kubernetes environments. Teams standardizing on OTel must verify how each commercial platform classifies and prices OTel-derived data before committing to contracts.
Red Flag #3: Vendor Business Instability Creating Roadmap Risk
New Relic’s November 2023 acquisition by private equity firms Francisco Partners and TPG demonstrates how quickly a platform’s engineering investment can change (Signoz, 2024).
Teams evaluating any monitoring platform for multi-year commitments should verify current ownership structure, ARR trajectory, and employee count trend before signing long-term contracts. Public companies (Dynatrace NYSE: DT; Datadog NASDAQ: DDOG) and well-funded private companies (Grafana Labs at $6B+ valuation) provide more procurement confidence than PE-owned platforms.
Red Flag #4: Self-Hosted OSS Stack Without Dedicated Platform Engineering
Prometheus plus the full Grafana LGTM stack (Grafana, Mimir, Loki, and Tempo) is operationally equivalent to managing a small PaaS.
r/devops community feedback (2025) consistently warns that teams without dedicated platform engineering capacity frequently end up with a partially functional self-hosted stack that creates more alert noise than the stack resolves. Evaluate team capacity honestly before committing to a self-hosted path, Grafana Cloud eliminates this operational burden at a cost that is still 60–70% lower than Datadog.
Red Flag #5: Monitoring-Only Coverage in Compliance-Mandated Environments
Organizations with SOC 2, PCI-DSS, or HIPAA compliance requirements that deploy a monitoring-only platform without a separate runtime security tool create a compliance gap that auditors will flag.
Sysdig is the only platform in this comparison that closes this gap natively. Teams using other platforms should evaluate open-source Falco as a complementary runtime security layer before the compliance review rather than after.
What Questions Should I Ask Before Choosing a Container Monitoring Tool?
Before committing to a container monitoring platform, ask these five questions: (1) What is my fully-loaded cost at 50 hosts with APM and logs enabled? (2) Does this tool natively cover metrics, logs, and traces or will I need three tools? (3) What is this vendor’s current ownership structure and ARR trend? (4) How long to reach production-grade alert coverage? (5) Does my compliance environment require runtime security alongside monitoring?
Question #1: What is my fully-loaded cost at 50 hosts with APM and logs enabled?
Ask vendors to calculate cost for your specific scenario, 50 hosts, APM traces enabled, 200GB logs/month, 10 containers per host, and OpenTelemetry data collection. The delta between the marketing headline price and this scenario calculation is your billing-surprise risk.
For Datadog, this calculation will reveal the custom metric charges and container add-on costs that community feedback consistently flags as unexpected. Compare the result against Grafana Cloud’s pricing calculator at grafana.com/pricing for a validated cost comparison.
Question #2: Does this tool cover metrics, logs, and traces natively or will I need three tools?
Platforms that require separate integrations for each signal type create the tool sprawl that unified observability promises to solve.
Ask specifically whether logs, traces, and metrics are co-located in the same query and dashboard interface without exporting data between systems, and whether combined queries across signal types are supported natively or require manual correlation. Prometheus-only deployments and early-stage Grafana stacks frequently still require multiple tools.
Question #3: What is the current business model and ownership structure of this vendor?
Verify current ownership (public company, VC-backed, PE-owned, or bootstrapped), the most recent ARR or revenue figure, employee count trend, and whether any material business transitions have occurred in the past 24 months.
New Relic’s 2023 PE acquisition is a documented example of why this question matters for multi-year commitments. Dynatrace (NYSE: DT) and Datadog (NASDAQ: DDOG) provide public company financial transparency; Grafana Labs and Sematext provide privately reported stability signals.
Question #4: How much engineering time will it take to reach production-grade monitoring?
Ask for reference customer stories from organizations similar in size and stack complexity. The gap between “time to first dashboard” and “time to production-grade alert coverage with low false-positive rate” is frequently measured in weeks or months for complex Kubernetes environments regardless of vendor.
Dynatrace’s OneAgent genuinely reduces this gap. Prometheus genuinely requires more time. Sematext’s self-service onboarding sits closest to the “low friction” end of the commercial spectrum.
Question #5: Does my compliance environment require runtime security alongside monitoring?
If your organization holds SOC 2 Type II, PCI-DSS Level 1, or HIPAA certifications, your compliance scope will include container runtime security requirements that observability-only tools cannot satisfy.
Evaluate whether a separate runtime security tool (open-source Falco or Sysdig as a combined platform) is required before selecting a monitoring-only platform. Adding a second tool mid-contract is significantly more disruptive than including it in the initial selection. The open-source Falco build-versus-buy decision framework in the Sysdig entry above applies here.
How Did We Rank These Container Monitoring Tools?
These seven container monitoring tools were ranked by weighted score across six criteria: observability coverage depth, verified review ratings and volume, pricing transparency and predictability, Kubernetes and container-native depth, operational overhead, and vendor stability and ecosystem maturity. All scoring uses data from G2, the CNCF Annual Survey 2024, independent pricing analyses, and practitioner community discussions, no vendor-supplied materials alone determined any ranking decision.
Evaluation Process
The evaluation followed a four-step process:
- Discovery: Identified the seven most commonly recommended container monitoring tools across AI engine responses, practitioner communities, and industry analyst reports (June 2026).
- Research: Queried multiple AI search engines, gathered independent web research from G2, Capterra, Gartner, and vendor documentation, and analyzed Reddit community sentiment across r/devops and r/kubernetes for real-world practitioner experience.
- Cross-Reference: Verified vendor claims against third-party review platforms, independent pricing analyses, and CNCF survey adoption data. Vendor-reported statistics are labeled as such; only claims corroborated by at least one independent source are stated as fact.
- Scoring: Applied the six weighted criteria below to each tool and ranked by total weighted score.
Ranking Criteria
Observability Coverage Depth: Assessed by native signal coverage across metrics, logs, distributed traces, runtime security or CNAPP, and eBPF instrumentation. Coverage through mandatory third-party integrations scores lower than native capabilities. Matters because tool sprawl is the most consistently cited pain point in the target audience.
Verified Review Ratings and Volume: G2 or Capterra star ratings weighted by review volume (minimum 50 reviews for full weight at commercial platforms) plus CNCF adoption data for open-source projects. Matters because independent peer feedback from deployed engineers provides ground-truth validation that vendor marketing cannot replicate.
Pricing Transparency and Predictability: Scored on public self-service pricing availability, predictability at scale without hidden multipliers, absence of documented surprise cost mechanisms, free tier accessibility, and competitive value relative to coverage provided. Matters because billing surprises are the most consistently cited reason teams abandon or regret their monitoring platform selection.
Kubernetes and Container-Native Depth: Scored on Kubernetes auto-discovery, CNCF graduation or certification, eBPF capability, breadth of container runtime and orchestrator support, and Prometheus API compatibility. Matters because 89% of organizations now run containers in production (CNCF Annual Survey 2024).
Operational Overhead: Scored on time-to-first-value, agent deployment simplicity, alert quality, production-grade scaling without additional infrastructure, and managed availability. Matters because high maintenance burden is a documented reason teams abandon open-source paths or overpay for commercial SaaS.
Vendor Stability and Ecosystem Maturity: Scored on business model stability, employee count and growth, funding or ARR confirmation, ecosystem size, and independent analyst or CNCF recognition. Matters because container monitoring platform selection is a multi-year infrastructure commitment where vendor business instability represents direct procurement risk.
Evidence Weighting
When review platform ratings conflict with Reddit sentiment, we weight specificity and recency. A detailed 2025 Reddit post with 50+ upvotes describing a specific billing scenario outweighs a generic 2023 G2 review for pricing assessment. For capability claims, vendor documentation and CNCF project graduation records outweigh analyst reports, which outweigh vendor marketing.
Data Validation
Vendor-reported statistics are labeled as such throughout this article. Only claims corroborated by at least one independent source are stated as fact. Pricing data is verified against public pricing pages or documented independent analyses with publication dates. CNCF adoption statistics are sourced directly from the CNCF Annual Survey 2024 and the CNCF Observability Microsurvey (2022).
Update Cadence
This article was last updated June 2026. We target quarterly reviews of pricing data and bi-annual reviews of full rankings. Readers evaluating tools more than three months after publication should verify current pricing directly with vendors.
Independence Statement
PlugRoute has no affiliate relationships with any company listed. Rankings are determined entirely by research data and objective evaluation criteria.
Frequently Asked Questions About Container Monitoring Tools
What is the best container monitoring tool for Kubernetes production environments in 2026?
Dynatrace is the highest-rated container monitoring platform for Kubernetes production in independent review data, 4.5/5.0 G2 from 1,363 reviews, June 2026, combining zero-configuration OneAgent full-stack instrumentation with Davis AI causation-based root-cause analysis. For cost-constrained environments, Grafana Labs is the strongest alternative at approximately 60–70% lower cost than Datadog at mid-scale, with a no-rewrite Prometheus migration path and a usable free tier starting at 10,000 active series.
Is Grafana Cloud cheaper than Datadog for Kubernetes monitoring?
Grafana Cloud is approximately 60–70% cheaper than Datadog for equivalent mid-scale Kubernetes monitoring (verified June 2026): a cluster generating 100,000 active series, 200GB logs, and 100GB traces costs approximately $900/month on Grafana Cloud Pro versus an estimated $2,500+ on a comparable Datadog configuration with APM and log management enabled. Grafana Cloud also eliminates the OTel custom metric surcharge that Datadog applies to OpenTelemetry-derived data, making the cost advantage even more pronounced for teams adopting OTel.
How does PlugRoute determine its container monitoring tool rankings?
PlugRoute ranks container monitoring tools by weighted score across six criteria: observability coverage depth, verified review ratings and volume, pricing transparency and predictability, Kubernetes and container-native depth, operational overhead, and vendor stability and ecosystem maturity. All data is sourced from G2, CNCF surveys, independent pricing analyses, and practitioner community discussions. No company pays for placement, and PlugRoute holds no affiliate relationships with any vendor listed.
Glossary: Key Terms Used in This Comparison
eBPF (Extended Berkeley Packet Filter): eBPF is a Linux kernel technology that enables programs to run safely in kernel space without modifying kernel source code or loading kernel modules, allowing container monitoring tools like Sysdig, Grafana Beyla, and New Relic’s Pixie to capture system calls, network connections, and process behavior without modifying application code or deploying sidecar containers.
LGTM Stack: The LGTM Stack is a composable open-source observability architecture maintained by Grafana Labs comprising four components (Loki for log aggregation, Grafana for visualization, Tempo for distributed tracing, and Mimir for horizontally scalable metrics storage) designed to provide unified container observability as a cohesive alternative to commercial all-in-one platforms like Datadog.
CNAPP (Cloud Native Application Protection Platform): A CNAPP is a security platform that combines multiple cloud-native security capabilities (including runtime threat detection, container image vulnerability scanning, cloud security posture management, drift detection, and compliance reporting) in a single integrated tool; Sysdig is the only platform in this comparison functioning as both a CNAPP and a container monitoring platform from a single agent.
High Cardinality: In time-series metrics, high cardinality refers to label sets with large numbers of unique label value combinations, a common condition in Kubernetes environments where pod names, deployment IDs, and namespace labels create hundreds of thousands of unique metric streams; high cardinality is a primary driver of Prometheus memory exhaustion at scale and a leading cause of unexpected cost spikes in usage-based commercial platforms such as Datadog.
CNCF Graduated Project: A CNCF Graduated project is an open-source project that has passed the Cloud Native Computing Foundation’s highest maturity evaluation, demonstrating production-readiness, security governance practices, broad community adoption, and institutional project governance; in this comparison, Prometheus (graduated 2018) and Falco (graduated February 2024) hold this designation, making them the most institutionally validated open-source options in the category.
Which Container Monitoring Tool Is Right for You?
The right container monitoring tool is determined by three factors: your team’s cost tolerance at production Kubernetes scale, your operational capacity to manage self-hosted components, and whether your environment has compliance requirements that make runtime security a co-equal need alongside observability. No commercial platform in this comparison is simultaneously the most capable, most affordable, most operationally simple, and most secure, each ranking position reflects a specific trade-off that is legitimate for a specific team profile and unjustifiable for another.
Key Insights
- Dynatrace (#1) is the highest-rated enterprise platform (4.5/5.0 G2, 1,363 reviews, June 2026) with zero-config OneAgent full-stack instrumentation and causation-based AI root-cause analysis, the strongest choice when MTTR reduction and alert fatigue elimination justify enterprise pricing starting at ~$69/host/month Full-Stack.
- Grafana Labs (#2) delivers full-stack observability at approximately 60–70% lower cost than Datadog (verified June 2026) with a transparent pay-as-you-go model and Prometheus-compatible managed scalability via Mimir, the strongest value for any team that can invest in the LGTM stack learning curve, available free from 0 to 10,000 active series.
- Datadog (#3) provides the widest integration ecosystem (700+) with NASDAQ-listed financial stability ($2B+ ARR), the correct choice for enterprises needing maximum integration breadth, provided teams model fully-loaded per-host costs and account for OTel custom metric charges before signing annual contracts.
- Sematext (#4) is the most affordable full-stack commercial SaaS in this comparison, with self-service Pro pricing significantly cheaper than Datadog’s comparable tier (see current rates at sematext.com/pricing), with a no-credit-card free trial and unified metrics, logs, and traces ideal for small-to-mid DevOps teams without enterprise procurement bandwidth.
- Prometheus (#5) is the CNCF-graduated de facto Kubernetes metrics standard with 86% cloud-native adoption (CNCF Observability Microsurvey, 2022) and zero vendor lock-in, the correct foundation for teams with platform engineering capacity who prioritize flexibility, though additional components are required for logs, traces, and production-scale HA.
- New Relic (#6) uniquely bundles Pixie eBPF zero-code Kubernetes visibility and the most accessible commercial free tier (100GB/month), appropriate for APM-centric teams extending into Kubernetes monitoring, with caution warranted on the November 2023 PE acquisition for long-term commitments.
- Sysdig (#7) is the only platform combining CNCF-graduated runtime threat detection (Falco, February 2024) with container monitoring from a single eBPF agent, the strongest evaluated option for regulated environments with SOC 2, PCI-DSS, or HIPAA requirements; teams should evaluate open-source Falco first to understand the build-versus-buy trade-off.
Choosing Between Self-Hosted OSS and Commercial SaaS
Teams choosing between Prometheus plus the Grafana LGTM stack and a commercial SaaS platform face a real trade-off between engineering time and licensing cost. Self-hosted Prometheus plus Grafana costs near-zero in software licensing but requires dedicated platform engineering to configure, scale, and maintain each component.
Grafana Cloud eliminates that operational overhead at approximately $900/month for a mid-scale cluster (still 60–70% cheaper than Datadog at equivalent coverage) making it the strongest middle path between full self-hosted and full enterprise SaaS for teams without dedicated platform engineering bandwidth.
As one user on r/sre described:
“Depends who creates the dashboards. In a 1000 person company we used Grafana originally but very few of the wider teams created dashboards themselves as they found it too hard. Eventually, the 2 guys looking after the LGTM stack left and the company moved to DataDog. With zero training, the uptake of the tool by all teams has been night and day difference, dashboards (quality ones) for every teams and self service. I love how powerful Grafana is but for end user ease of use, DataDog no question.” Posted by u/andyr8939
Takeaway: Real-world enterprise deployments confirm that the LGTM stack’s operational fragility is a personnel risk, not just an architecture risk, when the two or three engineers maintaining the self-hosted stack depart, organizations without Grafana-fluent replacements face forced migration to commercial SaaS rather than a viable upskilling path, validating Grafana Cloud as the more operationally resilient choice for teams that cannot guarantee continuity of LGTM expertise.
Choosing a Datadog Alternative With a Cost Reduction Goal
Teams with an active Datadog contract and a cost reduction mandate have two validated alternatives from this evaluation. Grafana Cloud is the strongest alternative for teams with Kubernetes expertise, Grafana Cloud accepts existing PromQL queries and Grafana dashboards without rewriting, enabling a lower-friction migration at 60–70% cost savings.
Sematext is the strongest alternative for teams that want to minimize migration complexity, the lightweight DaemonSet agent, unified metrics plus logs plus traces, and no-credit-card trial make Sematext the fastest path to full observability at significantly lower per-host cost than Datadog (verify current rates at sematext.com/pricing).
For deeper analysis on container monitoring selection criteria, self-hosted architecture patterns, and Kubernetes observability stack design, browse PlugRoute’s independent DevOps tool reviews. We update this guide quarterly. Last updated: June 2026.