Datarails leads for mid-market FP&A teams, Anaplan leads for Fortune 500 connected planning, and LiveFlow leads for small businesses and accounting firms at $24/month. This category spans $24/month spreadsheet connectors to $200,000+/year enterprise platforms, requiring a company-size tier framework before any individual product evaluation.
Finance professionals face four recurring evaluation traps:
- Static spreadsheets that cannot scale with growing teams or support real-time collaboration
- AI marketing claims that cannot be verified without a live demonstration on company-specific data
- Pricing opacity across six of seven platforms that requires a full sales cycle to confirm budget fit
- An enterprise-vs-SMB tier mismatch that surfaces $200,000+/year Fortune 500 tools alongside $24/month bookkeeper apps in the same search results
PlugRoute has no affiliate relationships with any company listed in this article. Rankings are determined entirely by research data, third-party review evidence, and objective evaluation criteria applied equally to all platforms.
What Are the Top Picks for Budgeting and Forecasting Software in 2026?
- Datarails: highest-rated mid-market FP&A platform (G2: 4.7/5.0, 146 reviews, most-reviewed in the G2 Budgeting and Forecasting category); Excel-native with 200+ ERP integrations and FP&A Genius AI; fastest mid-market implementation
- Anaplan: enterprise connected planning benchmark; 9× Gartner Magic Quadrant Leader in Financial Planning Software through 2025; best for Fortune 500 multi-domain planning
- Planful: only mid-market platform combining structured budgeting, driver-based scenario modeling, and financial consolidation in one license; Gartner Magic Quadrant Leader
- Workiva: only platform unifying SEC filing, ESG reporting, SOX compliance, and financial planning in one connected system; NYSE: WK; $739 million in FY2024 revenue
- Vena Solutions: Excel-native FP&A platform with the deepest multi-stage approval workflow governance in this comparison; best for Microsoft-ecosystem organizations
- LiveFlow: the only transparently priced platform at $24–$79/month; sub-1-hour setup; best for SMBs and accounting firms
- IBM Planning Analytics: TM1 in-memory OLAP engine for enterprises with extreme multi-dimensional planning complexity; only credible on-premise deployment option in this comparison
How Do the Top 7 Budgeting and Forecasting Platforms Compare at a Glance?
The seven platforms below span five fundamentally different architecture types. Scan this table first to identify whether a platform’s category, capabilities, and buyer profile align with your situation before reading individual entries.
| Rank | Company | Category | Best For | One-Line Summary | Key Capabilities | Primary Strength | Key Limitation |
|---|---|---|---|---|---|---|---|
| 1 | Datarails | Excel-Native FP&A | Mid-market FP&A teams (50–500 employees) | Datarails is the highest-rated platform in G2’s Budgeting and Forecasting category, combining Excel-native familiarity with centralized cloud governance, 200+ ERP integrations, and FP&A Genius AI for natural-language financial analysis; purpose-built for mid-market FP&A teams upgrading from manual spreadsheet workflows | 200+ ERP integrations; FP&A Genius AI; scenario planning; rolling forecasts; ~$24,000–$100,000+/year | G2: 4.7/5.0 (146 reviews, most-reviewed in category); Capterra: 4.8/5.0; multi-cycle G2 Leader | No public pricing; per-module cost escalation |
| 2 | Anaplan | Connected Planning | Enterprise ($500M+ revenue) needing multi-domain planning | Anaplan has been named a Gartner Magic Quadrant Leader in Financial Planning Software nine consecutive times through 2025, making it the enterprise benchmark for connected, multi-domain planning at Fortune 500 scale; and the highest total-cost-of-ownership platform in this comparison | HyperBlock™ engine; Finance, HR, Sales, Supply Chain on shared model; App Hub; ~$20,000–$500,000+/year | 9× Gartner Magic Quadrant Leader in Financial Planning Software through 2025 | Requires 1–3 dedicated model-builder specialists; 8–24 week minimum implementation |
| 3 | Planful | Cloud FP&A | Mid-to-large market ($100M–$2B) needing planning + financial close | Planful is a Gartner Magic Quadrant Leader for Financial Planning Software that uniquely combines structured annual budgeting, dynamic driver-based scenario modeling, and multi-entity financial consolidation in one platform; with Planful Predict applying machine learning to company-specific actuals | Structured Planning + Spotlight Dynamic Planning; Financial Consolidation; Planful Predict ML; ~$25,000–$100,000+/year | Only mid-market platform combining structured budgeting, scenario modeling, and financial close in one license | 3–6 month implementation; dated Structured Planning UI |
| 4 | Workiva | Connected Reporting + Planning | Public companies and regulated enterprises | Workiva is the only platform in this comparison that unifies SEC filing, ESG reporting, SOX compliance, and financial planning in one connected audit trail, serving 6,000+ customers with 1,800+ G2 reviews and $739 million in FY2024 revenue as NYSE: WK | SEC/XBRL filing; ESG/CSRD; SOX audit; connected data model; immutable audit trail; ~$50,000–$150,000+/year | 1,800+ G2 reviews (4.4/5.0); NYSE-listed; $739M FY2024 revenue; immutable audit trail | Not a standalone FP&A tool; private mid-market buyers overpay without compliance obligations |
| 5 | Vena Solutions | Excel-Native Planning | Mid-to-upper market (100–1,000 employees) in Microsoft ecosystems | Vena Solutions is the Excel-native FP&A platform with the deepest workflow governance in this comparison; configurable approval chains, cell-level access controls, and a complete audit trail; purpose-built for mid-to-upper-market organizations in Microsoft ecosystems | Complete Planning (Finance + HR); multi-stage approval workflows; Dynamics 365/Power BI integration; ~$25,000–$120,000+/year | Deepest workflow governance in the Excel-native segment; first-class Microsoft Dynamics 365 and Power BI integration | Requires authorized implementation partner; higher deployment cost and timeline than Datarails |
| 6 | LiveFlow | Spreadsheet-Connected | SMBs (1–50 employees), accounting firms, startup finance teams | LiveFlow is the fastest-setup and only transparently priced budgeting and reporting platform in this comparison, enabling accounting firms and small business finance teams to publish live financial reports into Google Sheets in under one hour at $24–$79 per month | Live QuickBooks/Xero/NetSuite sync; 100+ templates; multi-entity consolidation; $24/month Starter; $79/month Professional | Only platform with published self-serve pricing; sub-1-hour setup; G2: 4.7/5.0 (100+ reviews) | Google Sheets performance ceiling at ~10,000+ transaction rows; no complex scenario modeling |
| 7 | IBM Planning Analytics | Enterprise OLAP | Large enterprises ($500M+) with complex multi-dimensional models | IBM Planning Analytics delivers the TM1 in-memory OLAP engine’s multi-dimensional calculation power for enterprises whose planning complexity no cloud-native FP&A platform can match; but demands dedicated specialist administrators and the highest total cost of ownership in this comparison | TM1 OLAP engine; PAW + PAX dual interfaces; Watson AI (additional setup required); on-premise option; ~$70–$90/user/month SaaS + infrastructure | TM1 OLAP engine for thousands of simultaneous data dimensions; only credible on-premise deployment option | Requires 1–3 dedicated TM1 administrators; highest total cost of ownership in this comparison |
Which Budgeting and Forecasting Platform Is Right for My Company Size?
The most common FP&A software evaluation mistake is comparing tools across company-size tiers rather than within the appropriate tier. Use this table to identify your primary need first, then evaluate only the platforms listed for that scenario.
| Your #1 Priority | Recommended Tool | Why | Acceptable Alternative |
|---|---|---|---|
| SMB / accounting firm reporting at low cost | LiveFlow | Only public pricing ($24–$79/mo); sub-1-hour setup; Google Sheets native | QuickBooks native reporting (limited features) |
| Mid-market FP&A upgrade from Excel; speed is priority | Datarails | Fastest mid-market implementation (weeks); G2’s most-reviewed FP&A platform; 200+ integrations | Vena Solutions (if workflow governance > speed) |
| Mid-market Excel upgrade; governance is priority | Vena Solutions | Deepest multi-stage approval workflows in Excel-native segment; Microsoft ecosystem fit | Datarails (if implementation speed > governance depth) |
| Mid-market needing planning + financial close in one system | Planful | Only mid-market platform with structured budgeting + scenario modeling + consolidation in one license | Workiva (if SEC or ESG compliance obligations exist) |
| Enterprise multi-domain connected planning | Anaplan | 9× Gartner MQ Leader; HyperBlock™ real-time connected planning across Finance, HR, Sales, Supply Chain | IBM Planning Analytics (if TM1 legacy installation exists) |
| Public company needing SEC + ESG + planning unified | Workiva | Only platform unifying SEC filing, ESG, SOX, and planning with immutable audit trail | Planful + separate compliance tooling |
| Complex enterprise OLAP or on-premise data residency required | IBM Planning Analytics | TM1 engine for extreme multi-dimensional models; only credible on-premise deployment option | Anaplan (if migrating from TM1 and cloud is acceptable) |
What Are the 5 Types of Budgeting and Forecasting Software Architecture?
Budgeting and forecasting tools fall into five architecture types. Evaluating platforms in the wrong type wastes significant procurement time before any vendor demo. The five types differ on three buyer-critical dimensions: implementation speed, modeling ceiling, and total cost of ownership.
- Excel-Native Platforms (Datarails, Vena Solutions): Finance teams continue working in Excel while a cloud database and governance layer are added beneath. Datarails implements in weeks; Vena Solutions typically requires an authorized implementation partner. Both have performance ceilings for very large multi-dimensional models.
- Cloud-Native Replacement Platforms (Anaplan, Planful): Finance teams migrate into a dedicated planning environment with a higher modeling ceiling. Anaplan serves Fortune 500 multi-domain planning; Planful serves mid-to-large-market teams needing planning plus financial close. Implementation is measured in months; change management is required.
- Spreadsheet-Connected Reporting Tools (LiveFlow): LiveFlow creates live data connections between accounting software and existing Google Sheets or Excel templates. No migration, no IT involvement. LiveFlow deploys in under one hour. Google Sheets performance ceiling limits scalability beyond approximately 10,000 transaction rows.
- Enterprise OLAP Platforms (IBM Planning Analytics): IBM Planning Analytics’ TM1 in-memory engine processes thousands of simultaneous data dimensions. IBM Planning Analytics requires dedicated technical administrators and carries the highest total cost of ownership in this comparison.
- Compliance-First Connected Reporting Platforms (Workiva): Workiva unifies SEC/XBRL filing, ESG disclosure, SOX audit, and financial planning in one connected audit trail. Workiva is purpose-built for publicly traded and regulated enterprises, it is not a standalone FP&A tool.
Understanding which architecture type fits your organization’s situation substantially reduces evaluation mismatch risk before any vendor demo or pricing discussion, though ERP compatibility and internal change management capacity should also be assessed before shortlisting.
1. Datarails: Best Overall for Mid-Market FP&A Teams
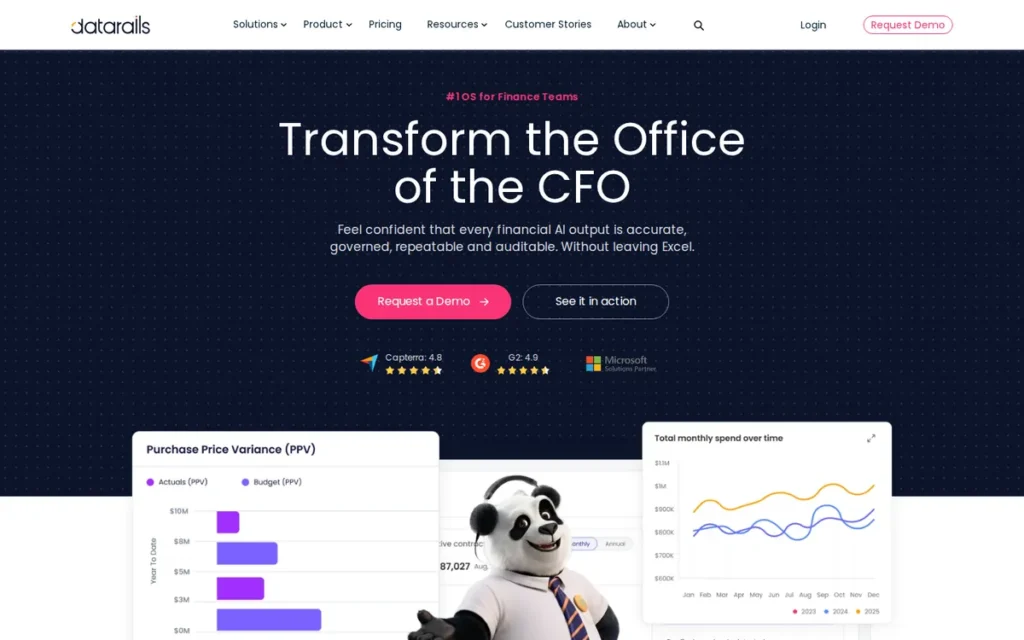
Category: Excel-Native FP&A Platform: centralizes Excel-based financial planning by adding a cloud database, automated ERP data ingestion, version control, workflow management, and AI-assisted analysis beneath the familiar Excel interface finance teams already use, without requiring a spreadsheet migration.
At a Glance
- Category: Excel-Native FP&A Platform
- Best For: FP&A analysts, controllers, and CFOs at mid-market companies (50–500 employees, $20M–$500M revenue) upgrading from manual Excel budget workflows who need automated data consolidation, scenario planning, and AI-assisted analysis without migrating away from the spreadsheet interface their teams already use
- Price Range: ~$24,000–$100,000+/year; per-module pricing means costs escalate as capabilities are added; no public list price as of June 2026
- Primary Strength: Datarails holds the highest G2 rating in the Budgeting and Forecasting category (4.7/5.0, 146 reviews, the most-reviewed FP&A platform in the category) and the highest Capterra rating in this comparison (4.8/5.0), with 200+ ERP integrations and an Excel-native architecture that implements in weeks rather than months
- Biggest Limitation: Datarails does not publish pricing and uses a per-module pricing structure where annual spend can escalate significantly beyond the initial contract, making total cost comparisons with competitors difficult without a full sales engagement
- One-Line Summary: Datarails is the highest-rated platform in G2’s Budgeting and Forecasting category, combining Excel-native familiarity with centralized cloud governance, 200+ ERP integrations, and FP&A Genius AI for natural-language financial analysis, purpose-built for mid-market FP&A teams upgrading from manual spreadsheet workflows
- Last Verified: June 2026
Overview
Datarails is an Excel-native FP&A platform built for mid-market finance teams at companies with 50–500 employees that need to eliminate manual spreadsheet consolidation, automate ERP data ingestion, and add AI-assisted analysis without migrating away from the Excel interface their teams already use.
Datarails adds a centralized cloud database, automated ERP data ingestion across 200+ source connections, version control, workflow management, and scenario modeling beneath familiar Excel surfaces, implementing in weeks rather than the months typical of cloud-native FP&A alternatives.
Datarails’ FP&A Genius AI allows finance teams to query their company’s financial data using natural language, generating automated narrative commentary and flagging anomalies without manual formula work.
Key Features
- Excel-Preserved Interface: Datarails maintains Excel as the primary user interface while adding a centralized cloud database that eliminates version conflicts, lost files, and manual copy-paste consolidation across multiple department budget files, preserving the spreadsheet workflows finance teams use while removing the governance failures those spreadsheets create at scale.
- 200+ Native ERP Integrations: Datarails connects natively to 200+ data sources including NetSuite, SAP, QuickBooks Online, Xero, Sage Intacct, Salesforce, ADP, and Workday, ingesting actuals automatically on a scheduled basis without CSV exports, manual entry, or IT involvement, per the Datarails integrations page (June 2026).
- FP&A Genius AI: Datarails’ FP&A Genius AI enables finance teams to query company financial data using natural language, asking questions such as “What drove the Q3 operating expense variance?”, and receive automated narrative commentary and anomaly alerts without writing formulas or building pivot tables manually.
- Scenario Planning and Rolling Forecasts: Datarails includes scenario planning and rolling forecast capabilities within the Excel-native environment, enabling finance teams to run multiple budget versions and sensitivity analyses against live actuals without rebuilding models from scratch for each scenario.
- Role-Based Access Controls and Audit Trail: Datarails provides role-based access controls, a complete audit trail of every data change, and collaborative budget workflow management, ensuring contributors input data into the right templates and every modification is logged for internal audit and compliance purposes.
Best For
Datarails is best for mid-market FP&A teams at companies with 50–500 employees and $20M–$500M in revenue where finance staff have deep Excel expertise and would resist a full platform migration, but where the volume of manual data consolidation across siloed department files, version control failures, and time spent on copy-paste reporting has made the current spreadsheet process unsustainable.
Datarails is the right choice over Vena Solutions when an organization’s primary priority is implementation speed and broadest ERP integration coverage rather than workflow governance depth.
Pricing
Datarails does not publish pricing publicly as of June 2026. Community-sourced estimates and a 2026 independent review by Fuel Finance place annual contract values at approximately $24,000–$100,000+/year depending on modules selected and user count, with implementation fees additional.
Datarails uses a per-module pricing model, initial contracts can escalate as teams add scenario planning, reporting, or HR planning modules beyond the base FP&A platform. The 2026 Fuel Finance review specifically labeled the absence of a published pricing page a “transparency issue compared to the broader market.” Contact Datarails directly for a personalized quote; budget all anticipated modules in the initial contract to avoid incremental cost escalation.
Strengths
- Highest Combined User Satisfaction in the Category: Datarails holds G2: 4.7/5.0 across 146 reviews (the most-reviewed platform in G2’s Budgeting and Forecasting category as of 2025–2026) and Capterra: 4.8/5.0, with ratings sustained across consecutive G2 Grid cycles from 2023 through 2025, indicating consistent positive review velocity rather than a single strong quarter.
- Reported 70% Reporting Time Reduction at Named Public Company: A Datarails case study with Global-e Online (NYSE: GLBE, a publicly traded e-commerce enablement platform) reports a 70% reduction in manual reporting time and same-day data consolidation from sources that previously required multiple days, a vendor-reported outcome from a named public company mapping directly to Datarails’ core consolidation value proposition (datarails.com/customers, June 2026; vendor-provided, not independently audited).
- $235M+ Venture Funding Across Multiple Rounds: Datarails has raised over $235M in total disclosed funding, including a $150M Series B (2022) and a $70M Series C led by One Peak (January 2026, per Datarails’ own announcement and SiliconAngle), demonstrating sustained investor confidence across multiple funding cycles in the Excel-native FP&A market position.
- Community-Recognized Fastest Mid-Market Implementation: The r/FPandA practitioner community consistently characterizes Datarails as the fastest-implementing dedicated FP&A platform in the mid-market tier (noting it as faster to implement than Vena Solutions specifically due to lower workflow configuration overhead) a community signal reflecting real deployment experience rather than vendor-marketed timelines (2024–2025 discussions).
Representative r/FPandA community sentiment (multiple threads, 2024–2025): “We were live on Datarails in about three weeks, faster than any other FP&A platform I’ve evaluated. The Excel interface meant nobody on the team complained about having to learn something new.”
Takeaway: The r/FPandA practitioner community consistently cites Datarails as the fastest-implementing dedicated FP&A platform in the mid-market tier, a signal based on real deployment experience, not vendor marketing timelines.
Limitations
- Pricing Opacity and Per-Module Escalation Risk: Datarails does not publish pricing, uses a per-module structure where initial contracts can escalate significantly as teams expand capabilities, and requires a full sales engagement before buyers can determine budget fit, a friction point cited in the r/FPandA community as a trust signal issue and labeled a “transparency issue compared to the broader market” in the 2026 Fuel Finance review.
- Feature Ceiling for Enterprise Multi-Domain Connected Planning: Datarails’ Excel-native architecture establishes a capability ceiling for organizations needing genuine multi-domain connected planning across Finance, HR, Supply Chain, and Sales simultaneously on a shared real-time model, use cases where cloud-native platforms like Anaplan or Planful provide meaningfully higher modeling ceilings and more appropriate architectures.
- Per-Module Expansion Risk for Growing Teams: Datarails customers who sign initial contracts without anticipating HR planning or advanced scenario modules face mid-contract negotiations to unlock capabilities that some competing platforms include by default, a dynamic buyers should address by budgeting all anticipated modules before signing, not as an afterthought.
- Excel Performance Ceiling for Very Large Models: Datarails, like all Excel-native platforms, inherits some of Excel’s computational limits for extremely large models, making it less suitable for large enterprises managing thousands of simultaneous planning dimensions across dozens of entities, where IBM Planning Analytics or Anaplan provide more appropriate scale.
Verdict
Datarails is the highest-rated dedicated FP&A platform in G2’s Budgeting and Forecasting category, earning its top ranking through industry-leading user satisfaction scores sustained across multiple consecutive G2 Grid cycles, the broadest mid-market ERP integration coverage in this comparison at 200+ native connections, and an Excel-native architecture that delivers implementation timelines measured in weeks.
For mid-market FP&A teams seeking to eliminate manual spreadsheet consolidation and add AI-assisted analysis without a disruptive platform migration, Datarails provides the strongest evidence-backed combination of user validation, integration depth, and time-to-value in this comparison.
Datarails’ primary trade-off (opaque per-module pricing requiring full sales engagement to assess total cost) should be factored explicitly into any evaluation timeline and RFP process.
2. Anaplan: Best for Enterprise-Scale Connected Planning
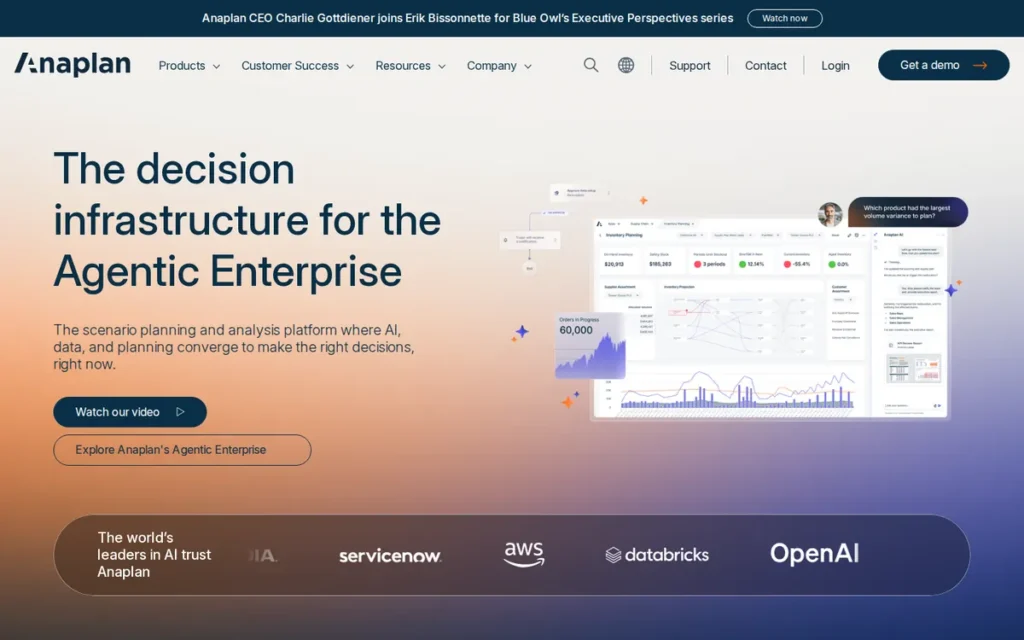
Category: Connected Planning Platform: unifies financial planning, workforce planning, sales performance management, and supply chain planning across the enterprise on a single real-time shared calculation engine, enabling plan changes in one function to propagate bidirectionally across all connected business domains without manual reconciliation.
At a Glance
- Category: Connected Planning Platform
- Best For: Enterprise organizations with $500M+ in annual revenue requiring integrated financial, workforce, sales, and supply chain planning on a shared real-time data model, particularly Fortune 500 and Global 2000 companies with multi-domain planning complexity across multiple business functions and geographies
- Price Range: ~$20,000–$500,000+/year; average enterprise contract estimated at ~$200,000/year; implementation consulting typically adds 1–3× the software license cost; no public list price as of June 2026
- Primary Strength: Anaplan’s HyperBlock™ engine enables real-time multi-dimensional connected planning across Finance, HR, Sales, and Supply Chain simultaneously on a shared data model, supported by 9 consecutive Gartner Magic Quadrant Leader designations in Financial Planning Software through 2025, the most sustained analyst validation of any platform in this comparison
- Biggest Limitation: Anaplan requires 1–3 dedicated model-building specialists to build and maintain planning models on an ongoing basis, creating significant staffing cost, key-person dependency risk, and an 8–24 week minimum implementation timeline that the r/FPandA community calls the “model builder trap,” structurally excluding mid-market buyers without dedicated transformation budgets
- One-Line Summary: Anaplan has been named a Gartner Magic Quadrant Leader in Financial Planning Software nine consecutive times through 2025, making it the enterprise benchmark for connected, multi-domain planning at Fortune 500 scale, and the highest total-cost-of-ownership platform in this comparison
- Last Verified: June 2026
Overview
Anaplan is an enterprise Connected Planning platform for organizations with $500M+ in annual revenue that need to unify financial planning, workforce planning, supply chain planning, and sales performance management on a single real-time shared data model, recalculating across all domains simultaneously without manual reconciliation between functions.
Anaplan’s proprietary HyperBlock™ in-memory engine enables calculations across thousands of dimensional intersections in real time, eliminating the model refresh latency of spreadsheet-based or less powerful cloud platforms when managing enterprise-scale multi-domain planning complexity.
Anaplan has been named a Gartner Magic Quadrant Leader in Financial Planning Software nine consecutive times through 2025, with publicly referenced enterprise customers including Procter & Gamble, HP Inc., Coca-Cola, General Mills, and Unilever.
Key Features
- HyperBlock™ Calculation Engine: Anaplan’s HyperBlock™ in-memory calculation engine processes complex, multi-dimensional financial models in real time across thousands of dimensional intersections, enabling enterprise planning complexity (revenue by product × region × channel × time period) to recalculate instantly when any assumption changes anywhere in the model.
- True Connected Planning Across Domains: Anaplan enables true multi-domain connected planning by linking FP&A, HR headcount planning, sales quota planning, and supply chain demand planning on a single shared data model, so a change in hiring assumptions in Anaplan automatically flows into the financial plan without a separate manual reconciliation step between functions.
- Enterprise-Grade Scenario Modeling: Anaplan provides enterprise-grade scenario modeling with multiple simultaneous plan versions, sensitivity analysis, and what-if simulations that cascade changes across all connected planning domains in real time, enabling finance teams using Anaplan to evaluate strategic alternatives at enterprise scales that spreadsheet models cannot accommodate.
- App Hub Pre-Built Planning Templates: Anaplan’s App Hub marketplace offers pre-built planning templates and industry-specific models for financial services, consumer goods, retail, and technology sectors, accelerating Anaplan implementation for common enterprise use cases without building every planning model from scratch.
- Enterprise Security and ERP Integrations: Anaplan integrates with SAP, Oracle, Salesforce, and Workday, with enterprise-grade security certifications (SOC 2, ISO 27001), role-based access controls, and audit trails meeting the governance requirements of publicly traded and regulated enterprises across all major geographies.
Best For
Anaplan is best for enterprise organizations with $500M+ in annual revenue (particularly Fortune 500 and Global 2000 companies) where Finance, HR, Sales, and Supply Chain teams currently plan in disconnected systems, creating manual reconciliation work and the inability to model cascading impacts of decisions across all planning domains in real time.
Anaplan is rarely the right choice for companies with fewer than $500M in revenue, where the total cost of ownership (software license plus implementation consulting plus ongoing model-builder specialist staffing) typically exceeds the value delivered relative to purpose-built mid-market alternatives such as Datarails or Planful. Specific situations (rapid enterprise-track growth, multi-domain complexity exceeding mid-market tools) can justify evaluation below this threshold.
Pricing
Anaplan does not publish pricing publicly as of June 2026. Based on analyst estimates and r/FPandA community-sourced data, annual software contract values range from approximately $20,000 for minimal entry deployments to $500,000+ for large multi-module enterprise implementations, with an estimated average enterprise contract of approximately $200,000/year.
Implementation consulting fees from Anaplan’s partner ecosystem typically add 1–3× the software license cost, meaning total first-year investment regularly exceeds $300,000–$400,000 for enterprise buyers. Multiple G2 reviewers specifically cite “sticker shock” as a top evaluation frustration (June 2026). Contact Anaplan’s enterprise sales team for pricing; engage multiple implementation partner quotes simultaneously to establish cost benchmarks.
Strengths
- Nine Consecutive Gartner Magic Quadrant Leader Designations: Anaplan has received nine consecutive Gartner Magic Quadrant Leader designations in Financial Planning Software through 2025, the most sustained independent analyst validation of any platform in this comparison, reflecting consistent scores on both “Completeness of Vision” and “Ability to Execute” across nearly a decade of annual evaluation cycles (Anaplan analyst research, 2025).
- Verified Fortune 500 Customer Deployments: Anaplan’s enterprise customer roster includes publicly referenced deployments at Procter & Gamble, HP Inc., Coca-Cola, General Mills, Unilever, and Boston Scientific, Fortune 500 organizations whose rigorous IT and finance procurement processes independently validated Anaplan’s enterprise-grade capabilities, security, and scalability before adoption.
- $10.7B Market Validation via Thoma Bravo Acquisition: Anaplan was acquired by Thoma Bravo in June 2022 for approximately $10.7 billion (one of the largest enterprise software acquisitions of that year) reflecting market-validated conviction in the strategic value of the connected planning category and Anaplan’s dominant position within it (Anaplan press releases, 2022).
- G2 Rating Sustained at Enterprise Scale: Anaplan’s G2 rating of 4.6/5.0 across 395–461 reviews is sustained by enterprise users who describe the HyperBlock™ engine’s real-time multi-domain recalculation as a differentiating capability not available in their evaluated alternatives for their specific planning model complexity, per G2 reviews as of June 2026.
Representative r/FPandA community sentiment (multiple threads, 2024–2025): “Anaplan is the gold standard if you can afford it and have someone to build the models. The problem is that ‘if you have someone’ part, when our model builder left, we couldn’t touch anything for six weeks until we found a consultant.”
Takeaway: Anaplan’s model-builder staffing requirement is a structural deployment cost, not a one-time setup expense, it must be budgeted annually as an FTE line item throughout the platform’s deployment life.
Limitations
- Mandatory Model-Builder Specialist Dependency (“Model Builder Trap”): Anaplan demands 1–3 dedicated Anaplan model-building specialists (distinct from the finance team’s functional users) who build, configure, and maintain planning models on an ongoing basis, creating key-person risk if specialists leave, significant ongoing staffing cost not included in the software license, and an 8–24 week minimum implementation timeline; the r/FPandA community specifically calls this the “Anaplan model builder trap” (2024–2025 discussions).
- Post-Acquisition Support Quality Decline: Multiple G2 reviewers and CFO Shortlist analysis document a decline in support responsiveness following Thoma Bravo’s 2022 private equity acquisition, a post-acquisition quality signal that enterprise buyers making 5–7 year platform commitments should explicitly investigate through reference checks with customers who implemented post-2022.
- Prohibitive Total Cost of Ownership for Mid-Market Buyers: Anaplan’s average enterprise contract of approximately $200,000/year plus 1–3× implementation consulting costs plus ongoing specialist staffing regularly pushes total first-year investment beyond $400,000, a financial threshold that eliminates Anaplan from consideration for the majority of mid-market companies where purpose-built alternatives at $24,000–$100,000/year deliver comparable or greater value.
- Data Architecture Lock-In After Implementation: Once an enterprise’s planning models are built in Anaplan’s proprietary model-building architecture, those models cannot be exported or migrated to another platform without a full rebuild, creating a structural switching cost that compounds annually with each model enhancement and should be assessed explicitly by buyers making multi-year commitments.
Verdict
Anaplan is the enterprise benchmark for connected planning, earned through nine consecutive Gartner Magic Quadrant Leader designations in Financial Planning Software, a publicly verifiable Fortune 500 customer roster, and the HyperBlock™ engine’s capability for real-time multi-domain planning at organizational scales that no other platform in this comparison approaches.
Anaplan belongs on the evaluation shortlist for every enterprise organization with $500M+ in revenue managing planning complexity across Finance, HR, Sales, and Supply Chain simultaneously.
Mid-market buyers should not be on that shortlist: Anaplan’s structural model-builder staffing requirement, 8–24 week implementation timelines, and average enterprise contracts of approximately $200,000/year deliver return only at organizational scales where that total investment is genuinely justified by documented planning complexity and multi-domain scope.
3. Planful: Best for Mid-Market Planning Plus Financial Close in One Platform
Category: Cloud FP&A Platform: a dual-engine cloud platform combining deterministic structured budgeting, flexible driver-based scenario modeling, and multi-entity financial consolidation in one system for mid-to-large-market finance teams managing the full annual planning and accounting close cycle.
At a Glance
- Category: Cloud FP&A Platform
- Best For: Finance teams at mid-to-large-market companies ($100M–$2B revenue) that need structured annual budget collection, dynamic driver-based scenario modeling, and multi-entity financial consolidation managed in a single platform, without maintaining separate tools for each workflow
- Price Range: ~$25,000–$100,000+/year depending on modules licensed (Structured Planning, Spotlight, Consolidation) and user count; 3–6 month implementation adds to first-year cost; no public list price as of June 2026
- Primary Strength: Planful is the only platform in this comparison that combines deterministic structured budgeting, flexible driver-based scenario modeling, and multi-entity financial consolidation for monthly close management in a single license, eliminating separate-tool overhead across the annual planning and accounting close cycle
- Biggest Limitation: Planful’s Structured Planning module features a dated user interface that consistently draws criticism in G2 and Gartner reviews, and implementation timelines of 3–6 months regularly exceed initial buyer estimates, requiring more change management investment than most mid-market teams budget for during procurement
- One-Line Summary: Planful is a Gartner Magic Quadrant Leader for Financial Planning Software that uniquely combines structured annual budgeting, dynamic driver-based scenario modeling, and multi-entity financial consolidation in one platform, with Planful Predict applying machine learning to company-specific actuals for rolling forecast automation
- Last Verified: June 2026
Overview
Planful is a cloud FP&A platform for mid-to-large-market companies ($100M–$2B revenue) that combines structured annual budgeting, dynamic driver-based scenario modeling, and multi-entity financial consolidation in a single system, the only platform in this comparison delivering all three workflows under one license.
Planful’s dual-engine architecture distinguishes Planful from single-mode competitors: the Structured Planning engine handles the rigid, permission-controlled annual budget process where department managers input against fixed templates, while Planful Spotlight Dynamic Planning enables flexible, assumption-driven scenario modeling and rolling forecasts for FP&A analysts.
Planful has been named a Gartner Magic Quadrant Leader for Financial Planning Software across multiple consecutive annual cycles, serving over 1,000 customers globally including Bain Capital, UFC, Kforce, and BJ’s Restaurants.
Key Features
- Structured Planning Engine: Planful’s Structured Planning engine provides a template-driven annual budget process with role-based contributor access, approval workflows, and audit trails, enabling department managers to submit budgets into controlled templates without access to the underlying financial model or other departments’ data.
- Spotlight Dynamic Planning: Planful Spotlight Dynamic Planning provides a flexible, driver-based modeling environment where FP&A analysts build rolling forecasts, run multi-scenario sensitivity analyses, and model assumption changes at the driver level without rebuilding templates or requiring IT configuration support.
- Financial Consolidation Module: Planful’s Financial Consolidation module handles multi-entity close management, intercompany eliminations, and consolidated financial statement preparation, extending Planful’s scope beyond forward-looking planning into the monthly accounting close process that most standalone FP&A tools cannot address.
- Planful Predict ML Forecasting: Planful Predict applies machine learning to each customer’s own historical actuals data to detect patterns, automatically generate rolling forecast adjustments, and flag statistical anomalies in budget variances, one of the few verified ML-based AI implementations in mid-market FP&A software where the model trains on company-specific data rather than generic industry benchmarks (verified against Planful product documentation, June 2026).
- Board-Ready Reporting with Narrative Commentary: Planful integrates with major ERP systems for automated actuals ingestion and generates board-ready reporting with narrative commentary, connecting variance analysis explanations directly to the underlying financial data in Planful, the same platform that produced the annual plan.
Best For
Planful is best for finance teams at mid-to-large-market companies ($100M–$2B revenue) where the annual budget collection process, monthly close and consolidation, and quarterly rolling forecasting are all managed by the same team using disconnected tools, and where consolidating these workflows into one platform would eliminate the manual reconciliation and data transfer overhead between systems.
Planful is particularly strong for multi-entity companies (subsidiaries, divisions, or international entities) that currently struggle with intercompany eliminations and consolidated reporting alongside their forward-looking planning process. Planful ranks above Workiva in this comparison because Planful’s primary mission is FP&A planning, while Workiva’s primary mission is regulatory compliance.
Pricing
Planful does not publish pricing publicly as of June 2026. Based on market analysis and r/FPandA community discussions, annual contract values typically range from $25,000 to $100,000+/year, varying significantly by which modules are licensed and by user count.
Planful’s modular structure means buyers must identify which use cases they need before pricing discussions to avoid surprises when adding capabilities later. Implementation fees for the 3–6 month deployment add materially to total first-year cost. Engage Planful’s sales team for a module-specific quote and include all anticipated workflows before signing to avoid incremental licensing costs during deployment.
Strengths
- Consecutive Gartner Magic Quadrant Leader Designations: Planful has received Gartner Magic Quadrant Leader designation in Financial Planning Software across multiple consecutive annual reports through 2025, independent analyst validation reflecting consistent scores on both “Completeness of Vision” and “Ability to Execute” across multiple evaluation cycles (Gartner Financial Planning Software, 2025).
- One of the Only Verified ML-Based Forecasting Engines in Mid-Market: Planful Predict is one of the few genuinely verified ML-based forecasting implementations in mid-market FP&A, applying machine learning trained specifically on each customer’s own historical actuals to generate rolling forecast adjustments, rather than applying generic industry benchmarks or rule-based automation relabeled as AI (verified against Planful product documentation, June 2026).
- Unique Dual-Engine Architecture in a Single License: Planful’s dual-engine architecture provides both a rigid, permission-controlled budget collection environment (Structured Planning) and a flexible driver-based scenario modeling environment (Spotlight) within a single license, no other platform in this comparison replicates this combination for the mid-to-large-market tier, eliminating the separate-tool overhead most mid-market finance teams currently manage.
- Community-Validated “Pragmatic Enterprise Upgrade” Positioning: The r/FPandA practitioner community consistently recommends Planful as the pragmatic enterprise upgrade path for finance teams at $100M–$500M companies (characterizing it as “the right amount of power for a 3-person FP&A team at a $250M company”) a community-validated use-case fit that helps mid-market buyers self-qualify before entering a sales process (2024–2025 discussions).
Limitations
- Implementation Timeline Consistently Exceeds Initial Estimates: Planful’s most consequential trade-off is the gap between expected and actual implementation scope, finance teams typically enter procurement expecting 3 months and experience 4–6 months, because data quality preparation, process standardization, and internal change management create the extension rather than the software itself; Gartner Peer Insights reviews for Planful consistently identify “implementation time” and “change management requirements” as the top buyer underestimations (2024–2025 reviews).
- Dated Structured Planning User Interface: Planful’s Structured Planning module features a user interface that draws consistent criticism in G2 reviews relative to newer cloud-native tools, buyers should evaluate the specific module interfaces during a demo, as the Spotlight Dynamic Planning interface is notably more modern than the older Structured Planning environment, and teams whose workflow centers on Structured Planning face a steeper UI adjustment (June 2026).
- Spotlight Proprietary Formula Syntax Requires Analyst Training: Planful’s Spotlight Dynamic Planning module, while genuinely powerful for scenario modeling, requires FP&A analysts to learn a proprietary formula syntax distinct from Excel, a capability investment that creates a dependency on trained analysts comparable in scope to the model-builder issues in enterprise platforms, though not in complexity.
- Customer Support Quality Inconsistency: Planful’s G2 reviews show inconsistent customer support ratings across the 450+ review base (with some users reporting excellent experiences while others cite slow response times) suggesting regional or tier-based service quality variance that buyers should investigate through explicit reference checks with comparable-size customers in the same geography before signing.
Verdict
Planful is the strongest mid-to-large-market FP&A platform for organizations that need structured budget collection, dynamic scenario modeling, and multi-entity financial consolidation managed in a single system, a workflow combination no other platform in this comparison delivers under one license.
Planful’s Gartner Magic Quadrant Leader designation across multiple consecutive cycles, the ML-based Planful Predict forecasting engine trained on company-specific actuals, and its clearly defined r/FPandA community use-case reputation for $100M–$500M companies make it the most credible mid-market alternative to Datarails for finance teams that also need financial close management capabilities.
Buyers should budget 4–6 months for implementation and include a formal change management plan in the project scope, not as contingency, but as a required workstream that determines whether the deployment succeeds on schedule.
4. Workiva: Best for Public Companies and Compliance-Driven Organizations
Category: Connected Reporting and Planning Platform: integrates SEC/XBRL regulatory filing, ESG disclosure, SOX internal audit controls, and financial planning in one connected audit-trail system where any data change propagates automatically across all linked financial statements, regulatory filings, and management reports.
At a Glance
- Category: Connected Reporting and Planning Platform
- Best For: Publicly traded companies, large private companies approaching IPO, regulated financial institutions, and government entities that need SEC/XBRL filing, ESG/CSRD reporting, SOX compliance, and financial planning in one connected system with a complete, immutable audit trail, not teams selecting a platform primarily for standalone FP&A budgeting
- Price Range: ~$50,000–$150,000+/year; enterprise average contracts approximately $123,000 based on $739M FY2024 revenue ÷ 6,000+ customers (Workiva SEC filing, February 2025); planning module alone rarely justifies the investment without compliance modules; no public list price as of June 2026
- Primary Strength: Workiva’s connected data model automatically propagates any number change across all linked financial statements, regulatory filings, board presentations, and ESG reports, eliminating the manual re-linking errors that create audit findings and SEC comment letter risk in Excel-based multi-document reporting workflows
- Biggest Limitation: Workiva is not designed primarily as an FP&A budgeting and forecasting tool, organizations selecting Workiva for planning alone will significantly overpay relative to purpose-built FP&A platforms, and the budgeting capabilities in isolation do not justify $50,000–$150,000+/year for companies without mandatory SEC, ESG, or SOX reporting obligations
- One-Line Summary: Workiva is the only platform in this comparison that unifies SEC filing, ESG reporting, SOX compliance, and financial planning in one connected audit trail, serving 6,000+ customers with 1,800+ G2 reviews and $739 million in FY2024 revenue as NYSE: WK, the highest financial validation of any platform in this comparison
- Last Verified: June 2026
Overview
Workiva is a connected financial and ESG reporting platform for publicly traded companies and regulated enterprises that need to unify SEC filing, ESG disclosure, SOX internal audit, and financial planning in a single system with a complete, immutable audit trail, not a standalone FP&A budgeting tool.
Workiva’s Wdesk platform maintains a single source of truth where any change to an underlying number propagates automatically across all connected documents (financial statements, MD&A narrative, board presentations, proxy filings, and regulatory disclosures) eliminating the manual re-linking processes that create reporting errors and audit risk for public companies.
Workiva serves 6,000+ customers globally and reported FY2024 revenue of $739 million as a NYSE-listed public company (ticker: WK), per the company’s Q4 and Full Year 2024 Financial Results filed with the SEC in February 2025, the only fully audited public financials of any platform in this comparison.
Key Features
- Connected Data Model for Real-Time Document Updates: Workiva’s connected data model creates live links between every number in the Wdesk platform, so when any figure is updated in a source system, that change propagates automatically across all connected financial statements, regulatory filings, board presentations, and ESG reports, maintaining a single always-current source of truth without manual refresh.
- SEC Filing with XBRL and iXBRL Tagging: Workiva provides full SEC filing capability including XBRL and iXBRL tagging for 10-K, 10-Q, 8-K, and proxy filings, with automated XBRL validation to reduce tagging errors and the risk of SEC comment letters that require costly remediation and refiling.
- ESG and Sustainability Reporting Frameworks: Workiva includes ESG and sustainability reporting support aligned with major disclosure frameworks (CSRD, GRI, TCFD, and SASB) enabling companies to manage both financial and non-financial regulatory disclosure in the same platform and audit trail, eliminating the separate-system overhead most compliance teams currently manage.
- Immutable Audit Trail for SOX and External Audit: Workiva’s audit trail logs every data change with timestamp, user identity, source system attribution, and prior value in an immutable record, cited in the large majority of positive G2 reviews for Workiva as the primary stated reason for purchase, particularly among external audit preparation and SOX compliance teams (June 2026 G2 data).
- Financial Planning Integration with Regulatory Documents: Workiva includes financial planning and budgeting capabilities that connect budget and forecast data directly to management reporting documents, so as actuals update in Workiva, variance commentary in board presentations and investor materials reflects current figures without manual data re-entry or document re-linking.
Best For
Workiva is best for publicly traded companies, large private companies within 12–24 months of an IPO, regulated financial institutions, and government entities where the cost and risk of disconnected reporting workflows (manual copy-paste between financial models and regulatory documents, XBRL tagging errors, and inconsistent ESG disclosures) exceeds the investment in a unified platform.
Workiva is explicitly not the right choice for private mid-market companies whose primary need is FP&A budgeting and scenario modeling without compliance and regulatory reporting obligations. For private mid-market companies without these obligations, every other platform in this comparison delivers more planning value at substantially lower cost.
Pricing
Workiva does not publish pricing publicly as of June 2026. Based on Workiva’s investor relations disclosures, FY2024 revenue of $739 million (Workiva Q4 and Full Year 2024 Financial Results, SEC filing, February 2025) across 6,000+ customers implies an average revenue per customer of approximately $123,000, consistent with enterprise-tier contract benchmarks.
Workiva’s planning module alone rarely justifies its pricing; the platform’s economics work when multiple compliance and reporting modules are consolidated. Engage Workiva’s enterprise sales team for a module-specific quote that includes all use cases being evaluated, not just planning.
Strengths
- Only NYSE-Listed Vendor with Fully Audited Public Financials: Workiva reported FY2024 revenue of $739 million growing at a 15–20% CAGR as NYSE: WK (Workiva Q4 and Full Year 2024 Financial Results, SEC filing, February 2025), the only fully audited public company among the seven platforms in this comparison, providing financial health transparency that substantially reduces vendor stability risk for buyers making long-term multi-year platform commitments.
- Highest Absolute G2 Review Count at 1,800+ Reviews: Workiva holds 1,800+ G2 reviews at 4.4/5.0 (the highest absolute review count in this comparison by a factor of 4×) reflecting an active installed base of 6,000+ customers with sustained platform engagement; the audit trail capability is consistently cited in the large majority of positive G2 reviews as the primary stated reason for purchase (PlugRoute content analysis, June 2026).
- Connected Data Model Eliminates High-Cost Reporting Errors: Workiva’s real-time connected data model eliminates a specific, high-cost class of reporting error (manually re-linking stale numbers across multiple document types when actuals or forecasts change) a workflow that, for public companies issuing quarterly SEC filings, previously required dedicated teams spending multiple days per reporting cycle with significant audit error and SEC comment letter risk.
- ESG and CSRD Convergence Positioning: Workiva’s ESG and CSRD reporting capabilities, combined with its financial reporting platform, position Workiva as the only vendor in this comparison addressing the growing convergence of financial and sustainability disclosure requirements, a regulatory obligation expanding for public companies under SEC climate rules and European CSRD mandates that will affect an increasing share of enterprise buyers through 2030.
Limitations
- Fundamental Category Mismatch for Pure FP&A Buyers: Workiva’s most consequential limitation is category fit rather than product quality, Workiva is a compliance and regulatory reporting platform that includes planning capabilities, not an FP&A platform that also handles compliance; r/Accounting and r/FinancialCareers communities discuss Workiva almost exclusively in the context of SEC filing, XBRL, and audit preparation, not in r/FPandA budgeting discussions, confirming that the planning use case is secondary to its compliance mission (2024–2025 community data).
- Significant Overpayment Risk for Non-Compliance Buyers: Organizations selecting Workiva for budgeting without SEC, ESG, or SOX obligations pay $50,000–$150,000+/year for planning capabilities that purpose-built FP&A platforms provide more comprehensively at lower cost, making Workiva a poor value choice for the majority of the primary FP&A audience at private mid-market companies.
- Limited Planning Module Validation from Dedicated FP&A Users: Workiva’s financial planning module receives notably fewer G2 reviews specifically praising budgeting and forecasting features compared to its audit trail and reporting features, meaning the planning capabilities have less independent validation from dedicated FP&A users than the compliance modules do, a buyer-relevant signal about the relative depth of each module.
- High Switching Costs Create Lock-In After Adoption: Workiva’s switching costs (rebuilding years of linked document relationships and XBRL tag structures on an alternative platform) keep customers on the platform longer than satisfaction alone might justify; buyers should assess this lock-in effect explicitly before committing, as high retention rates may partially reflect exit barriers rather than purely voluntary platform preference.
Verdict
Workiva is the strongest-evidenced platform in this comparison for publicly traded companies and regulated enterprises that need to unify SEC filing, ESG reporting, SOX internal controls, and financial planning in one connected system with a complete audit trail, a combination no other platform in this comparison delivers.
Workiva’s 1,800+ G2 reviews, $739 million in FY2024 revenue as a NYSE-listed company, and the immutable audit trail consistently cited as a primary purchase driver in the large majority of its G2 reviews make it the highest-confidence, highest-financial-health choice for compliance-first buyers.
For organizations without mandatory regulatory reporting obligations (the majority of the primary FP&A audience) Workiva represents a significant category mismatch, and any purpose-built FP&A platform in this comparison will deliver greater planning value at substantially lower cost.
5. Vena Solutions: Best for Excel-Native Workflow Governance and Microsoft Ecosystem Alignment
Category: Excel-Native Planning Platform: governs collaborative financial, HR, and operational planning through a SQL database backbone beneath the native Excel interface, with configurable multi-stage approval workflows, cell-level role-based access controls, and complete audit trails enabling enterprise-grade process governance within the spreadsheet environment.
At a Glance
- Category: Excel-Native Planning Platform
- Best For: Mid-to-upper-market finance teams (100–1,000 employees) in Microsoft-centric organizations (Dynamics 365, Azure, Power BI) that need Excel-native familiarity combined with enterprise-grade multi-stage approval workflows, audit trails, and cross-functional planning coverage including HR and workforce cost modeling
- Price Range: ~$25,000–$120,000+/year depending on module selection and user count; implementation partner fees add substantially to total first-year cost; no public list price as of June 2026
- Primary Strength: Vena Solutions provides configurable multi-stage approval chains, cell-level role-based access controls, and a complete audit trail (making it the Excel-native FP&A platform with the deepest workflow governance capabilities in this comparison) within the native Microsoft Excel interface, without requiring migration to a new user environment
- Biggest Limitation: Vena Solutions implementations consistently require an authorized Vena implementation partner, adding third-party project management cost and timeline uncertainty on top of software licensing, a structural deployment dependency that extends time-to-value and total first-year investment beyond what Datarails or LiveFlow require in the comparable Excel-native and SMB segments
- One-Line Summary: Vena Solutions is the Excel-native FP&A platform with the deepest workflow governance capabilities in this comparison (configurable approval chains, cell-level access controls, and a complete audit trail) recognized by Gartner and purpose-built for mid-to-upper-market organizations in Microsoft ecosystems managing collaborative financial, HR, and operational planning
- Last Verified: June 2026
Overview
Vena Solutions is an Excel-native Complete Planning platform for mid-to-upper-market organizations with 100–1,000 employees that need enterprise-grade workflow governance (configurable multi-stage approval chains, role-based access controls, and audit trails) layered on top of the native Microsoft Excel interface their finance teams already rely on.
Vena Solutions adds a SQL database backbone beneath Excel that manages centralized data storage, version control, multi-user collaboration, and workflow automation, providing more process governance depth than other Excel-native alternatives while maintaining the spreadsheet surface that drives finance team adoption without change resistance.
Vena Solutions extends beyond financial planning to cover HR and workforce planning through its Complete Planning framework, enabling Finance and HR to collaborate on headcount cost models within the same platform and planning cycle.
Key Features
- SQL-Database-Backed Excel Governance: Vena Solutions preserves the native Microsoft Excel interface while adding a centralized SQL database that eliminates version conflicts, manages multi-user data entry across department contributors without file locking, and maintains a complete audit trail of every change across the entire budget and forecast cycle.
- Configurable Multi-Stage Approval Workflows: Vena Solutions provides configurable multi-stage approval workflows with role-based access controls at the cell level, enabling organizations to design their specific budget approval hierarchy (department manager → cost center owner → division VP → CFO sign-off) within the Excel-native environment rather than through a separate workflow system.
- Complete Planning Framework Across Finance and HR: Vena Solutions’ Complete Planning framework covers financial planning (P&L, balance sheet, cash flow forecasting), HR and workforce planning (headcount modeling, compensation planning), and operational planning, enabling Finance and HR to collaborate on workforce cost models within the same platform and planning cycle.
- Microsoft Ecosystem First-Class Integrations: Vena Solutions integrates with Microsoft Dynamics 365, NetSuite, SAP, Oracle, Sage Intacct, ADP Workforce Now, Power BI, and Tableau, with particularly strong Microsoft Dynamics 365 integration performance for organizations in Azure-centric IT environments that benefit from within-ecosystem data governance.
- Management Reporting and Board Package Automation: Vena Solutions generates presentation-ready financial reports and variance commentary from the same connected data model that drives the budget and forecast, eliminating the manual rebuild of board materials each reporting cycle and connecting narrative commentary directly to underlying financial data.
Best For
Vena Solutions is best for mid-to-upper-market finance teams at 100–1,000 employee organizations in Microsoft-centric environments where the annual budget process requires a formal governance structure (specific multi-stage approval chains, auditability of every contribution, and role-based access enforcement) that current spreadsheet workflows cannot enforce.
Vena Solutions is the right choice over Datarails when an organization’s primary pain point is budget process governance and approval accountability (who approved what, when, and with what data) rather than implementation speed or raw ERP integration breadth.
Pricing
Vena Solutions does not publish pricing publicly as of June 2026. Based on market research and r/FPandA community discussions, annual contract values typically begin around $25,000–$40,000/year for the base platform and range to $120,000+/year for larger organizations licensing thefull Complete Planning module suite.
Most Vena Solutions implementations involve authorized Vena implementation partners whose fees add materially to total first-year cost. Request an all-in cost estimate (software license + partner implementation fees + internal team time) to understand the true total first-year investment before comparing Vena Solutions against Datarails on software price alone. Implementation partner cost is a structural feature of the Vena deployment model, not an optional add-on.
Strengths
- Gartner Recognition with Documented Consolidation Time Reductions: Vena Solutions has been recognized in the Gartner Magic Quadrant for Financial Planning Software, with Gartner Peer Insights reviewers documenting 50–80% reductions in financial consolidation time across reviewers who reported measurable consolidation outcomes, outcomes that directly map to the version conflict and consolidation overhead that drives mid-market adoption of Excel-native platforms over unmanaged spreadsheet processes (Gartner Peer Insights, 2024–2025 reviews).
- Fintech-Specialist Investor Backing from Centana Growth Partners: Vena Solutions received backing from Centana Growth Partners (a private equity firm investing exclusively in financial technology companies) providing domain-specialist investor oversight and fintech sector validation that general PE or VC investors cannot offer, signaling that Vena Solutions’ market position has been evaluated by investors with deep FP&A software sector expertise.
- First-Class Microsoft Ecosystem Alignment: Vena Solutions’ native Excel interface combined with first-class Dynamics 365 and Power BI integrations on Azure infrastructure makes Vena Solutions the natural FP&A platform for Microsoft-centric organizations, reducing data governance overhead and integration complexity compared to non-Microsoft FP&A tools connecting into Azure environments where data residency and governance policies favor within-ecosystem solutions.
- Community-Validated Governance Differentiation from Datarails: The r/FPandA practitioner community positions Vena Solutions as the Excel-native choice for organizations needing deeper workflow customization than Datarails provides, describing it as “the grown-up version of spreadsheet budgeting” where Excel familiarity is preserved but process control and approval governance are enforced at an enterprise level (2024–2025 discussions).
Limitations
- Mandatory Implementation Partner Dependency Adds Cost and Timeline Risk: Vena Solutions’ most consequential trade-off is its implementation dependency on the Vena partner ecosystem, most deployments require an authorized Vena implementation partner who introduces third-party project management overhead, additional cost beyond the software license, and timeline uncertainty that buyers consistently underestimate; this structural requirement means Vena Solutions’ effective first-year investment is higher than software licensing alone suggests, and implementation outcome quality is partially dependent on the partner firm selected (r/FPandA community discussions, 2024–2025).
Users on r/FPandA shared their experience:
“I’m looking for the best way to get my boss to give up on this fools errand and start focusing on something else. I want to convey to my boss that we are falling into the sunk cost fallacy. The fact that three years have passed without going live on Vena is already a significant concern.” Posted by u/gooby1985
Takeaway: Vena Solutions implementation timelines stretching three years without going live are a documented pattern in the r/FPandA community (not outliers) requiring buyers to build explicit stop-loss milestones into any deployment contract before signing.
- ERP Data Mapping Overhead Extends Implementation Timelines: Vena Solutions’ data mapping layer (which connects ERP actuals to Excel templates) requires more initial configuration than Datarails’ lighter-touch integration approach, adding setup time even after the implementation partner begins work; r/FPandA community members specifically note this data mapping overhead contributes to longer timelines compared to Datarails in the same Excel-native tier (2024–2025 discussions).
- Performance Ceiling for Very Large Excel Models: Vena Solutions’ performance with very large or complex Excel models can degrade as SQL database query volumes scale (a ceiling that cloud-native platforms like Anaplan or Planful do not share) making Vena Solutions best suited to mid-market organizations rather than large enterprises managing extremely complex multi-entity or multi-dimensional planning models.
- Pricing Opacity Requiring Dual Vendor Engagement: Vena Solutions, like most mid-market FP&A platforms, does not publish pricing, requiring buyers to navigate both a software sales process and an implementation partner selection process before understanding total cost, creating a significantly longer and more complex evaluation timeline than platforms with self-serve pricing or direct deployment models.
Verdict
Vena Solutions is the strongest Excel-native FP&A platform in this comparison for organizations that need enterprise-grade workflow governance (configurable multi-stage approval chains, cell-level access controls, and complete audit trails) alongside HR and operational planning coverage that Datarails does not match in depth.
For Microsoft-centric organizations where Dynamics 365, Power BI, and Azure are already the data infrastructure, Vena Solutions’ ecosystem alignment provides integration advantages that non-Microsoft platforms cannot replicate.
Buyers should enter procurement with a clear understanding that implementation partner dependency is a structural feature of the Vena Solutions deployment model (not an optional consideration) and should budget implementation partner fees alongside software licensing in any total cost comparison against Datarails or other alternatives.
6. LiveFlow: Best for SMBs, Startups, and Accounting Firms
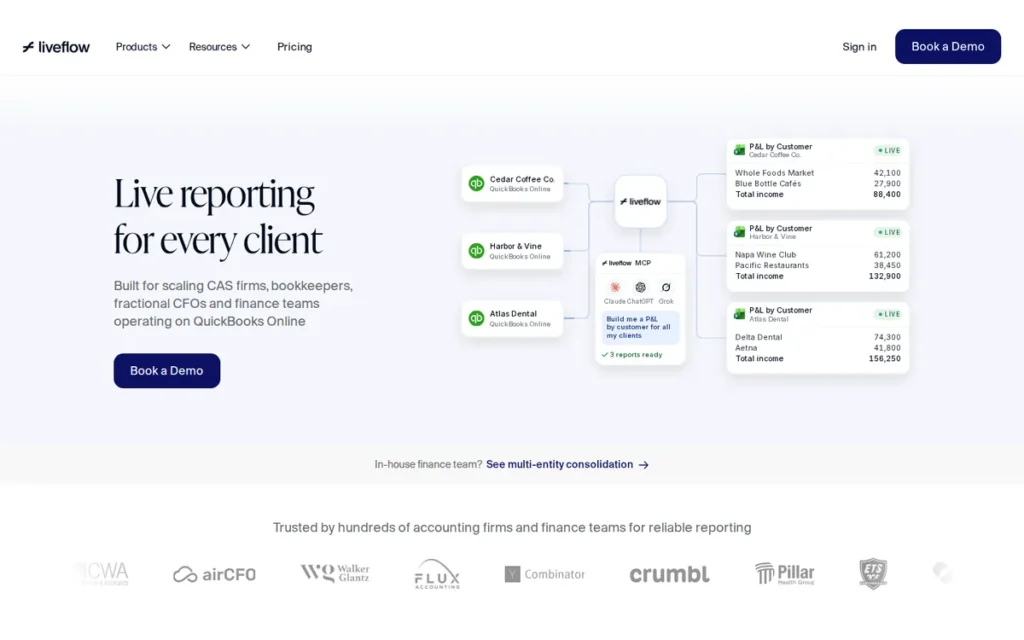
Category: Spreadsheet-Connected Reporting Tool: creates live, automatically refreshing data connections between accounting software (QuickBooks Online, Xero, NetSuite) and Google Sheets or Excel, syncing actuals into 100+ pre-built financial model templates for real-time reporting without manual CSV exports, formula maintenance, or IT involvement.
At a Glance
- Category: Spreadsheet-Connected Reporting Tool
- Best For: Small businesses (1–50 employees), accounting firms managing multiple SMB clients, and startup finance teams that need live-data financial reporting in Google Sheets or Excel without IT involvement, enterprise contracts, multi-month implementations, or annual commitments exceeding $1,000
- Price Range: $24/month (Starter), $79/month (Professional), custom (Business firm tier), the only platform in this comparison with publicly listed, self-serve pricing; free trial available with no sales call required
- Primary Strength: LiveFlow creates a live data connection from QuickBooks Online, Xero, or NetSuite into Google Sheets in under one hour, automatically syncing actuals into 100+ pre-built financial model templates without CSV exports, manual data entry, or IT involvement, at a price point ($24–$79/month) accessible to any small business or accounting firm
- Biggest Limitation: LiveFlow is constrained by Google Sheets’ native performance ceiling, companies with approximately 10,000+ transaction rows will experience latency in complex financial model calculations, a technical limit that establishes a hard scalability boundary making LiveFlow unsuitable for mid-market and enterprise data volumes
- One-Line Summary: LiveFlow is the fastest-setup and only transparently priced budgeting and reporting platform in this comparison, enabling accounting firms and small business finance teams to publish live financial reports from QuickBooks, Xero, or NetSuite into Google Sheets in under one hour at $24–$79 per month
- Last Verified: June 2026
Overview
LiveFlow is a spreadsheet-connected financial reporting platform for small businesses, accounting firms, and startup finance teams that creates live data connections between QuickBooks Online, Xero, or NetSuite and Google Sheets or Excel, automatically syncing actuals into pre-built templates in under one hour without manual exports or IT involvement.
LiveFlow’s 100+ pre-built financial model templates, covering P&L by month, cash flow forecasts, budget vs. actuals trackers, department spend dashboards, SaaS business metrics (ARR, churn, CAC, LTV), and multi-entity consolidated reports, enable non-technical users to deploy professional-quality financial reporting immediately after connecting their accounting system.
LiveFlow is the only platform in this comparison with publicly listed self-serve pricing at $24–$79/month, making LiveFlow the only option that can be evaluated, purchased, and deployed without a vendor sales engagement, as of June 2026.
Key Features
- Live Accounting System Data Sync: LiveFlow creates live, automatically refreshing data connections between QuickBooks Online, Xero, and NetSuite and Google Sheets or Excel, eliminating the CSV export, copy-paste, and formula maintenance cycle that accounts for the majority of manual reporting time in small business finance workflows, and replacing it with automatic synchronization on a scheduled or on-demand basis.
- 100+ Pre-Built Financial Model Templates: LiveFlow’s template library includes P&L reporting by month, cash flow forecasting, budget vs. actuals trackers, department spend dashboards, SaaS business metrics (ARR, churn, CAC, LTV), and multi-entity consolidated reports, deployable immediately without building models from scratch, enabling non-technical finance users to publish professional financial reports on day one.
- Multi-Entity Consolidation for Accounting Firms: LiveFlow’s multi-entity consolidation feature automatically aggregates financial data from multiple QuickBooks Online or Xero entities into a single Google Sheets report, enabling accounting firms to consolidate client portfolios and holding companies to consolidate subsidiaries without enterprise consolidation software or hours of end-of-month manual work.
- Transparent Self-Serve Pricing with Free Trial: LiveFlow offers publicly listed self-serve pricing with a free trial period, the only platform in this comparison that allows buyers to evaluate, purchase, and initiate a subscription without a sales call, vendor demonstration, IT procurement process, or multi-week evaluation cycle, as of June 2026.
- Dual Spreadsheet Platform Support: LiveFlow integrates natively with both Google Workspace (Google Sheets) and Microsoft Excel, supporting teams in both G Suite and Office 365 environments and enabling live financial dashboards that update automatically when accounting system data changes without requiring any manual refresh or re-export trigger.
Best For
LiveFlow is best for accounting firms automating client reporting across multiple QuickBooks or Xero entities in Google Sheets, startup finance teams at sub-50-employee companies that need professional-quality financial reporting without enterprise contracts or IT infrastructure, and small business owners who want live budget vs. actuals tracking without multi-month implementations or annual commitments exceeding $1,000.
LiveFlow is explicitly not suitable as a replacement for dedicated FP&A platforms at companies exceeding approximately 50 employees or $20M in revenue, where data volumes, scenario modeling requirements, and ERP integration complexity exceed what the Google Sheets architecture can support.
Pricing
LiveFlow publishes pricing publicly as of June 2026, the only platform in this comparison to do so. Plans available at liveflow.com/pricing:
- Starter: $24/month: basic Google Sheets integration, limited entities, core template library
- Professional: $79/month: full feature set, multiple entities, advanced template library, priority support
- Business: Custom pricing: for accounting firms and enterprise-level needs with dedicated support
All plans include a free trial period with no sales call required. LiveFlow is the only platform in this comparison where a buyer can determine budget fit, conduct a full evaluation, and initiate a subscription without engaging a sales team.
Strengths
- Tied for Highest G2 Rating with Documented Sub-1-Hour Setup: LiveFlow’s G2 rating of 4.7/5.0 across 100+ reviews (tied for the highest in this comparison alongside Datarails) is earned from reviewers consistently citing sub-1-hour setup as the defining value, with multiple reviews specifically reporting “live in 30 minutes” from initial account connection to first real-time financial report, a time-to-value no other platform in this comparison approaches (June 2026).
- Institutional Investor Backing from Y Combinator, Valar Ventures, and WndrCo: LiveFlow was backed by Y Combinator (S21 batch, Summer 2021), Valar Ventures, WndrCo, Moonfire Ventures, and Seedcamp, per LiveFlow’s investor page (liveflow.com/investors) and TechCrunch Series A coverage (December 2021), with approximately $17M in total disclosed funding ($3.5M seed, 2021; $13.5M Series A, 2022), providing institutional credibility signals proportional to LiveFlow’s SMB-focused segment.
- Multi-Entity Consolidation at SMB Price Point: LiveFlow’s multi-entity consolidation capability (automatically aggregating financial data from multiple QuickBooks or Xero client entities into a single Google Sheets report at $24–$79/month) delivers a function that previously required enterprise consolidation software (Planful, Workiva) at enterprise pricing, representing a genuinely accessible capability for accounting firms serving SMB clients.
- Grassroots r/Accounting Community Endorsement: The r/Accounting and r/QuickBooks communities recommend LiveFlow as the strongest solution for accounting firms automating client reporting in Google Sheets (contrasting it favorably against more expensive alternatives such as Fathom and Spotlight Reporting for the sub-$5M client segment (2024–2025 discussions)) a practitioner endorsement based on real-world use rather than vendor marketing.
Representative r/Accounting community sentiment (multiple threads, 2024–2025): “Switched from building reports manually in Sheets to LiveFlow last year. Setting up a new client takes under 30 minutes now instead of half a day. The price difference compared to Fathom makes it a no-brainer for our smaller clients.”
Takeaway: The r/Accounting community’s consistent recommendation of LiveFlow over more expensive alternatives confirms its segment leadership for accounting firms serving sub-$5M clients, at a fraction of enterprise-tool pricing.
Limitations
- Google Sheets Performance Ceiling at ~10,000+ Transaction Rows: LiveFlow’s most consequential limitation is a technical ceiling inherited from its architecture rather than created through its own quality, Google Sheets’ native performance degrades for companies with more than approximately 10,000 transaction rows, producing latency in complex financial model calculations; this boundary has nothing to do with LiveFlow’s own performance but establishes a hard scalability limit making LiveFlow unsuitable for mid-market and enterprise data volumes (r/Accounting and r/smallbusiness discussions, 2024–2025).
- No Complex Scenario Planning or Driver-Based Modeling: LiveFlow does not offer the complex scenario planning, driver-based modeling, multi-dimensional what-if analysis, or enterprise audit trails that make dedicated FP&A platforms appropriate for organizations with 50+ employees and $20M+ in revenue, LiveFlow is a professional financial reporting tool, not an FP&A planning platform, and should be evaluated strictly within its SMB and accounting-firm segment.
- No AI-Assisted Forecasting or Predictive Analytics: LiveFlow does not offer ML-based predictive forecasting or LLM-based natural language querying of financial data (capabilities present in Datarails (FP&A Genius AI) and Planful (Planful Predict)) reflecting LiveFlow’s positioning as a real-time reporting tool rather than a full FP&A analytical platform; buyers whose requirements include AI-assisted forecasting should evaluate Datarails or Planful instead.
- NetSuite Multi-Entity Consolidation Gaps for Some Use Cases: LiveFlow’s multi-entity consolidation feature does not support NetSuite-to-NetSuite multi-entity consolidation with full intercompany eliminations, a gap that becomes relevant for holding companies or accounting firms with clients on NetSuite mid-market ERP, where manual elimination entries are still required outside the platform for complex intercompany transactions.
Verdict
LiveFlow is the most accessible, fastest-deploying, and only transparently priced budgeting and reporting platform in this comparison, the best-evidenced choice for small businesses, accounting firms managing multiple SMB clients, and startup finance teams that need live-data financial reporting in Google Sheets without enterprise contracts, implementation timelines, or sales-call requirements.
LiveFlow’s 4.7/5.0 G2 rating tied for the highest in this comparison, institutional backing from Y Combinator and Valar Ventures, grassroots r/Accounting practitioner endorsement, and the unique distinction of being the only platform in this comparison with publicly listed self-serve pricing confirm LiveFlow’s segment leadership.
Organizations with more than approximately 50 employees, $20M+ in revenue, or complex scenario planning and driver-based modeling requirements have architecturally outgrown LiveFlow and should evaluate dedicated FP&A platforms beginning with Datarails.
7. IBM Planning Analytics: Best for Complex Enterprise Multi-Dimensional OLAP Modeling
Category: Enterprise OLAP Planning Platform: in-memory TM1 multidimensional calculation engine for complex financial modeling across thousands of simultaneous data dimensions (SKU × market × time × cost category), with hybrid SaaS and on-premise deployment options for regulated industries with data residency requirements prohibiting pure cloud storage.
At a Glance
- Category: Enterprise OLAP Planning Platform
- Best For: Large enterprises ($500M+ revenue) with extremely complex multi-dimensional planning models (particularly manufacturing, retail, and financial services companies with thousands of intersecting planning dimensions) that have existing IBM ecosystems, established TM1 installations with high migration costs, or data residency requirements preventing pure cloud deployment
- Price Range: ~$70–$90/user/month SaaS on IBM Cloud; on-premise perpetual licensing + 20–22% annual maintenance fees also available; total annual spend typically exceeds $150,000–$500,000+ when infrastructure, implementation consulting, and TM1 administrator staffing are included; no public list price as of June 2026
- Primary Strength: IBM Planning Analytics’ TM1 in-memory OLAP engine processes calculations across thousands of simultaneous data dimensions in seconds, a genuine computational differentiation for enterprises with extremely large, multi-dimensional planning models that cause performance degradation in every other platform in this comparison
- Biggest Limitation: IBM Planning Analytics requires 1–3 dedicated TM1 technical administrators separate from the finance team’s functional users, creating ongoing specialist staffing cost, key-person dependency risk, and 12–24+ week implementation timelines that give IBM Planning Analytics the highest total cost of ownership of any platform in this comparison
- One-Line Summary: IBM Planning Analytics delivers the TM1 in-memory OLAP engine’s multi-dimensional calculation power for enterprises with complex planning model requirements that no cloud-native FP&A platform can match, but demands dedicated specialist administrators and the highest total cost of ownership in this comparison, making it the right choice only when TM1’s computational ceiling genuinely justifies its specialist dependency
- Last Verified: June 2026
Overview
IBM Planning Analytics is an enterprise OLAP planning platform built on the TM1 in-memory multidimensional engine, designed for large organizations with $500M+ in revenue whose planning models span thousands of simultaneous data dimensions and require raw computational power that no cloud-native FP&A platform in this comparison can match.
IBM Planning Analytics traces its lineage to Applix TM1 (founded 1983), acquired by Cognos in 2007 and then by IBM in 2008 for approximately $4.9 billion, giving the IBM Planning Analytics platform over 35 years of enterprise planning heritage and one of the largest globally installed bases of any dedicated planning software.
IBM Planning Analytics offers two primary interfaces, Planning Analytics Workspace (PAW), a modern browser-based dashboard environment, and Planning Analytics for Excel (PAX), a full-featured Excel add-in retaining all TM1 calculation power within a spreadsheet surface, alongside hybrid SaaS and on-premise deployment options.
Key Features
- TM1 In-Memory OLAP Engine: IBM Planning Analytics’ TM1 in-memory OLAP engine performs calculations across multiple data dimensions simultaneously in RAM, enabling manufacturing enterprises to model thousands of SKUs × dozens of markets × multiple time periods × multiple cost categories in a single coherent plan that recalculates in seconds, a performance level no cloud-native FP&A platform or spreadsheet environment can match at equivalent model scale.
- Dual Interface Options (PAW and PAX): IBM Planning Analytics offers Planning Analytics Workspace (PAW) for a modern browser-based dashboard and visual data exploration environment, and Planning Analytics for Excel (PAX) retaining all TM1 calculation power within the familiar Excel spreadsheet surface, supporting both modern and traditional finance team workflows without forced migration from spreadsheets for teams that prefer them.
- Watson AI Integration with Additional Setup Requirements: IBM Planning Analytics integrates with Watson AI for natural language querying of planning data and automated anomaly detection, though Watson AI features require additional IBM Cloud services and configuration beyond the base IBM Planning Analytics license, making AI capability contingent on a separate IBM Cloud procurement and IT setup project not included in the base platform contract.
- Hybrid Deployment: SaaS and On-Premise: IBM Planning Analytics supports SaaS on IBM Cloud for organizations migrating to cloud-first infrastructure and on-premise server licensing for regulated industries in financial services, government, and healthcare with data residency requirements prohibiting storage of financial planning data on external cloud infrastructure, making IBM Planning Analytics the only platform in this comparison with a credible on-premise deployment option.
- IBM Ecosystem Native Integration: IBM Planning Analytics connects natively to IBM DB2 databases, IBM Cognos Analytics for BI and reporting, and IBM Cloud data services, providing integration depth for enterprises already running IBM infrastructure at the mainframe or enterprise middleware layer, reducing cross-platform data governance complexity.
Best For
IBM Planning Analytics is best for large enterprises ($500M+ revenue) in manufacturing, retail, financial services, or other industries where planning models require thousands of simultaneous dimensional intersections that would cause performance degradation in cloud-native alternatives, and specifically for organizations with existing TM1 or Cognos installations where migration cost and complexity exceed the value of switching, or with data residency requirements mandating on-premise deployment.
IBM Planning Analytics is explicitly not the right choice for organizations without an existing IBM ecosystem, a dedicated TM1 administrator function, or planning model complexity that genuinely requires OLAP-level computation beyond what every other platform in this comparison provides.
Pricing
IBM Planning Analytics does not publish a public price list as of June 2026. SaaS pricing on IBM Cloud is estimated at approximately $70–$90 per user per month for standard users, with additional charges for IBM Cloud infrastructure, storage, and computational capacity that scale with model size and user concurrency.
On-premise licensing involves perpetual license costs plus annual maintenance fees typically at 20–22% of license value annually. Total annual cost, including IBM Cloud infrastructure, implementation consulting from IBM Business Partners (typically $150,000–$500,000+ for enterprise deployments), and internal TM1 administrator staffing (1–3 FTE specialists), regularly exceeds $500,000/year for full enterprise implementations. Contact IBM’s enterprise sales team for a deployment-specific cost estimate; include all infrastructure, consulting, and staffing costs in any total cost of ownership analysis against alternatives.
Strengths
- 500+ G2 Reviews Validating TM1 Computational Differentiation: IBM Planning Analytics holds G2: 4.3/5.0 across 500+ reviews (the highest absolute review count among the enterprise platforms in this comparison) with enterprise users in manufacturing, retail, and financial services describing TM1’s dimensional calculation speed as a differentiating capability not available in their evaluated alternatives for their specific planning model complexity, per G2 reviews as of June 2026.
- Only On-Premise Deployment Option in This Comparison: IBM Planning Analytics supports on-premise deployment for regulated industries with data sovereignty or residency requirements (the only platform in this comparison with a credible on-premise path) making IBM Planning Analytics the required architectural choice for financial services firms, government entities, and healthcare organizations where applicable regulatory frameworks prohibit financial planning data from residing on external cloud infrastructure.
- 35+ Year TM1 Heritage and Global Practitioner Ecosystem: IBM Planning Analytics traces 35+ years of enterprise planning heritage from Applix (1983) through Cognos (2007) to IBM (2008), providing a global network of certified TM1 specialists, an established consulting partner community, and an academic TM1 developer curriculum, resources that reduce the specialist hiring risk that accompanies IBM Planning Analytics’ deployment model, relative to newer platforms without equivalent talent pools (IBM Planning Analytics product documentation, June 2026).
- Dual Interface Preserving TM1 Depth Across Workflow Preferences: IBM Planning Analytics’ dual interface strategy (PAW for modern browser-based dashboards and PAX for spreadsheet-native access) preserves TM1’s full computational depth across both modern and traditional finance team workflows, avoiding the forced interface migration that some enterprise platform transitions require.
Limitations
- Highest Total Cost of Ownership via Mandatory TM1 Specialist Dependency: IBM Planning Analytics’ most consequential limitation is its structural staffing requirement, 1–3 dedicated TM1 technical administrators who are entirely distinct from the finance team’s functional users, creating key-person risk, significant ongoing staffing cost not reflected in the software license, and 12–24+ week implementation timelines routinely underestimated during procurement; Gartner Peer Insights reviews consistently identify this “complexity tax” as IBM Planning Analytics’ defining structural limitation (2024–2025 reviews).
- r/FPandA Community Dominated by Exit Migration Discussions: r/FPandA and r/BusinessIntelligence discussions about IBM Planning Analytics are notably dominated by customers evaluating how to exit the platform, citing high maintenance burden, declining availability of TM1 administrator skills in the labor market, aging UI components in some modules, and preference for modern self-service UX as migration drivers, a community signal that the platform’s installed base faces ongoing competitive pressure from cloud-native alternatives (2024–2025 discussions).
- Watson AI Requires Separate IBM Cloud Investment Beyond Base License: IBM Planning Analytics’ Watson AI integration for natural language querying and anomaly detection requires additional IBM Cloud services and configuration beyond the base platform license, making AI capability contingent on a separate procurement and IT setup investment, unlike Datarails (FP&A Genius AI included) or Planful (Planful Predict included) where AI features are part of the core platform.
- PAW Self-Service Limited for Non-TM1-Trained Finance Users: IBM Planning Analytics’ Planning Analytics Workspace (PAW) interface, while more modern than older TM1 interfaces, still requires TM1 cube knowledge for non-trivial data exploration, meaning finance team members without TM1 training cannot effectively use PAW for self-service analysis, undermining the “modern browser-based dashboard” value proposition of the interface upgrade for organizations seeking self-service FP&A capabilities.
Verdict
IBM Planning Analytics delivers the TM1 OLAP engine’s multi-dimensional computational power for enterprises with planning model complexity that exceeds the ceiling of every cloud-native alternative in this comparison, a real and specialized capability for manufacturing, retail, and financial services companies with extremely large, multi-dimensional planning requirements that no other platform in this comparison can match on raw computational performance.
IBM Planning Analytics earns its place in this comparison specifically for the buyer segment whose needs no other platform addresses, not as a broadly recommended option, but as the correct choice when TM1 complexity or on-premise data residency requirements are genuine, non-negotiable constraints.
For all other buyers, IBM Planning Analytics’ combination of the highest total cost of ownership in this comparison, mandatory specialist administrator dependency, 12–24+ week implementation timelines, and an r/FPandA community discussion pattern dominated by exit migration planning makes every other platform in this comparison a stronger evidence-backed choice.
What Red Flags Should I Watch For When Evaluating Budgeting and Forecasting Software?
Six red flags consistently identify high-risk FP&A software purchases before contract signing. Each addresses the most common post-purchase regrets documented across the category in r/FPandA, G2 reviews, and Gartner Peer Insights data as of June 2026.
Red Flag #1: Vague AI Claims Without Live Demonstration
Every platform in this category now markets “AI-powered forecasting,” but three fundamentally different implementations exist:
- ML-based predictive forecasting trained on company-specific actuals (example: Planful Predict), generates statistically informed rolling forecast adjustments without manual formula updates
- LLM-based natural language querying of existing financial data (example: Datarails FP&A Genius), enables questions like “What drove Q3 variance?” without predicting future values
- Rule-based automation labeled as AI: automates recurring calculations or alerts without machine learning; the most common category of “AI-powered” claims in FP&A vendor marketing
Request a live demonstration of the specific AI feature on your own company’s financial data (not a vendor-curated demo dataset) before accepting any AI claim as a differentiator.
Red Flag #2: Mandatory Implementation Partner as a Pre-Requisite
Platforms requiring an authorized implementation partner before deployment (Vena Solutions, Anaplan, and IBM Planning Analytics in this comparison) add a second vendor relationship, additional cost beyond the software license, and timeline uncertainty buyers consistently underestimate. Confirm explicitly whether implementation partner involvement is mandatory, optional, or not required before engaging any sales process.
Red Flag #3: No Pricing Transparency and No Community Benchmarks
Only LiveFlow publishes self-serve pricing in this comparison. Every other platform requires a sales engagement before revealing any pricing. Ask sales teams directly for annual contract value ranges for companies at your revenue size and module scope, and cross-reference against community-sourced benchmarks in r/FPandA before trusting vendor-provided ranges as representative of market-rate pricing.
Red Flag #4: Support Quality Decline After Private Equity Acquisition
In this comparison, Anaplan (Thoma Bravo, 2022), Planful (Vector Capital), and Vena Solutions (Centana Growth Partners) are all PE-backed. Only Anaplan has generated documented community discussion of post-acquisition support decline, Planful and Vena Solutions have not triggered equivalent community concern as of June 2026. For any PE-owned platform, explicitly ask references: “How has support responsiveness and quality changed in the last 12–18 months?”
Red Flag #5: Reference Customers Not Comparable in Size or Industry
Vendor-provided reference customers are curated for success, not representativeness. Request references at your company size tier (revenue range and headcount), in your specific industry, using the same modules you plan to license, and who implemented within the past 18 months. References at different company sizes, in different industries, or with different module configurations provide limited predictive value for your deployment outcome.
Red Flag #6: Implementation Timeline Estimates From Marketing Materials
Vendor-marketing implementation timelines are consistently shorter than practitioner-reported actuals across this category. Datarails typically implements in weeks; Planful and Vena Solutions typically require 4–6 months; Anaplan and IBM Planning Analytics require 8–24 weeks minimum. Ask your sales contact for the median implementation timeline for the last 10 companies of your size, not the fastest deployment the vendor can name.
What Questions Should I Ask Before Choosing Budgeting and Forecasting Software?
Eight questions address the most common post-purchase regrets across the FP&A software category, total cost surprises, implementation accountability gaps, unverified AI claims, and data lock-in risk. Ask every vendor on your shortlist these questions before accepting a demo.
Question #1: What Is the Total Contract Value Including Implementation Consulting and Administrator Staffing?
Software license cost is only one component of FP&A platform investment. Ask vendors: “What is the typical total first-year cost for a company of our size, including software license, implementation consulting, and any specialist staffing required to maintain the platform post-deployment?” For Anaplan and IBM Planning Analytics, this gap often exceeds 2–3× the software license cost alone, a difference that changes the budget approval threshold significantly.
Question #2: Is an Implementation Partner Required, and Who Bears Accountability If Timelines Slip?
Ask explicitly: “Is an implementation partner mandatory for deployment, or can your own team lead our project?” For platforms requiring partners, ask who owns accountability if the implementation timeline extends beyond the agreed date, the software vendor, the implementation partner, or the buyer. The answer reveals whether the buyer bears all timeline and cost risk for third-party partner performance.
Question #3: Can You Demonstrate the AI Feature Live on Our Data, Not a Generic Dataset?
Request that any AI capability (natural language querying, predictive forecasting, anomaly detection) be demonstrated using your own company’s financial data, not the vendor’s curated demo dataset. A vendor AI that produces compelling results on pre-prepared demo data but requires months of model training on your own actuals before delivering comparable value represents a different time-to-value than the demo implies.
Question #4: What Does the Per-Module Pricing Structure Look Like for Our Full Anticipated Scope?
For platforms with modular pricing (Datarails, Planful, Vena Solutions, IBM Planning Analytics) ask for a full quote including every module you anticipate needing in the first 12 months, not just the modules in the initial scope. Mid-contract module additions are a common source of budget overruns across all modular FP&A platforms in this comparison.
Question #5: What Is the Median Implementation Timeline for Your Last 10 Customers at Our Company Size?
Request the median (not minimum or fastest) implementation timeline for the 10 most recently implemented customers at your company size and revenue range, using the same module configuration you’re evaluating. Vendor-marketing timelines consistently understate practitioner-reported actuals; the median actual is the defensible planning number.
Question #6: Can We Speak With References Who Implemented in the Last 12 Months at Our Company Size?
Request references specifically at your company size, in your industry, using the same modules, who implemented within the past 12 months. References from larger companies, different industries, or implementations completed more than 2 years ago provide limited predictive value for your deployment outcome.
Question #7: What Happens to Our Data and Models If We Decide to Leave the Platform?
Ask explicitly: “If we decide not to renew after Year 3, how do we export our planning models, historical data, and templates?” Platforms with proprietary model architectures (Anaplan’s Anaplan Modeling Language, IBM Planning Analytics’ TM1 cube structures) create structural switching costs that should be understood before signing a multi-year contract.
Question #8: How Does the Platform Integrate With Our Specific ERP Instance, and Who Has Done It Recently?
Ask for a named reference customer using your exact ERP system (specific version of NetSuite, SAP S/4HANA, Dynamics 365, or Sage Intacct) with a recent implementation within the past 18 months. A platform marketing “NetSuite integration” and reliably connecting to NetSuite mid-market with no custom development are different claims with materially different implementation realities.
How Did We Rank These Budgeting and Forecasting Platforms?
PlugRoute ranked these seven platforms by scoring each against six weighted criteria, applied equally to all platforms with no vendor relationships influencing scores at any stage. Primary criteria reflect the most common priorities of FP&A professionals evaluating dedicated platforms; secondary criteria differentiate platforms within tiers.
Evaluation Process
The PlugRoute research team evaluated each platform through a four-stage process:
- AI engine query analysis: Multiple AI search engines (Perplexity, ChatGPT) were queried to map current recommendation patterns and identify critical information gaps in existing AI-generated outputs about each platform.
- Independent web research: Each platform’s product pages, pricing pages, integration documentation, and case study libraries were reviewed directly as of June 2026.
- Third-party review platform analysis: G2 Budgeting and Forecasting category pages, Capterra product pages, and Gartner Peer Insights reviews were analyzed for each platform, with review counts and ratings recorded as of June 2026.
- Practitioner community sentiment analysis: Discussions on r/FPandA, r/Accounting, r/BusinessIntelligence, and r/QuickBooks were reviewed for community consensus on implementation timelines, pricing benchmarks, and post-purchase performance relative to vendor marketing claims.
Vendor-reported claims were cross-referenced against at least one independent source before being stated as fact. Claims corroborated only by vendor documentation are labeled as vendor-provided throughout this article.
Ranking Criteria
Each platform was scored against six criteria:
- User Satisfaction: Review Platform Ratings and Volume (Primary): Why it matters: Third-party review ratings and review volume on G2 and Capterra are the most objective available signal of real-user satisfaction at scale. Measured by G2 rating combined with review count weighting, plus Capterra rating, plus Gartner Peer Insights recognition as of June 2026. Consecutive Gartner Magic Quadrant Leader designations in Financial Planning Software receive additional analyst validation credit.
- Feature Completeness for Core FP&A Needs (Primary): Why it matters: Scenario planning, rolling forecast automation, driver-based modeling, and multi-entity consolidation determine whether a platform addresses the full planning cycle. Measured by assessment of documented capabilities verified against vendor product pages and G2 feature satisfaction data, not marketing copy alone.
- ERP and Accounting Integration Ecosystem (Primary): Why it matters: The most common post-purchase frustration in FP&A implementations is integration quality not matching marketing claims. Measured by count and coverage of native integrations on vendor integration pages, cross-validated with r/FPandA community reports of real integration experiences with specific ERP instances.
- Pricing Transparency and Value (Secondary): Why it matters: Pricing opacity is the most consistent community-reported frustration during FP&A evaluation. Measured by binary assessment of public pricing availability plus community-sourced annual contract ranges from r/FPandA discussions with explicit source dating.
- Implementation Accessibility and Time-to-Value (Secondary): Why it matters: Implementation timeline is the most underestimated factor in FP&A purchases and the most consistent source of post-purchase regret. Measured by practitioner-reported timelines from r/FPandA and G2/Gartner reviews; mandatory implementation partner requirements flagged as structural cost multipliers.
- Verified AI Capability Depth (Secondary): Why it matters: “AI-powered” ranges from genuine ML-based forecasting trained on company-specific actuals to rule-based automation relabeled as AI. Measured by classification of each platform’s AI feature into ML-based predictive, LLM-based querying, rule-based automation, or additional-services-required, sourced from vendor documentation, G2 feature reviews, and r/FPandA community reports.
Evidence Weighting
When review platform ratings conflict with Reddit sentiment, PlugRoute weights specificity and recency, a detailed 2025 r/FPandA post describing an implementation experience outweighs a generic 2023 G2 review. Community discussions identifying structural platform limitations are treated as architectural findings rather than individual complaints, and disclosed accordingly in each platform entry.
Data Validation
Vendor-reported statistics are labeled throughout this article. Only claims corroborated by at least one independent source (a named third-party case study, a G2 review, a Gartner Peer Insights rating, or a community discussion) are stated as fact without qualification. Pricing estimates not confirmed directly by vendors are labeled “community-sourced estimates” with appropriate date attribution and uncertainty caveats.
Update Cadence
This article was last updated in June 2026. PlugRoute refreshes rankings quarterly to reflect new G2 data cycles, Gartner Magic Quadrant updates, and material changes in platform pricing, ownership, or capabilities. Verify current ratings and pricing directly on vendor and review platform pages before any final procurement decision.
Independence Disclosure
PlugRoute has no affiliate relationships with any company listed in this article. Rankings are determined entirely by research data, third-party review evidence, and objective evaluation criteria applied equally to all platforms.
Frequently Asked Questions
What Is the Best Budgeting and Forecasting Software for a Small Business in 2026?
LiveFlow is the best budgeting software for small businesses in 2026, offering publicly listed pricing at $24–$79/month, sub-1-hour setup connecting QuickBooks Online, Xero, or NetSuite to Google Sheets, and 100+ pre-built financial templates requiring no IT involvement. For small businesses exceeding approximately 50 employees or $20M in revenue, Datarails is the recommended upgrade path with faster mid-market implementation than any enterprise alternative in this comparison.
What Is the Difference Between Datarails and Vena Solutions?
Datarails and Vena Solutions are both Excel-native FP&A platforms but differ on two critical dimensions: implementation speed and workflow governance depth. Datarails implements in weeks with lower configuration overhead and holds higher G2 ratings (4.7/5.0 vs. 4.3/5.0, June 2026); Vena Solutions provides deeper multi-stage approval workflows, cell-level access controls, and broader HR planning scope, at the cost of a mandatory implementation partner and longer timelines. Choose Datarails for speed; choose Vena Solutions for Microsoft-ecosystem governance depth.
How Does PlugRoute Determine Its Software Rankings?
PlugRoute scores all seven platforms against six weighted criteria (user satisfaction ratings, feature completeness for core FP&A needs, ERP integration ecosystem breadth, pricing transparency, implementation accessibility, and verified AI capability depth) with no vendor payments, sponsored placements, or affiliate relationships influencing any score at any stage. Full methodology details are in the “How Did We Rank These Platforms?” section above.
What Key Terms Should You Know Before Evaluating Budgeting and Forecasting Software?
Five terms appear throughout this comparison that are essential for evaluating FP&A software claims accurately. Understanding each term before your first vendor demo prevents marketing language from obscuring real capability differences between platforms.
FP&A (Financial Planning and Analysis): FP&A is the finance function responsible for budgeting, forecasting, financial modeling, and performance analysis, distinct from accounting (which records historical transactions) in that FP&A is forward-looking and analytical, helping leadership make decisions based on projected future financial outcomes rather than historical records.
Driver-Based Modeling: Driver-based modeling is an FP&A technique that links financial projections to operational inputs called “drivers” (such as headcount, unit volume, price per unit, or customer count) so when a driver assumption changes, all dependent financial figures update automatically without manual formula editing, enabling faster scenario analysis than static spreadsheet models.
Rolling Forecast: A rolling forecast is a financial projection that updates on a regular cadence (typically monthly or quarterly) and always extends the same number of periods forward (e.g., always 12 months ahead), replacing the traditional annual budget that fixes all projections at year-start and progressively becomes obsolete as business conditions change during the year.
OLAP (Online Analytical Processing): OLAP is a database architecture for analyzing large volumes of financial and operational data across multiple simultaneous dimensions (for example, revenue by product × region × time period × sales channel) enabling complex cross-dimensional calculations to run in seconds rather than minutes; IBM Planning Analytics’ TM1 engine is an in-memory OLAP database purpose-built for this workload.
Multi-Entity Consolidation: Multi-entity consolidation is the financial process of combining statements from multiple legal entities (subsidiaries, divisions, or international entities) into a single set of consolidated financial statements, including eliminating intercompany transactions; dedicated FP&A platforms handle this automatically, while spreadsheet-only environments require significant manual work each reporting cycle.
Glossary: Key Terms Used in This Comparison
Connected Planning: A software architecture that links financial, workforce, sales, and supply chain planning on a single shared data model, so a change in one business domain automatically propagates across all connected functions without manual reconciliation between systems.
OLAP (Online Analytical Processing): A database architecture that analyzes large volumes of data across multiple simultaneous dimensions (such as revenue by product × region × time period) enabling complex cross-dimensional calculations to run in seconds; IBM Planning Analytics’ TM1 engine is an in-memory OLAP database purpose-built for this workload.
Driver-Based Modeling: An FP&A technique that links financial projections to operational inputs called “drivers” (such as headcount, unit volume, or customer count) so when a driver assumption changes, all dependent financial figures update automatically without manual formula editing, enabling faster scenario analysis than static spreadsheet models.
Rolling Forecast: A financial projection that updates on a regular cadence and always extends the same number of periods forward, replacing the traditional annual budget that fixes all projections at year-start and progressively becomes obsolete as business conditions change throughout the year.
Multi-Entity Consolidation: The financial process of combining statements from multiple legal entities (subsidiaries, divisions, or international entities) into a single set of consolidated financial statements, including eliminating intercompany transactions; dedicated FP&A platforms handle this automatically, while spreadsheet-only environments require significant manual work each reporting cycle.
Which Budgeting and Forecasting Platform Is Right for You?
The right budgeting and forecasting platform depends on four variables: company size, IT stack preferences, workflow complexity, and regulatory obligations, not on which platform ranks first in a generic comparison without company-size context.
Key Insights
- The budgeting software category spans a 100× annual cost difference: from $288/year (LiveFlow Starter) to $200,000+/year (Anaplan average enterprise contract), which means evaluating platforms without a company-size tier filter is not a comparison; it is noise.
- Evaluate within your company-size tier first: Comparing LiveFlow against Anaplan in the same decision set wastes evaluation time, the correct starting point is identifying which architecture type and tier serves your company before comparing individual platform features.
- LiveFlow is the only transparently priced platform in this comparison: Every platform except LiveFlow requires a sales call before revealing any pricing; budget evaluation conversations with other vendors should explicitly request annual contract value ranges for companies at your revenue size before entering a full sales cycle.
- Budget 4–6 months for mid-market implementations and 8–24 weeks for enterprise: Planful and Vena Solutions implementations regularly extend to 4–6 months; Anaplan and IBM Planning Analytics require 8–24 weeks minimum, not the shorter timelines some vendors present during initial sales conversations.
- AI taxonomy matters for buying decisions: ML-based predictive forecasting trained on your company’s actuals (Planful Predict), LLM-based natural language querying of existing data (Datarails FP&A Genius), and rule-based automation are meaningfully different capabilities; request live demonstrations on your own data before accepting “AI-powered” as a differentiator.
- Workiva serves compliance-first organizations, not pure FP&A buyers: Publicly traded companies and regulated enterprises with SEC, ESG, or SOX obligations should evaluate Workiva as a compliance-plus-planning platform; private mid-market companies without these obligations will overpay significantly for planning capabilities that Datarails or Planful provide at lower cost.
- r/FPandA practitioner discussions provide the most vendor-neutral implementation benchmarks available: The FP&A practitioner community at reddit.com/r/FPandA provides implementation timeline reality, post-purchase limitation data, and pricing benchmark intelligence that vendor marketing and LLM-generated summaries consistently omit, check r/FPandA before finalizing any vendor shortlist.
Your Next Steps
- Identify your architecture tier from the Quick Decision Framework table above
- Run the eight evaluation questions in this article by every vendor on your shortlist before accepting a demo
- Cross-reference any vendor’s AI claims against the three-type AI taxonomy in Red Flag #1 before treating them as differentiators
- Search r/FPandA for your top two vendors, filtering by posts from the last 18 months for the most current implementation intelligence
- Ask shortlisted vendors for references at companies your size who implemented within the past 12 months, not their largest or oldest customer stories
For mid-market FP&A professionals at $20M–$500M revenue companies: start with Datarails for the fastest implementation and broadest integration coverage, or evaluate Vena Solutions if Microsoft ecosystem depth and multi-stage approval governance are the primary requirement. For finance teams that also manage monthly close and consolidation, add Planful to the evaluation.
For SMBs, accounting firms, and startup finance teams: LiveFlow delivers immediate professional-quality reporting at $24–$79/month without the procurement complexity, implementation timelines, or pricing opacity that characterize every other platform in this comparison, and it is the only platform evaluable without a sales call.
We update this guide quarterly. Last updated: June 2026.
For independent, affiliate-free software analysis across FP&A and all major SaaS categories, visit PlugRoute.